Sive Morten
Special Consultant to the FPA
- Messages
- 18,673
Fundamentals
Weekly Gold Tading Report prepared by Sive Morten exclusively for ForexPeaceArmy.com
Reuters reports Gold reversed earlier losses on Friday as the dollar fell after weaker-than-expected U.S. data, but prices remained on course for their biggest monthly decline in more than two years on expectations the Federal Reserve will soon raise interest rates.
A U.S. government index on employment costs rose less than forecast. "There is no wage inflation in the U.S. and that was the trigger for the sharp move in the euro/dollar rate, which is in turn lending support to the entire commodity sector," Commerzbank analyst Daniel Briesemann said.
U.S. gold for August delivery climbed 0.6 percent to settle at $1,094.90 an ounce.
Investor confidence was shaken last week with when bullion prices tumbled to a 5-1/2-year low of $1,077 on July 24. The metal has lost 6.4 percent so far this month, its steepest decline since June 2013.
Figures had shown a second-quarter improvement in U.S. economic growth on Thursday, which led investors to increase bets the Federal Reserve was on track to raise interest rates, possibly at its next meeting in September.
The next crucial data release is U.S. nonfarm payroll figures, due on Aug. 7. "If we get a very strong labor market report next week then this gold strength is going to be reversed," Briesemann said.
Waning investment demand and weak physical appetite for gold also pose a further downside risk for prices, said Argonaut Securities analyst Helen Lau.
Investors worldwide pulled $1.2 billion out of precious metals funds in the week ended July 29, a Bank of America Merrill Lynch Global Research report showed.
"Physical demand has been on the low side with premiums in China and India hardly moving," MKS Group trader Jason Cerisola said in a note.
On the Shanghai Gold Exchange, premiums stood at just over $1 an ounce on the London spot price, traders said.
Hedge fund mogul Paulson: Gold is now 'fairly valued'
Billionaire hedge fund manager John Paulson, one of the world's most influential gold investors, said on Friday that the metal is now at an appropriate price level, following last week's rout that dragged prices to five-year lows.
Paulson, in his first public comments since the recent price crash, said his firm, Paulson & Co. Inc., has retained a 10 million share stake, now worth about $1 billion, in SPDR Gold Trust , which tracks the price of gold.
"I think gold is fairly valued today," Paulson said in an interview, adding that the market was starting to balance.
"As Western demand for gold falls because the fear of inflation is low, demand out of Asia continues to grow for it as a store of value and for use in jewelry," he said.
His outlook on gold suggests prices have little room to recover significantly as the Federal Reserve prepares to hike interest rates, probably as early as later this year, but may reassure nervous investors who have speculated whether Western funds joined the mass selling that saw prices sink 4 percent in a matter of seconds last week.
More than $500 million of gold futures were dumped in last week's sudden selloff.
On Friday, gold was at $1,094.91 an ounce, down 16 percent since the middle of January and off from a record peak of $1,900 hit four years ago.
While Paulson's hedge fund was the single largest investor in the SPDR Gold Trust at the end of the first quarter, the position, now worth about $1.05 billion, is a small portion of the $20 billion Paulson & Co's holdings. It was not among the top three holdings for the firm at the end of the quarter, according to regulatory filings.
The fund had 10.23 million shares in the SPDR Gold Trust as of March 31, and the position has not changed materially since then. Regulatory filings for second-quarter holdings will be released in August.
Paulson called the position small, but said it was a reasonable one to have because it is a hedge against the unforeseen.
SPDR Gold Trust is down 13 percent since March and down 43 percent from September 2011, when gold hit its record high.
Paulson's view on gold has been closely followed ever since he earned roughly $5 billion on a bet on the metal in 2010, following on the heels of a similarly successful $4 billion payday on his bet against the overheated housing market in 2007.
The 59-year old financier, known as a patient and long-term investor, backed off a more massive gold bet two years ago when he cut his stake in SPDR Gold Trust by roughly half, from 21.8 million shares, regulatory filings show.
Paulson & Co.'s portfolio looks very different today than it did three years ago when some portfolios invested as much as 25 percent in gold and mining stocks, and were hit hard by the metal's drop.
At the end of the 2015 first quarter, Paulson & Co had more bets on pharmaceutical and healthcare stocks than metals, owning names like Shire , Allergan , Valeant and Mylan .
"We have almost nothing in metals and very little in gold," Paulson said, adding that healthcare and pharmaceuticals stocks are the firm's biggest holdings now.
At the end of the first quarter the firm owned 26.2 million shares of miner AngloGold Ashanti , down from 27.9 million shares at the end of the first quarter in 2014. AngloGold's share price has fallen 29 percent this year.
Paulson's Advantage fund, once one of the firm's biggest and which contains some of the gold investment, was off 0.26 percent in the first two weeks of July, according to an investor. Paulson declined to say how the fund performed in the last two weeks.
Paulson's other funds have fared better, including Paulson Enhanced, which was up 19 percent for the first half of the year.
Paulson had launched a separate gold fund in 2010, but the firm stopped actively marketing it to investors two years ago after gold prices began to tumble.
"The gold fund is in hibernation, it makes up a little over 1 percent of our assets and we don't market it, but we keep it alive," Paulson said, adding, "I haven't given up interest."
CFTC DATA
Hedge funds and money managers maintained their first bearish stance in COMEX gold on record during the week ended July 28, U.S. government data showed on Friday, suggesting the recent mass exodus from bullion was more than a kneejerk reaction.
They dialed back a net short position in silver futures and options from record levels and trimmed a bearish stance in copper, Commodity Futures Trading Commission (CFTC) data showed.
The dealers slightly adjusted their net short in gold, lower by just 10 contracts to 11,334 contracts, the data showed. The previous week they switched to a bearish stance for the first time in at least a decade.
The tweak came as prices hovered near 2010 lows. Gold, typically seen as a hedge against inflation, was poised for its biggest monthly decline in over two years as expectations mount that the U.S. Federal Reserve will soon hike interest rates.
Speculators lowered a bearish silver stance to 10,447 lots, down from the previous week's record by 1,067 contracts, CFTC said. The reduction came in a week that prices set and then nosed up from a six-year low.
Last week CFTC shows huge drop in open interest for ~80K contracts. But if we will take a look at positions then we will see that this drop was not due speculators but hedgers. Speculators still stand on the same tendency – increasing shorts and decreasing longs. While hedgers’ positions, as longs as shorts were closed at almost equal amount of 40K each. So, right now long and short speculative positions are almost equal and do not prevent further downward action on gold market. At the same time they do not forbid upside retracement as well.
Here is detailed breakdown of speculative positions:
Open interest:
 Shorts:
 Longs:
 Summary:
Technicals
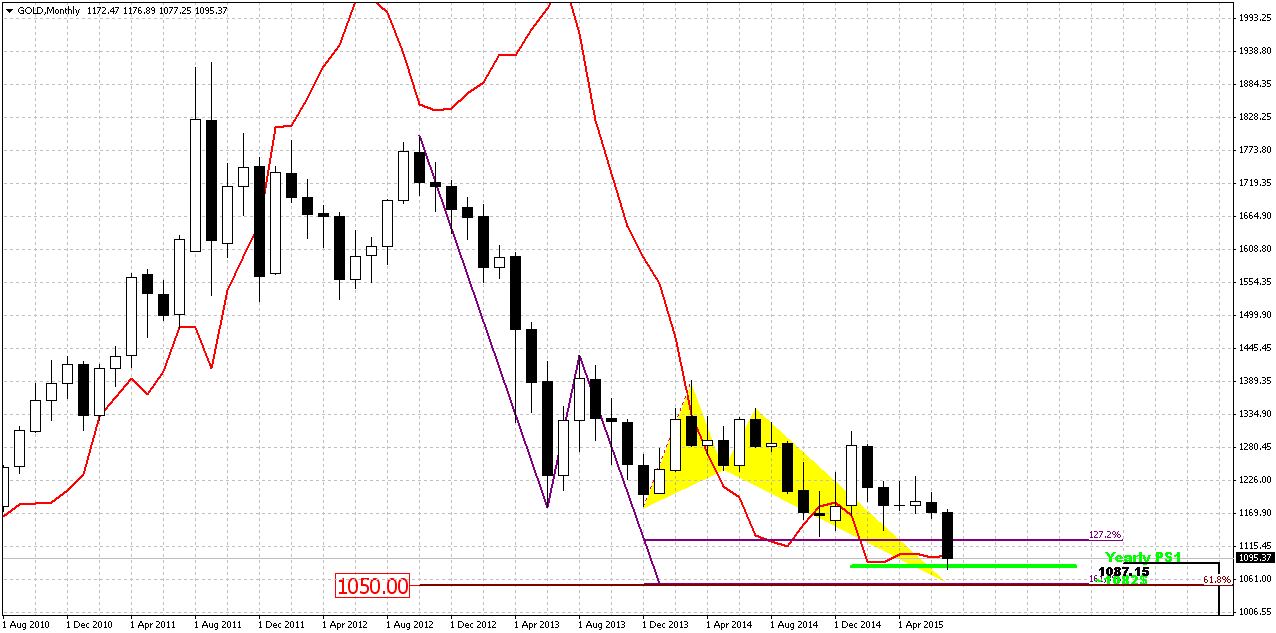
Monthly
In last two weeks market shows outstanding bearish action and finally has completed one of our long-term targets – 1080. So currently we could say that monthly bearish dynamic pressure pattern has hit its minimal target. It does not mean that market can’t go down further, it just means that if market suddenly will turn up – dynamic pressure should be treated as “completed”.
So, now we have just one long-term pattern in progress that has not achieved it’s target yet. This is VOB pattern. It suggests at least 0.618 AB-CD down. And this target is 1050$. Taking into consideration CFTC data and the fact that 1050 is just 30 bucks lower, it seems that hardly it will be problem for market to reach it.
We also have got completed pivot points framework target. Again it has confirmed its reliability. Once we’ve said that in the beginning of the year market showed solid upside action. Gold was able to exceed yearly pivot, passed half way to Yearly Pivot resistance 1 but right now has reversed down and closed below YPP. From technical point of view this is bearish sign and market has hit next destination point of this analysis –yearly pivot support 1 around 1083$.
Last week we’ve placed article concerning relation between gold price and mine companies and it uncover myths about possible gold drop. Many analysts tell that gold can’t drop below 1000 $ since it is middle mining expenses of gold. But text above shed some lights on this question and tells that it is not quite so and gold could drop even to 800 or even lower before this relation of price and extraction costs will impact market. Last week such companies as Yamana gold, Eldorado gold, Gold Corp. have released earnings reports. Thus Yamana shows extraction cost at ~560$ per Oz. This is very low. Gold Corp. shows extraction cost at ~850$. These numbers clearly shows that 1000-1100 is not drastical level yet. Thus, although our next target stands at 1050$, our mind should be open to any scenario and even to possible further drop of gold price. May be this will not happen, but if our analysis will give us clear signs and patterns that this should happen, we should not be stubborn and ignore this scenario.
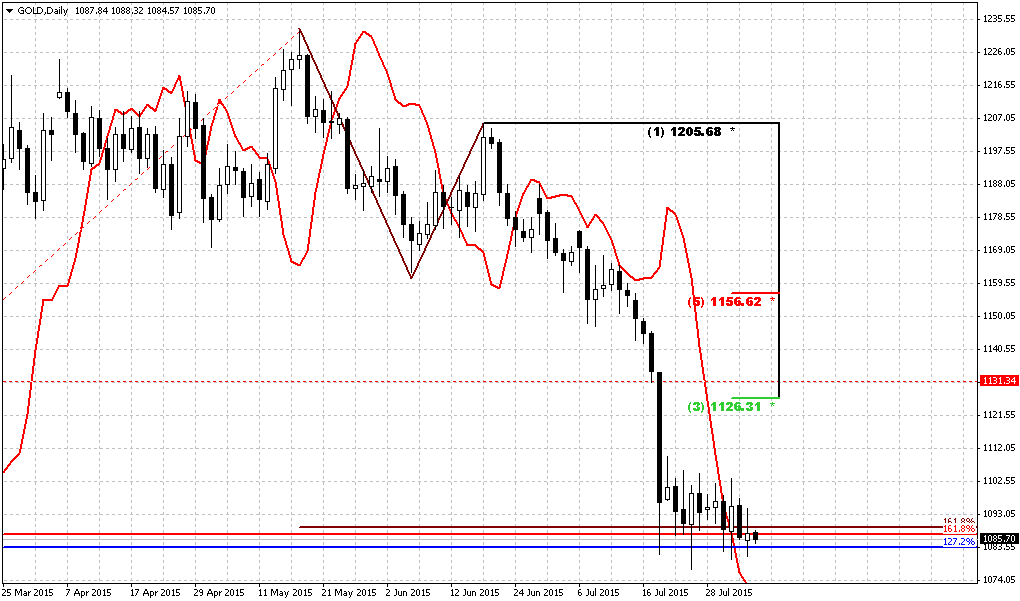
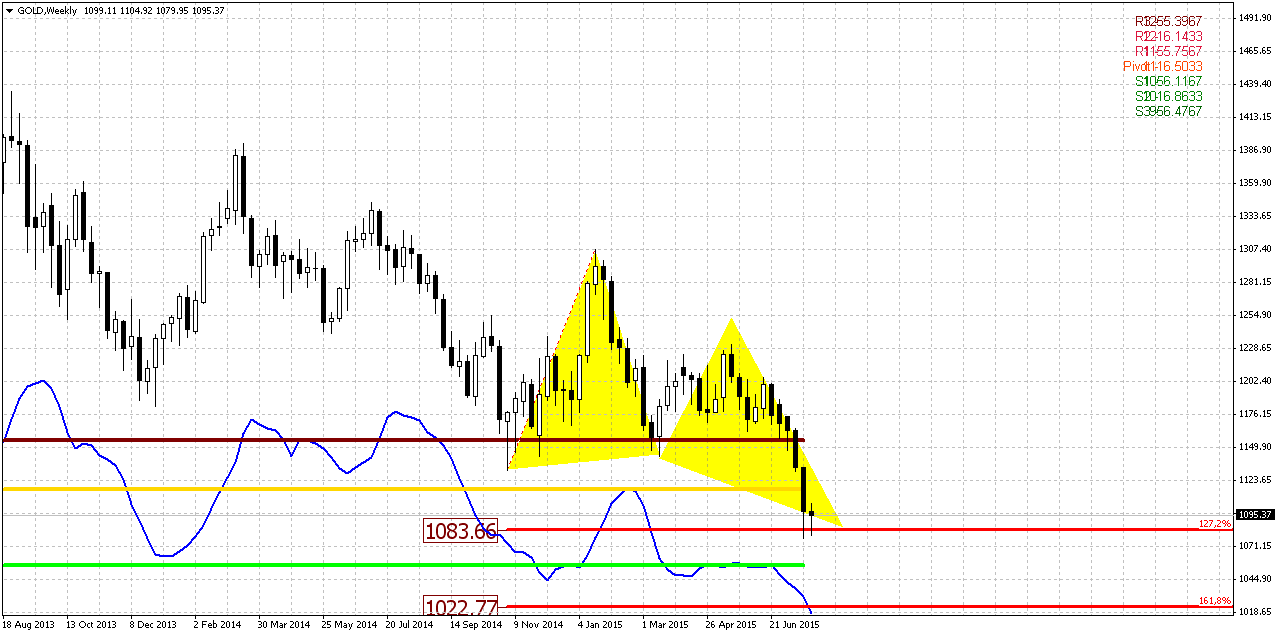
Weekly
Last week mostly was inside one. Trend is bearish here. Weekly setup has worked at 100%. Market has hit 1080 target. Still this is just first destination of butterfly – 1.27 extension. As we see acceleration right this level, there are big chances that market will go to next one – 1.618 around 1025 area.
At the same time, as market right now stands at strong support, chances on short-term upside bounce still exist and may be we’ve seen its start on Friday.
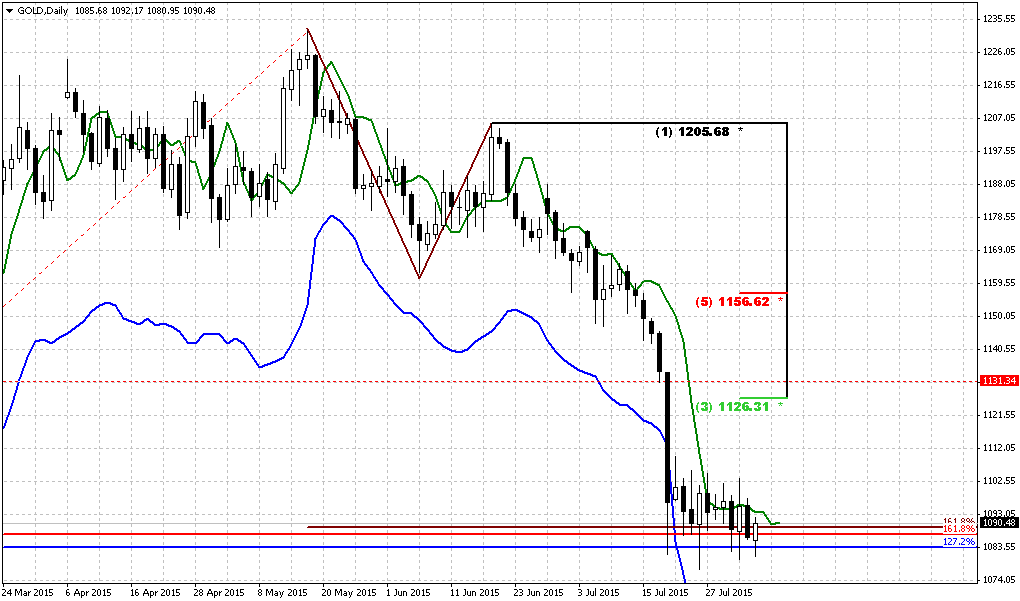
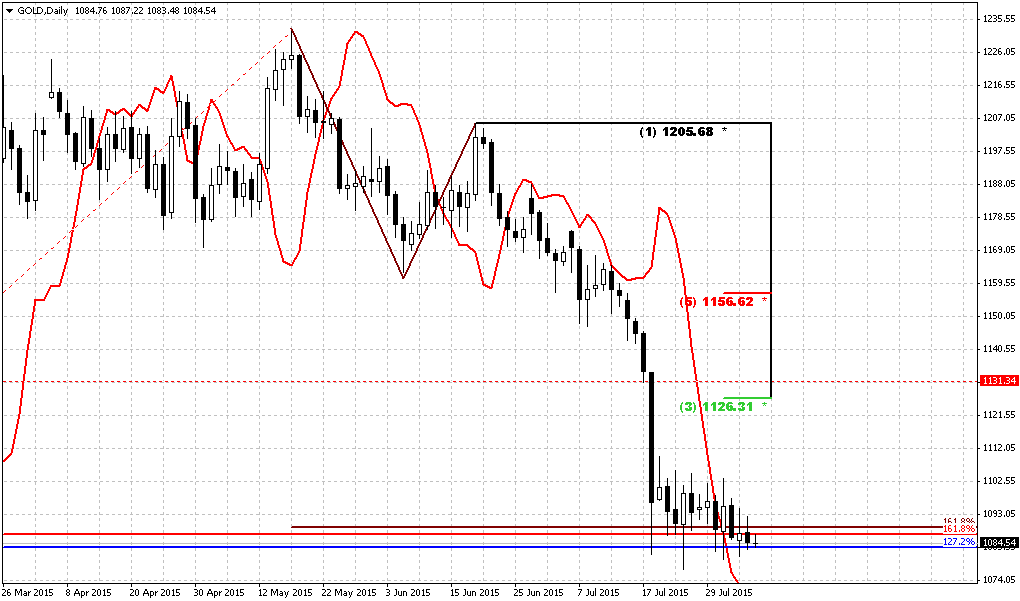
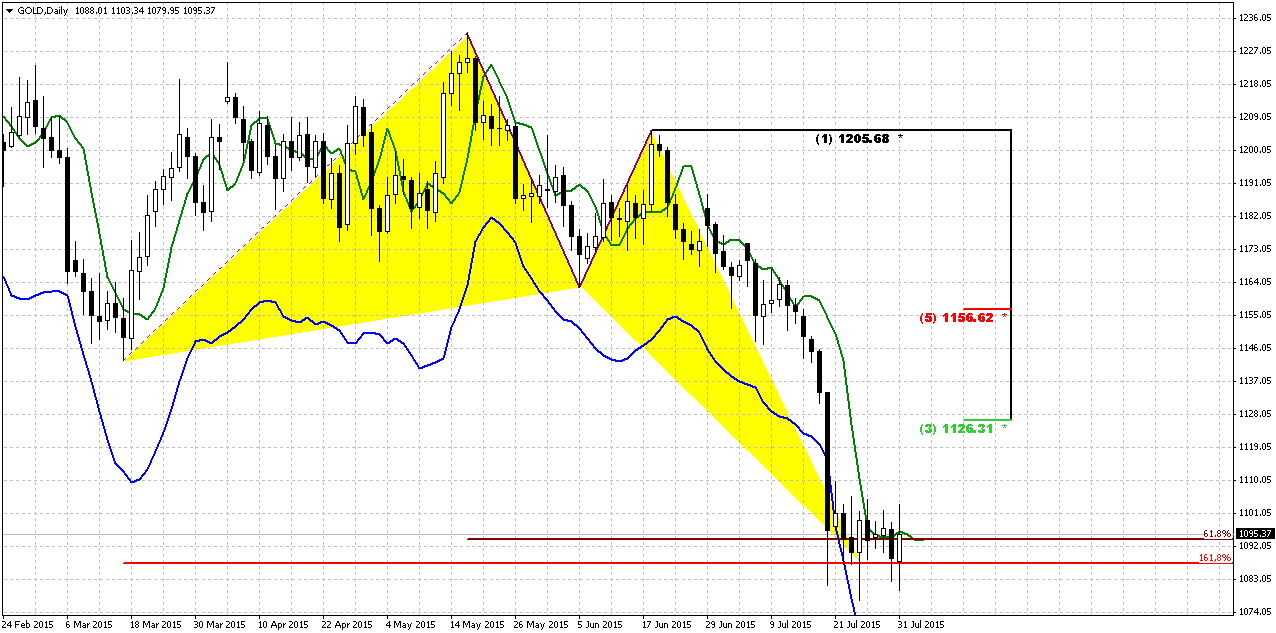
Daily
Daily chart again provides major information for short-term trading. 1080 level, as we’ve mentioned many times, was oversold, is butterfly and inner AB-CD 1.618 targets. Also this is YPS1. So, as a result we have impressive gathering of supports of different kind. We expect that gold could re-test previously broken important 1130 lows. As a result we could get some DiNapoli directional pattern and shape of DRPO “Buy” is becoming brighter as time is passing by. Right now we have first close above 3x3 DMA, close below. On Friday we haven’t got second close above 3x3 and in general ECI report has brought adjustments to normal market behavior that we’ve expected. Anyway, may be we will get second close above 3x3 next week.
Second close still could happen differently. Thus, on Friday we’ve mentioned bearish grabber and it still could work, if market will erase Friday’s rally. But actually we’re interesting in DRPO. If market will clear out lows first and show second close above 3x3 DMA second – this will be OK. Or if grabber will fail and market directly will move higher and give us second close above 3x3 DMA – that also will be OK. In fact gold has no important reasons to show W&R, since major 1.618 AB=CD target already has been hit.
So, short-term conclusion – it is too early to go short, since market at strong support and oversold. If DRPO will be formed and will not fail – gold probably will hit predefined 1126-1130 level. So currently we do not see any problems with this scenario.
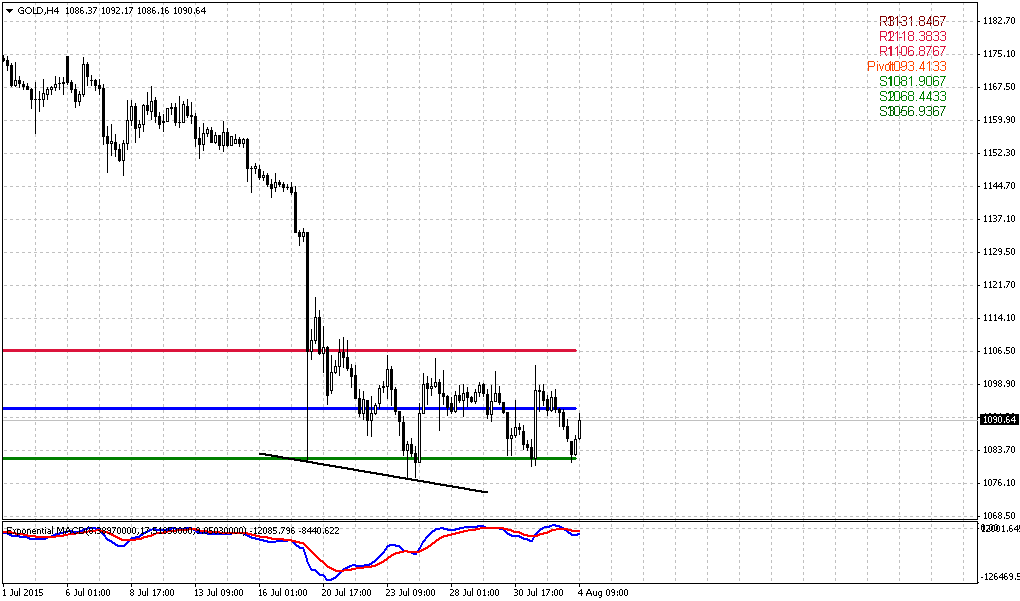
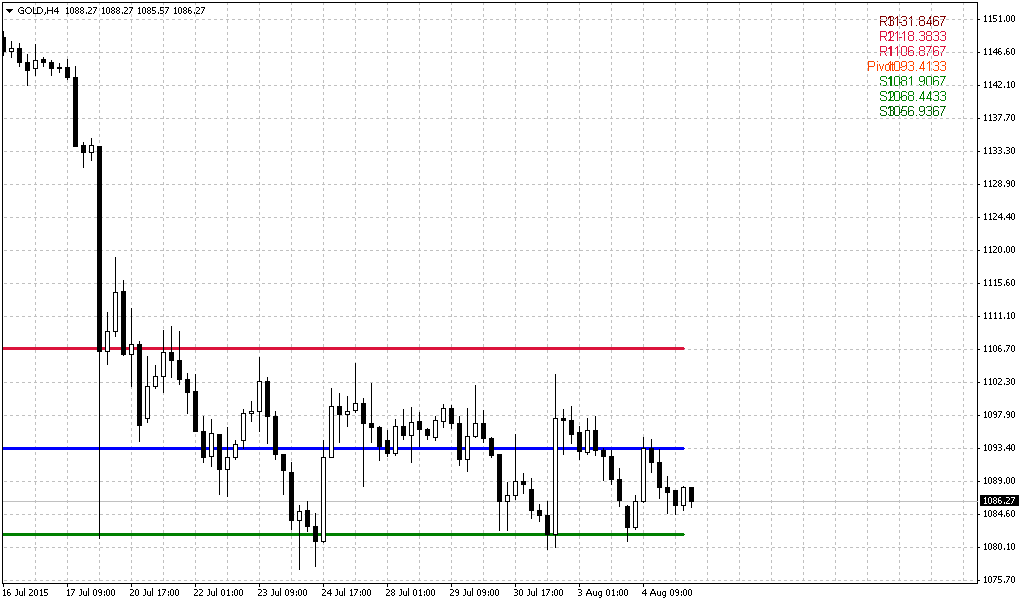
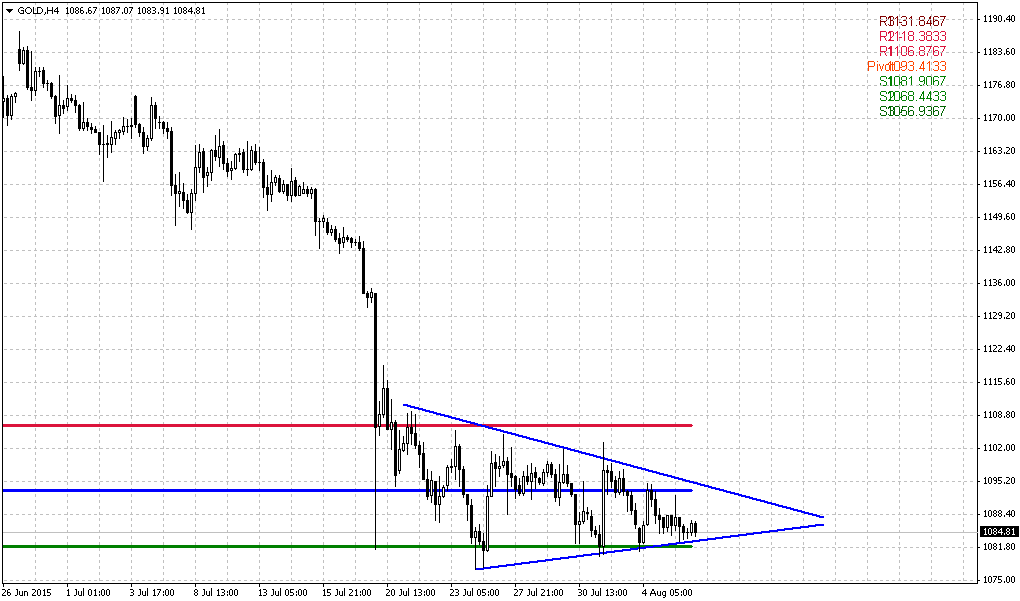
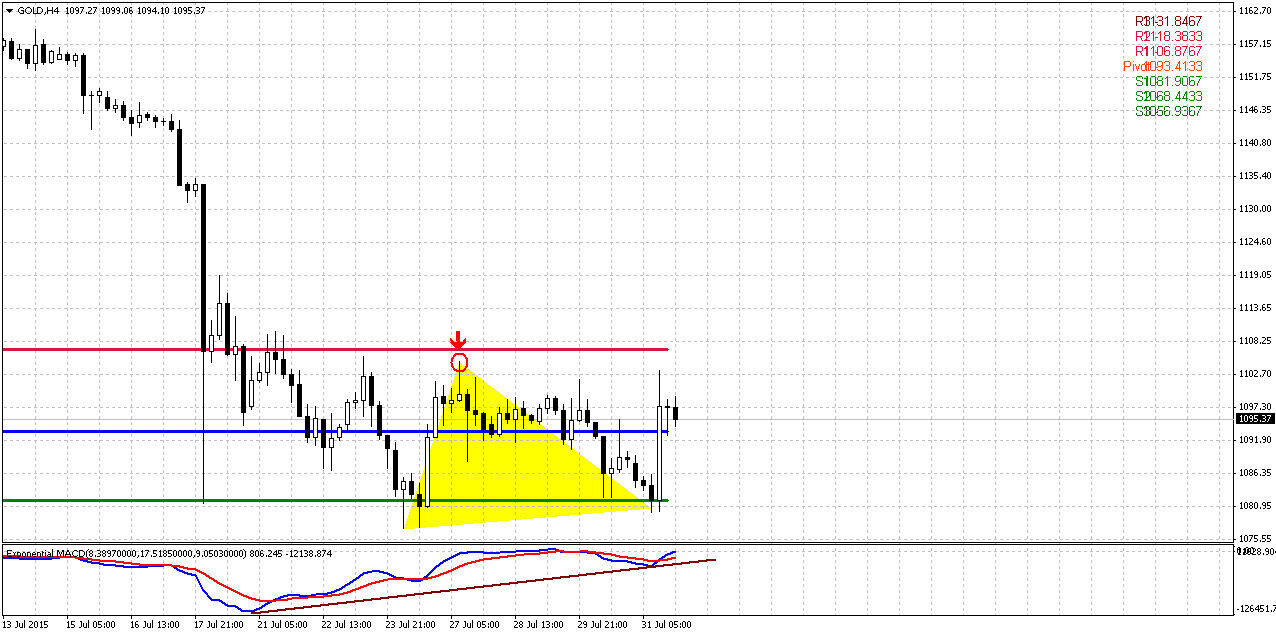
4-hour
This chart does not bring anything special. Recent rally was impressive but we should not overestimate its importance. Take a look that the same scale upside action last week has finished fast and hasn’t got any upside continuation. Chances on appearing of butterfly are still exist here, but it just has changed the shape a bit. Still, if DRPO will be formed, we can’t exclude direct upside continuation. Recent action has some signs of Triple bottom pattern, accompanied by MACD bullish divergence.
So, we will watch for 1100 top (in red circle). If market will move above it – butterfly will be vanished and DRPO probably will be confirmed. This will give us more confidence with possible upside scenario to 1130 area.
Conclusion:
Long-term picture remains bearish and we do not see any serious headwinds for further downward continuation. 1050 is probably nearest perspective that we could imagine, because gold really could drop even lower.
On short-term charts market stands at strong support that could launch short-term technical bounce to 1130 area. Daily traders should watch daily DRPO “Buy” pattern.
The technical portion of Sive's analysis owes a great deal to Joe DiNapoli's methods, and uses a number of Joe's proprietary indicators. Please note that Sive's analysis is his own view of the market and is not endorsed by Joe DiNapoli or any related companies.
Weekly Gold Tading Report prepared by Sive Morten exclusively for ForexPeaceArmy.com
Reuters reports Gold reversed earlier losses on Friday as the dollar fell after weaker-than-expected U.S. data, but prices remained on course for their biggest monthly decline in more than two years on expectations the Federal Reserve will soon raise interest rates.
A U.S. government index on employment costs rose less than forecast. "There is no wage inflation in the U.S. and that was the trigger for the sharp move in the euro/dollar rate, which is in turn lending support to the entire commodity sector," Commerzbank analyst Daniel Briesemann said.
U.S. gold for August delivery climbed 0.6 percent to settle at $1,094.90 an ounce.
Investor confidence was shaken last week with when bullion prices tumbled to a 5-1/2-year low of $1,077 on July 24. The metal has lost 6.4 percent so far this month, its steepest decline since June 2013.
Figures had shown a second-quarter improvement in U.S. economic growth on Thursday, which led investors to increase bets the Federal Reserve was on track to raise interest rates, possibly at its next meeting in September.
The next crucial data release is U.S. nonfarm payroll figures, due on Aug. 7. "If we get a very strong labor market report next week then this gold strength is going to be reversed," Briesemann said.
Waning investment demand and weak physical appetite for gold also pose a further downside risk for prices, said Argonaut Securities analyst Helen Lau.
Investors worldwide pulled $1.2 billion out of precious metals funds in the week ended July 29, a Bank of America Merrill Lynch Global Research report showed.
"Physical demand has been on the low side with premiums in China and India hardly moving," MKS Group trader Jason Cerisola said in a note.
On the Shanghai Gold Exchange, premiums stood at just over $1 an ounce on the London spot price, traders said.
Hedge fund mogul Paulson: Gold is now 'fairly valued'
Billionaire hedge fund manager John Paulson, one of the world's most influential gold investors, said on Friday that the metal is now at an appropriate price level, following last week's rout that dragged prices to five-year lows.
Paulson, in his first public comments since the recent price crash, said his firm, Paulson & Co. Inc., has retained a 10 million share stake, now worth about $1 billion, in SPDR Gold Trust , which tracks the price of gold.
"I think gold is fairly valued today," Paulson said in an interview, adding that the market was starting to balance.
"As Western demand for gold falls because the fear of inflation is low, demand out of Asia continues to grow for it as a store of value and for use in jewelry," he said.
His outlook on gold suggests prices have little room to recover significantly as the Federal Reserve prepares to hike interest rates, probably as early as later this year, but may reassure nervous investors who have speculated whether Western funds joined the mass selling that saw prices sink 4 percent in a matter of seconds last week.
More than $500 million of gold futures were dumped in last week's sudden selloff.
On Friday, gold was at $1,094.91 an ounce, down 16 percent since the middle of January and off from a record peak of $1,900 hit four years ago.
While Paulson's hedge fund was the single largest investor in the SPDR Gold Trust at the end of the first quarter, the position, now worth about $1.05 billion, is a small portion of the $20 billion Paulson & Co's holdings. It was not among the top three holdings for the firm at the end of the quarter, according to regulatory filings.
The fund had 10.23 million shares in the SPDR Gold Trust as of March 31, and the position has not changed materially since then. Regulatory filings for second-quarter holdings will be released in August.
Paulson called the position small, but said it was a reasonable one to have because it is a hedge against the unforeseen.
SPDR Gold Trust is down 13 percent since March and down 43 percent from September 2011, when gold hit its record high.
Paulson's view on gold has been closely followed ever since he earned roughly $5 billion on a bet on the metal in 2010, following on the heels of a similarly successful $4 billion payday on his bet against the overheated housing market in 2007.
The 59-year old financier, known as a patient and long-term investor, backed off a more massive gold bet two years ago when he cut his stake in SPDR Gold Trust by roughly half, from 21.8 million shares, regulatory filings show.
Paulson & Co.'s portfolio looks very different today than it did three years ago when some portfolios invested as much as 25 percent in gold and mining stocks, and were hit hard by the metal's drop.
At the end of the 2015 first quarter, Paulson & Co had more bets on pharmaceutical and healthcare stocks than metals, owning names like Shire , Allergan , Valeant and Mylan .
"We have almost nothing in metals and very little in gold," Paulson said, adding that healthcare and pharmaceuticals stocks are the firm's biggest holdings now.
At the end of the first quarter the firm owned 26.2 million shares of miner AngloGold Ashanti , down from 27.9 million shares at the end of the first quarter in 2014. AngloGold's share price has fallen 29 percent this year.
Paulson's Advantage fund, once one of the firm's biggest and which contains some of the gold investment, was off 0.26 percent in the first two weeks of July, according to an investor. Paulson declined to say how the fund performed in the last two weeks.
Paulson's other funds have fared better, including Paulson Enhanced, which was up 19 percent for the first half of the year.
Paulson had launched a separate gold fund in 2010, but the firm stopped actively marketing it to investors two years ago after gold prices began to tumble.
"The gold fund is in hibernation, it makes up a little over 1 percent of our assets and we don't market it, but we keep it alive," Paulson said, adding, "I haven't given up interest."
CFTC DATA
Hedge funds and money managers maintained their first bearish stance in COMEX gold on record during the week ended July 28, U.S. government data showed on Friday, suggesting the recent mass exodus from bullion was more than a kneejerk reaction.
They dialed back a net short position in silver futures and options from record levels and trimmed a bearish stance in copper, Commodity Futures Trading Commission (CFTC) data showed.
The dealers slightly adjusted their net short in gold, lower by just 10 contracts to 11,334 contracts, the data showed. The previous week they switched to a bearish stance for the first time in at least a decade.
The tweak came as prices hovered near 2010 lows. Gold, typically seen as a hedge against inflation, was poised for its biggest monthly decline in over two years as expectations mount that the U.S. Federal Reserve will soon hike interest rates.
Speculators lowered a bearish silver stance to 10,447 lots, down from the previous week's record by 1,067 contracts, CFTC said. The reduction came in a week that prices set and then nosed up from a six-year low.
Last week CFTC shows huge drop in open interest for ~80K contracts. But if we will take a look at positions then we will see that this drop was not due speculators but hedgers. Speculators still stand on the same tendency – increasing shorts and decreasing longs. While hedgers’ positions, as longs as shorts were closed at almost equal amount of 40K each. So, right now long and short speculative positions are almost equal and do not prevent further downward action on gold market. At the same time they do not forbid upside retracement as well.
Here is detailed breakdown of speculative positions:
Open interest:
Technicals
Monthly
In last two weeks market shows outstanding bearish action and finally has completed one of our long-term targets – 1080. So currently we could say that monthly bearish dynamic pressure pattern has hit its minimal target. It does not mean that market can’t go down further, it just means that if market suddenly will turn up – dynamic pressure should be treated as “completed”.
So, now we have just one long-term pattern in progress that has not achieved it’s target yet. This is VOB pattern. It suggests at least 0.618 AB-CD down. And this target is 1050$. Taking into consideration CFTC data and the fact that 1050 is just 30 bucks lower, it seems that hardly it will be problem for market to reach it.
We also have got completed pivot points framework target. Again it has confirmed its reliability. Once we’ve said that in the beginning of the year market showed solid upside action. Gold was able to exceed yearly pivot, passed half way to Yearly Pivot resistance 1 but right now has reversed down and closed below YPP. From technical point of view this is bearish sign and market has hit next destination point of this analysis –yearly pivot support 1 around 1083$.
Last week we’ve placed article concerning relation between gold price and mine companies and it uncover myths about possible gold drop. Many analysts tell that gold can’t drop below 1000 $ since it is middle mining expenses of gold. But text above shed some lights on this question and tells that it is not quite so and gold could drop even to 800 or even lower before this relation of price and extraction costs will impact market. Last week such companies as Yamana gold, Eldorado gold, Gold Corp. have released earnings reports. Thus Yamana shows extraction cost at ~560$ per Oz. This is very low. Gold Corp. shows extraction cost at ~850$. These numbers clearly shows that 1000-1100 is not drastical level yet. Thus, although our next target stands at 1050$, our mind should be open to any scenario and even to possible further drop of gold price. May be this will not happen, but if our analysis will give us clear signs and patterns that this should happen, we should not be stubborn and ignore this scenario.
Weekly
Last week mostly was inside one. Trend is bearish here. Weekly setup has worked at 100%. Market has hit 1080 target. Still this is just first destination of butterfly – 1.27 extension. As we see acceleration right this level, there are big chances that market will go to next one – 1.618 around 1025 area.
At the same time, as market right now stands at strong support, chances on short-term upside bounce still exist and may be we’ve seen its start on Friday.
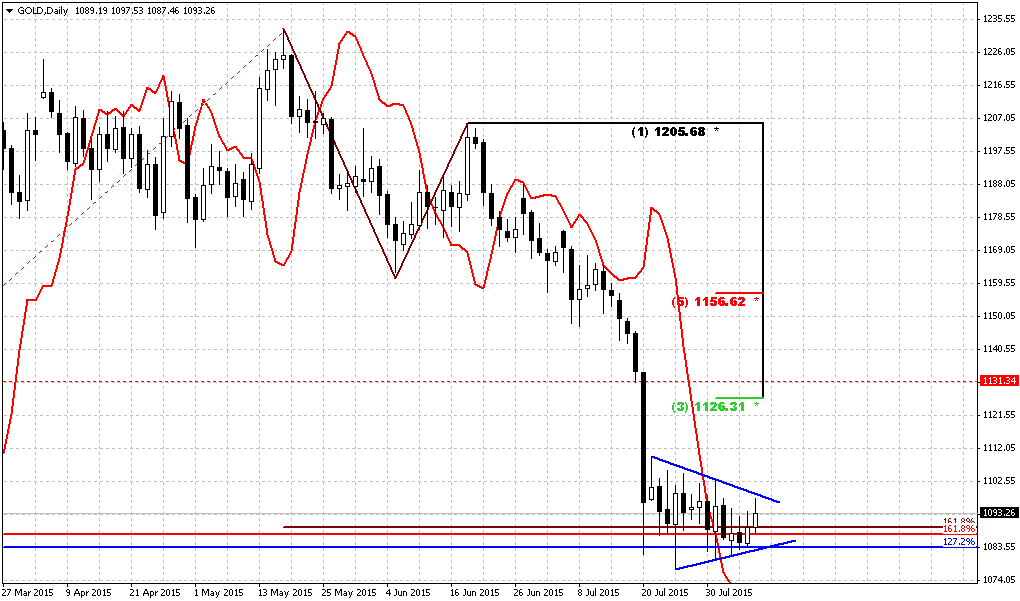
Daily
Daily chart again provides major information for short-term trading. 1080 level, as we’ve mentioned many times, was oversold, is butterfly and inner AB-CD 1.618 targets. Also this is YPS1. So, as a result we have impressive gathering of supports of different kind. We expect that gold could re-test previously broken important 1130 lows. As a result we could get some DiNapoli directional pattern and shape of DRPO “Buy” is becoming brighter as time is passing by. Right now we have first close above 3x3 DMA, close below. On Friday we haven’t got second close above 3x3 and in general ECI report has brought adjustments to normal market behavior that we’ve expected. Anyway, may be we will get second close above 3x3 next week.
Second close still could happen differently. Thus, on Friday we’ve mentioned bearish grabber and it still could work, if market will erase Friday’s rally. But actually we’re interesting in DRPO. If market will clear out lows first and show second close above 3x3 DMA second – this will be OK. Or if grabber will fail and market directly will move higher and give us second close above 3x3 DMA – that also will be OK. In fact gold has no important reasons to show W&R, since major 1.618 AB=CD target already has been hit.
So, short-term conclusion – it is too early to go short, since market at strong support and oversold. If DRPO will be formed and will not fail – gold probably will hit predefined 1126-1130 level. So currently we do not see any problems with this scenario.
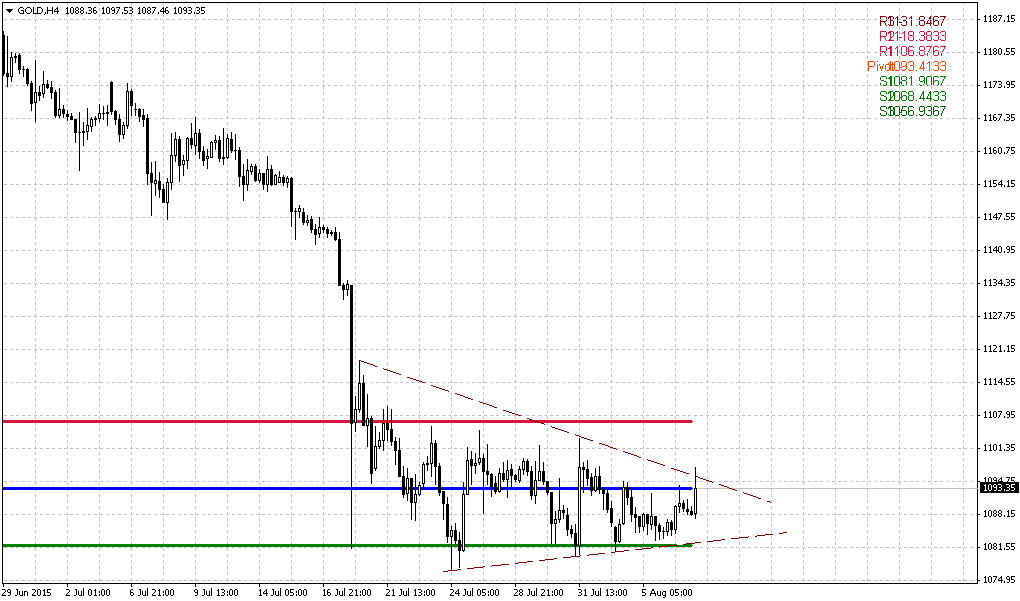
4-hour
This chart does not bring anything special. Recent rally was impressive but we should not overestimate its importance. Take a look that the same scale upside action last week has finished fast and hasn’t got any upside continuation. Chances on appearing of butterfly are still exist here, but it just has changed the shape a bit. Still, if DRPO will be formed, we can’t exclude direct upside continuation. Recent action has some signs of Triple bottom pattern, accompanied by MACD bullish divergence.
So, we will watch for 1100 top (in red circle). If market will move above it – butterfly will be vanished and DRPO probably will be confirmed. This will give us more confidence with possible upside scenario to 1130 area.
Conclusion:
Long-term picture remains bearish and we do not see any serious headwinds for further downward continuation. 1050 is probably nearest perspective that we could imagine, because gold really could drop even lower.
On short-term charts market stands at strong support that could launch short-term technical bounce to 1130 area. Daily traders should watch daily DRPO “Buy” pattern.
The technical portion of Sive's analysis owes a great deal to Joe DiNapoli's methods, and uses a number of Joe's proprietary indicators. Please note that Sive's analysis is his own view of the market and is not endorsed by Joe DiNapoli or any related companies.