Sive Morten
Special Consultant to the FPA
- Messages
- 18,699
Fundamentals
Gold fell on Friday, pressured by a lack of physical buyers and gains on Wall Street, but a U.S. air strike in Iraq and tensions in Middle East supported prices, which stayed above $1,300 an ounce. Gold was up around 1 percent for the week, its first weekly increase in four weeks. In early trade, gold rallied to a three-week high on news U.S. aircraft bombed Islamic fighters marching on Iraq's Kurdish capital of Arbil. safe-haven buying dried up after Russia's Defense Ministry said it had finished military exercises near its border with Ukraine. That news sent the S&P 500 equities index about 1 percent higher.
Earlier this year, gold rallied to just below $1,400 an ounce as tensions mounted between Russia and the West over Ukraine. Gold had unwound most of those gains in two weeks.
"It's difficult to get overly excited given gold's multiple failures to consistently rally on geo-political events, especially when the volumes behind this move have been rather light," said Edel Tully, precious metals strategist at UBS.
Bullion was pressured by data showing a strong second-quarter rebound in productivity at U.S. nonfarm businesses, reducing wage pressures and allowing the Federal Reserve to keep interest rates low.
Physical demand has not been strong enough to support prices after gold's 3 percent jump in the last three sessions. Gold premiums in top buyer China have been stuck at $2-$3 an ounce and demand is much weaker than last year, dealers said.
Natixis analyst Bernard Dahdah said gold prices would be much lower without geopolitical factors because Asian physical buying and U.S. investment demand were both lagging.
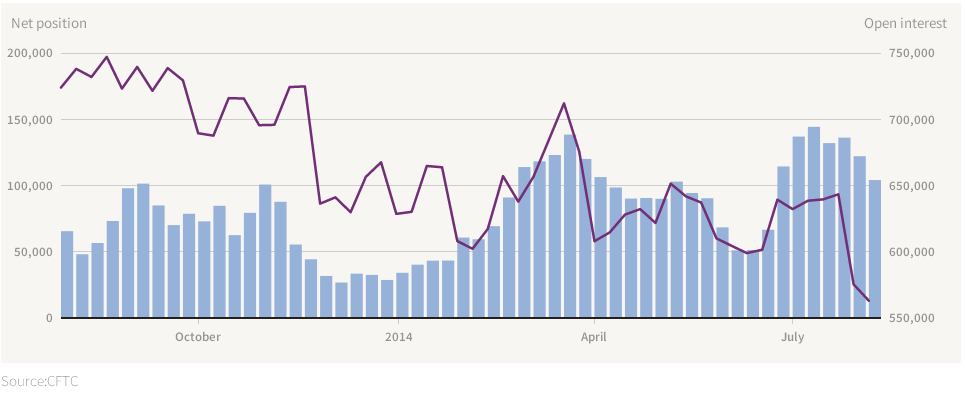 CFTC data currently very important and gives us necessary information. Thus on previous week Open Interest has dropped again significantly. Net long position also has decreased. It could mean that investors close longs more than short positions.
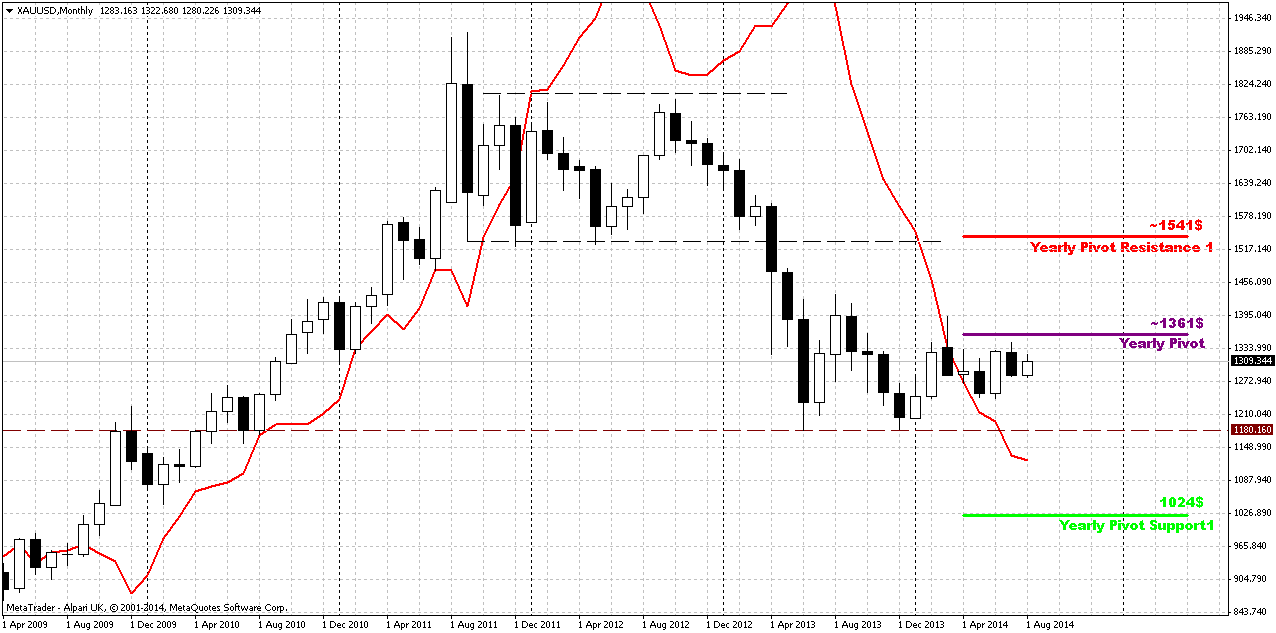
Monthly
Market has moved slightly higher on previous week, still price should pass solid distance to change situation drastically. it could change only if market will move above 1400 area. Reson for rally was suspicious – Russia has started military exercises near Ukraine’s border and Obama gave an order to start Air strikes in north Iraq. As we said in our daily updates – it looks like gold has tired to wait and catches any more or less valuable news to show action.
Since currently August mostly is an inside month for July our former analysis is still working. Althgough investors have not got hawkish hints from Fed and recent NFP data was slightly lower than analysts poll, major factors are still valid - good economy data, that right now is confirmed by US companies earning reports, week physical demand – all these moments prevent gold appreciation. The only factor that could support gold somehow is gepolitical tensions. Previously we have turmoil in Iraq and Ukraine, now Israel and Palestine added.
Grabber pattern is important, but June, and especially July has blocked gradual downward action and white candles break the bearish harmony of recent action. Next upside important level is 1360 – Yearly pivot point. If market will move above it – this could be an indication that gold will continue move higher and this really could become a breaking moment on gold market. Otherwise, grabber will be valid and potentially could lead price back at least to 1180 lows again.
That’s being said, situation on the monthly chart does not suggest yet taking long-term positions on gold. Still, fundamental picture is moderately bearish in long-term. Possible sanctions from EU and US could hurt their own economies (especially EU). Many analysts already have started to talk about it. It means that economies will start to loose upside momentum and inflation will remain anemic. In such situations investors mostly invest in interest-bear assets, such as bonds. Inflation also will be depressed and this is negative sign for gold. At the same time we do not want to say that situation is cloudless for bears, absolutely not. Especially due to the pattern that we’ve got on weekly chart…
Weekly
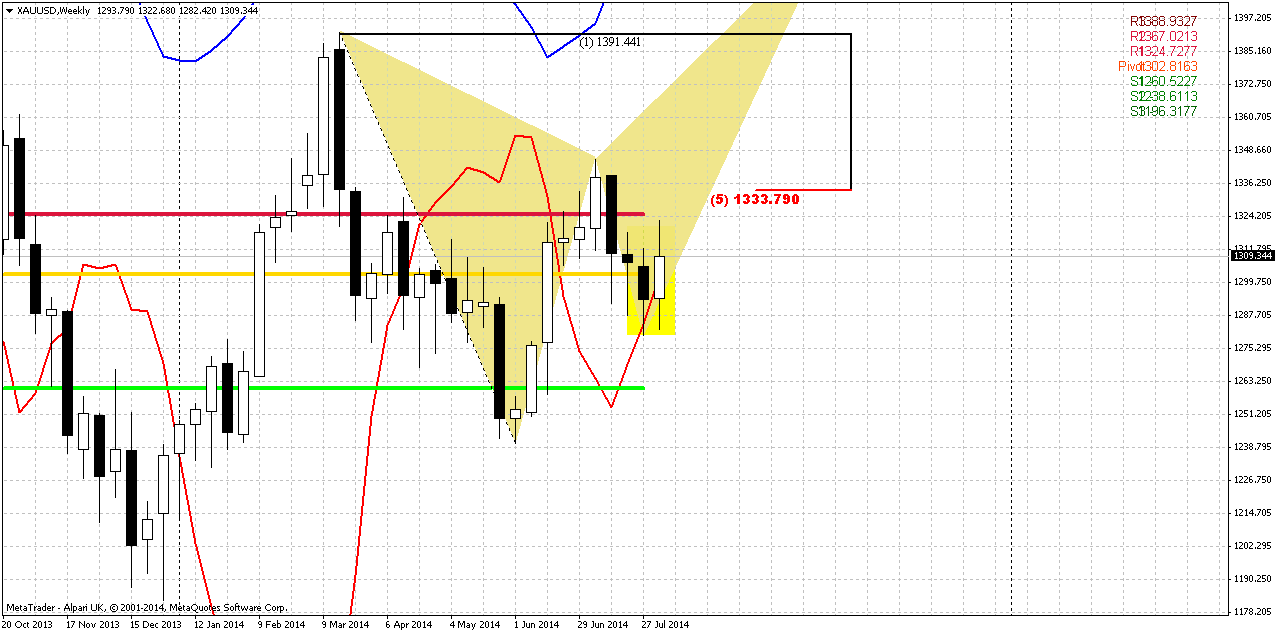
Weekly chart is a goldmine of potential patterns. As we just have finished discussion of first bullish grabber on previous week – now we’ve got another one, and its minimum target stands above 1350 area, very close to YPP ~ 1360. Trend is bullish here. Possible success of grabber has very important meaning for strategic picture. Recall that previously we’ve discussed weekly bearish AB=CD and 1250 lows is 0.618 target. Recent upward move to 1345 area could be treated as retracement and then market re-established downward action. But if right now grabbers will work – market will have to return right back up again and this contradicts to normal bearish development. This could really shift medium term sentiment to bullish. To keep bearish setup – price should erase grabbers and move below its lows.
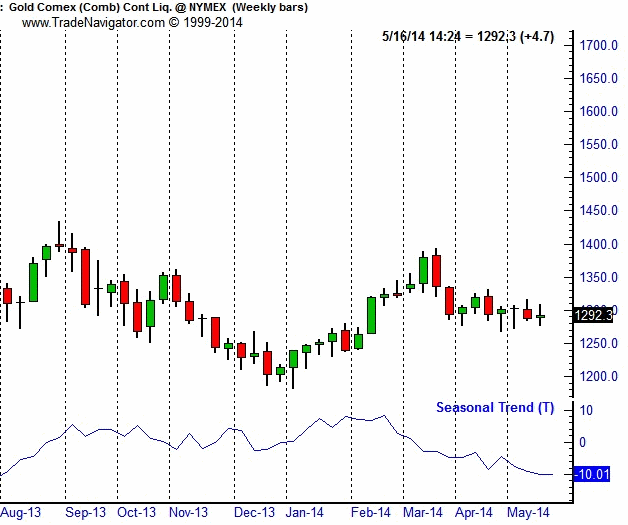
Second bullish moment here – gold has tested and moved above MPP. So, conclusion here is until grabbers’ lows hold – it is unsafe to take bearish position. Besides, seasonal trend will shift bullish at the end of August and lasts till the late February:
Thus if you’re bearish - it is better to wait when market will done with grabbers. Others could try to ride on grabbers.
And finally, just to finish with this picture... Since action above 1350 area will mean probably erasion of weekly bearish patterns and context – market could not just stop on minor target. For example, appearing of butterfly here with ~1430$ destination point is not absolutely impossible thing.
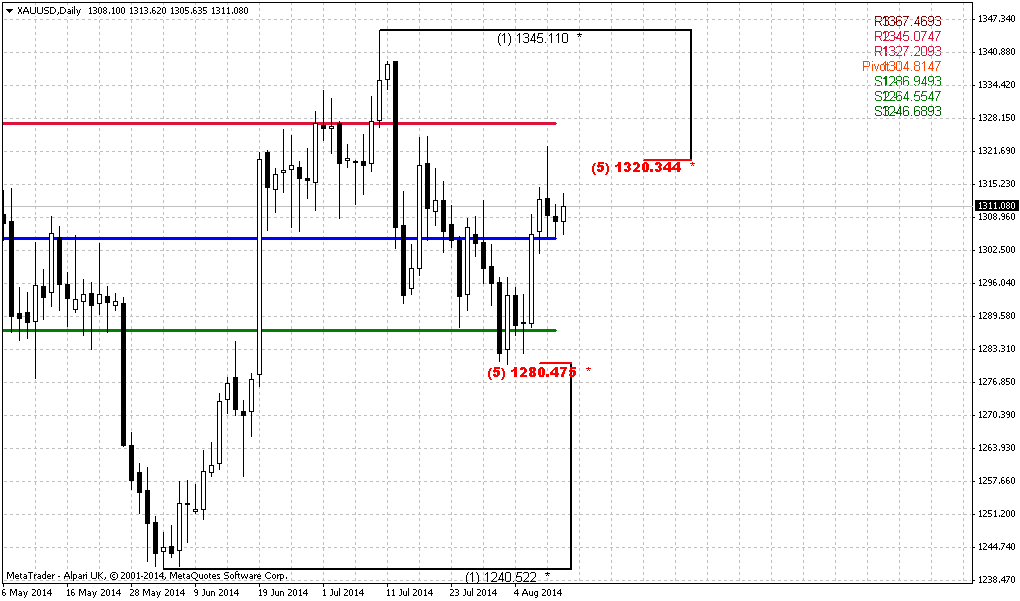
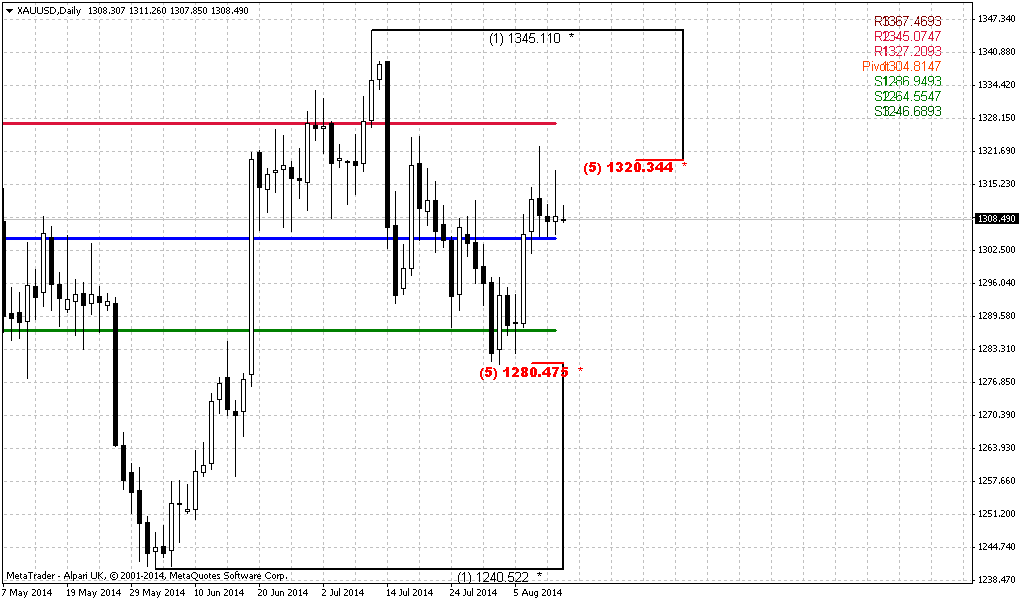
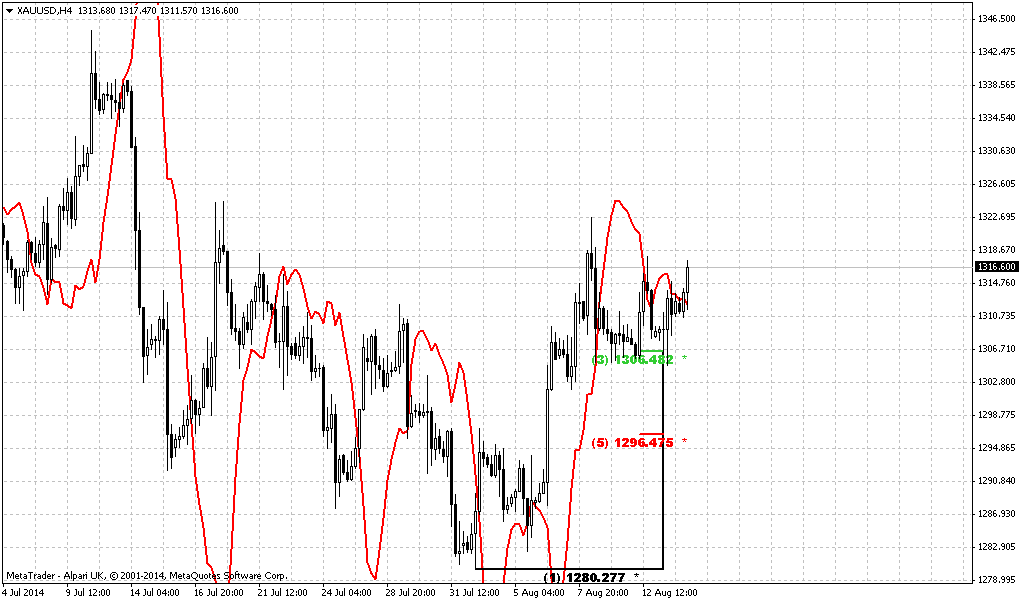
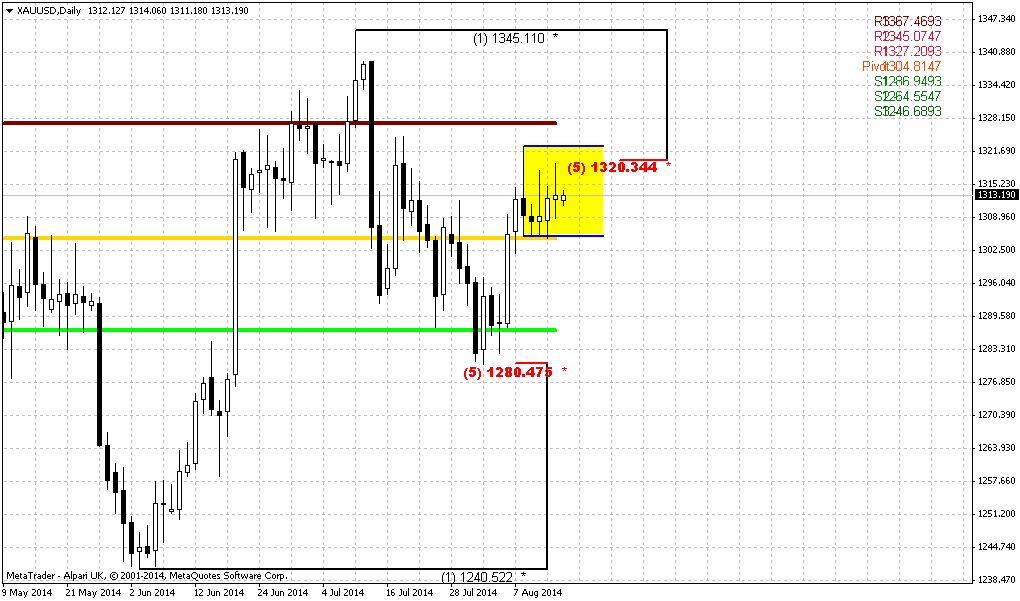
Daily
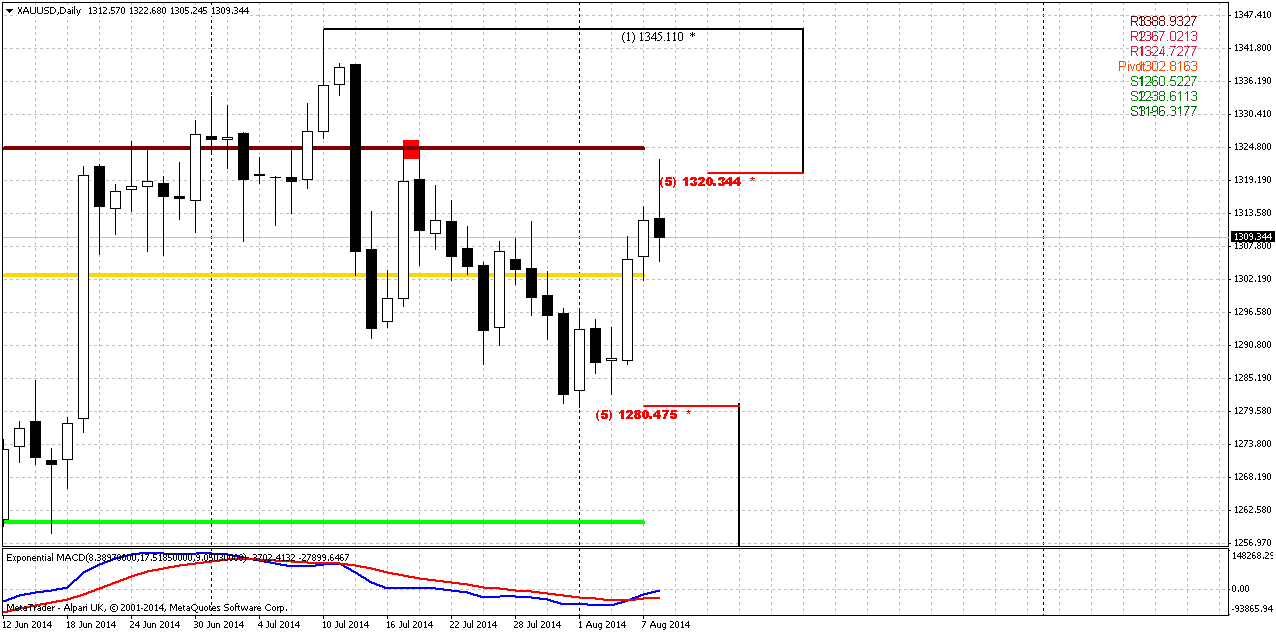
So, guys, I would like to felicitate us, because situation on gold market stands clear right now. I do not want to say that it will be simple to trade it, but, at least we have clarity in short-term perspective. Thus, since first - we’ve estimated that’s a bit early, or, at least, unsafe to enter short. Hence, we can either enter long or do nothing. If we will enter long – we just need only recent swing up on daily chart, because this is a swing of our weekly grabbers. If market will erase this swing – it will erase grabbers also and our trading context will disappear as well, right? Consequently, we need just watch for most recent lows as invalidation point and try to take long position as close to them as possible.
Previously we’ve mentioned some concerns on existed downward AB-CD patterns that were not completed properly. But right now minor (4-hour) AB-CD has been erased, since price has moved above C point. Daily AB-CD still exists, and this will be our task – it would be nice if price will take out top in red square on chart. In this case all our concerns will be resolved. On daily chart trend is bullish as well. As we’ve said on Friday – since market has reached 5/8 Fib resistance, MPR1 – retracement could start and this has happened.
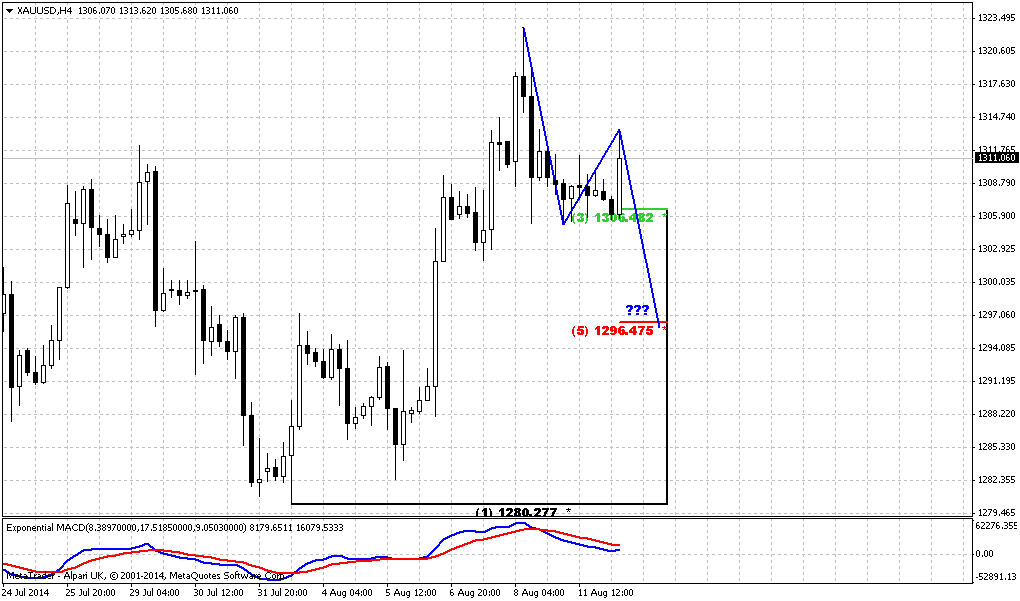
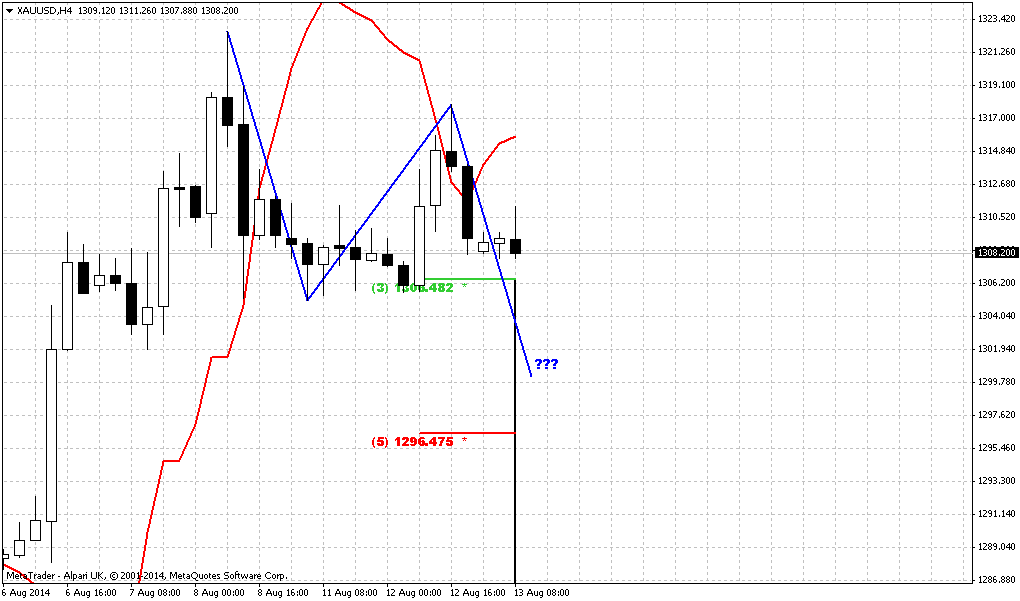
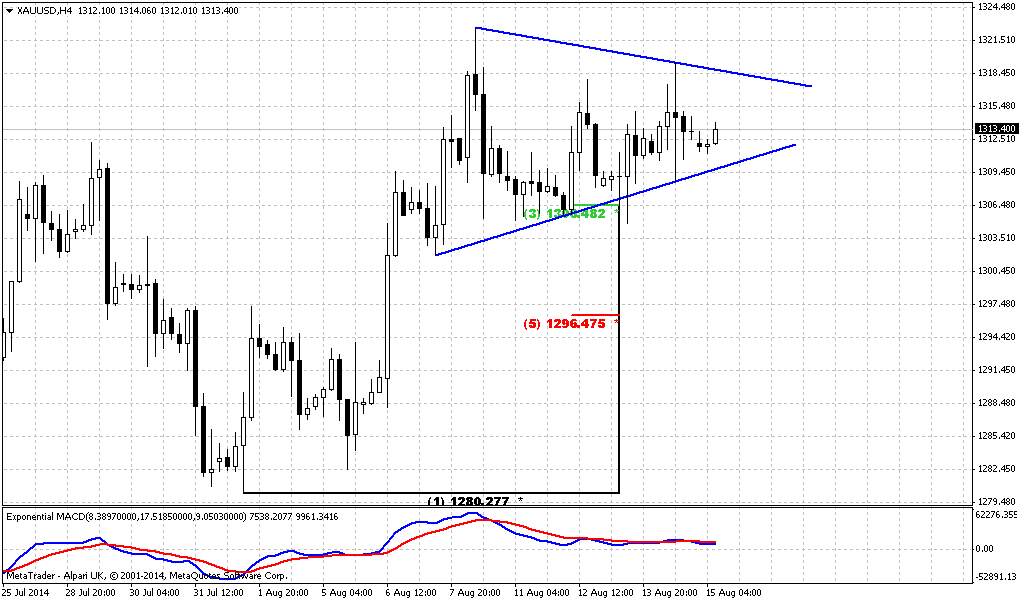
4-hour
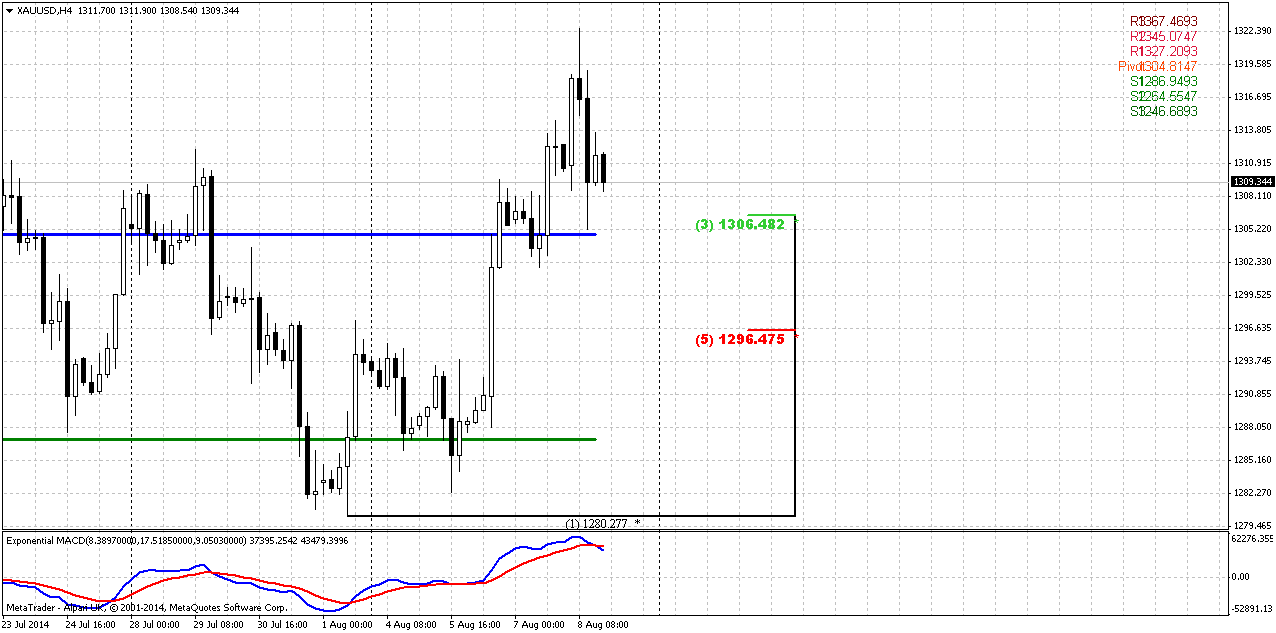
Trend has turned bearish here. Market stands with retracement down. Our first point to watch for is 1305 area. It should be re-tested and this almost has happened on Friday. This area is broken without any respect daily K-resistance and odds suggest it re-testing from other side. Second area to watch for – 1296 Fib support. We can’t exclude that retracement will be deep and this probably even better from risk/reward point of view.
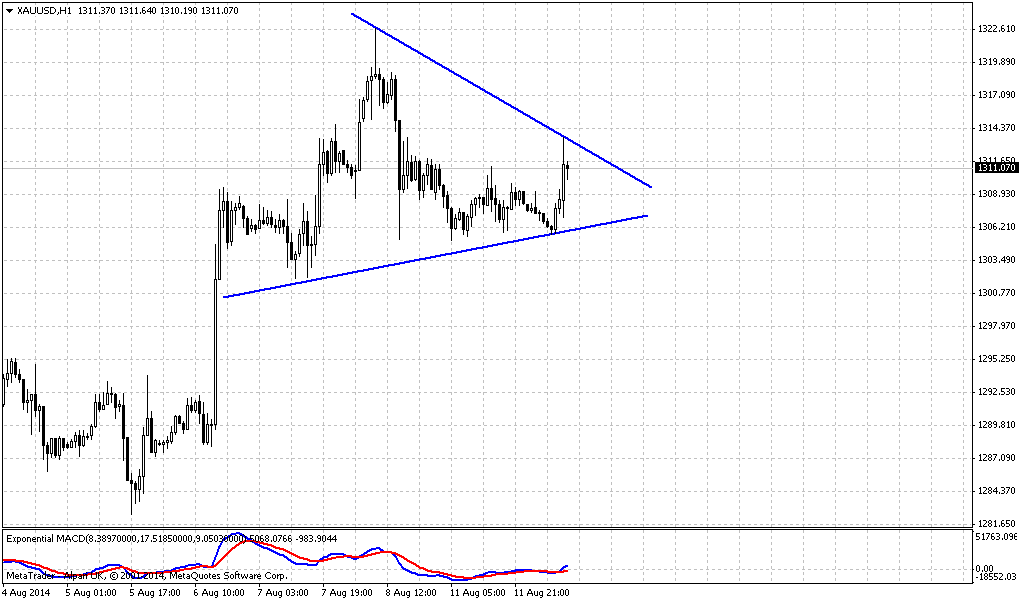
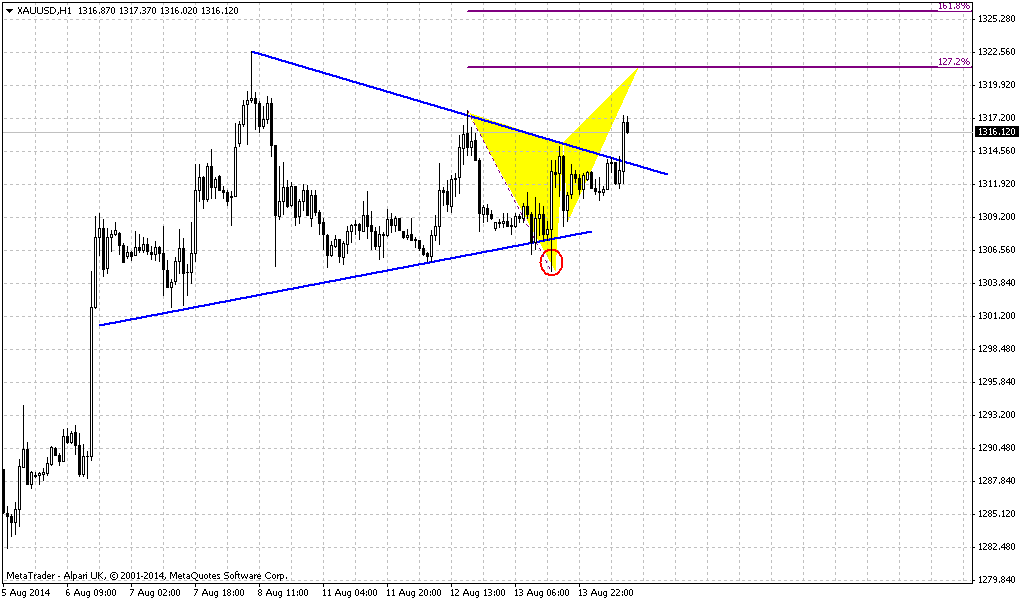
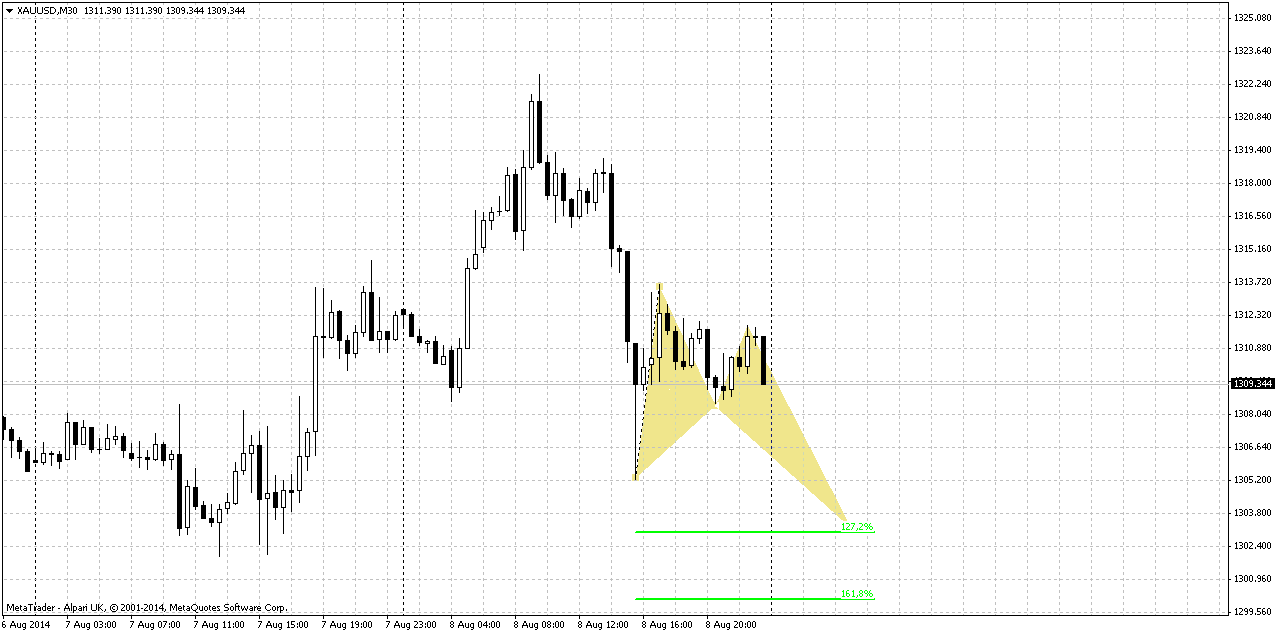
30-min
Currently guys, it is difficult to find any clear patterns on lower chart. You can argue and point that this shape reminds H&S pattern, well, may be. But ratios are not very perfect among head and shoulders. Thus, it would be better probably to focus on this butterfly initally. It has destination points that are very close to our Fib support levels.
Conclusion:
Situation on gold market remains sophisticated. Despite some obviously bearish moments, such as bullish USD sentiment, lack of physical demand, gold does not show real downward acceleration and we could see that gold troubles downward action. Definitely that there are some reasons for that and they probably are not limited by just geopolitical tensions.
In this situation it is better to work on definite patterns, such as grabber that we’ve got on weekly chart.
In short term perspective situation is relatively clear. As we’ve estimated that it is better to not go against weekly grabbers – we can either do nothing or try to trade grabbers to the upside. How to do it we’ve discussed on daily and intraday charts.
The technical portion of Sive's analysis owes a great deal to Joe DiNapoli's methods, and uses a number of Joe's proprietary indicators. Please note that Sive's analysis is his own view of the market and is not endorsed by Joe DiNapoli or any related companies.
Gold fell on Friday, pressured by a lack of physical buyers and gains on Wall Street, but a U.S. air strike in Iraq and tensions in Middle East supported prices, which stayed above $1,300 an ounce. Gold was up around 1 percent for the week, its first weekly increase in four weeks. In early trade, gold rallied to a three-week high on news U.S. aircraft bombed Islamic fighters marching on Iraq's Kurdish capital of Arbil. safe-haven buying dried up after Russia's Defense Ministry said it had finished military exercises near its border with Ukraine. That news sent the S&P 500 equities index about 1 percent higher.
Earlier this year, gold rallied to just below $1,400 an ounce as tensions mounted between Russia and the West over Ukraine. Gold had unwound most of those gains in two weeks.
"It's difficult to get overly excited given gold's multiple failures to consistently rally on geo-political events, especially when the volumes behind this move have been rather light," said Edel Tully, precious metals strategist at UBS.
Bullion was pressured by data showing a strong second-quarter rebound in productivity at U.S. nonfarm businesses, reducing wage pressures and allowing the Federal Reserve to keep interest rates low.
Physical demand has not been strong enough to support prices after gold's 3 percent jump in the last three sessions. Gold premiums in top buyer China have been stuck at $2-$3 an ounce and demand is much weaker than last year, dealers said.
Natixis analyst Bernard Dahdah said gold prices would be much lower without geopolitical factors because Asian physical buying and U.S. investment demand were both lagging.
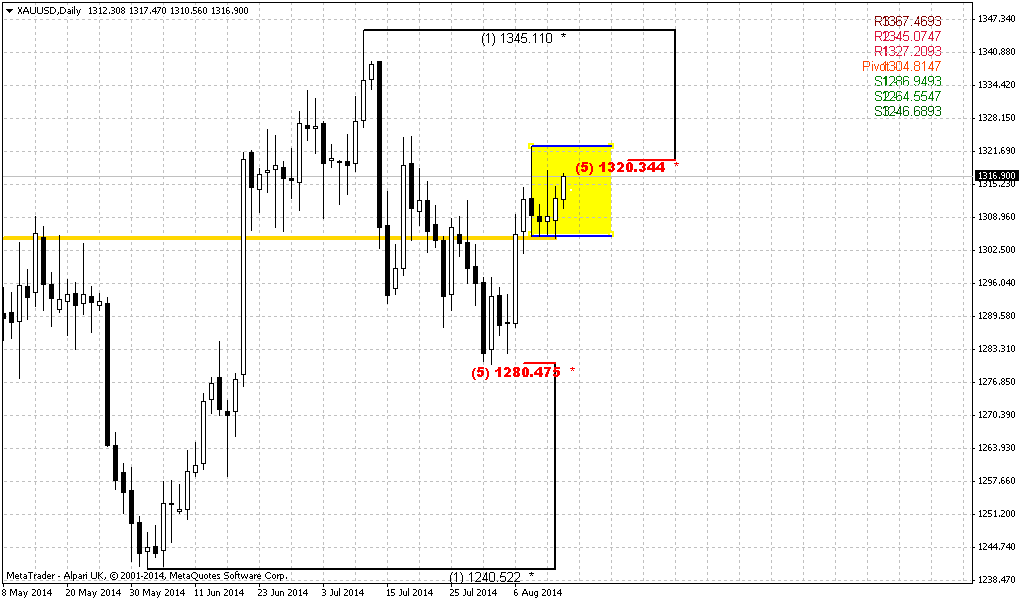
Monthly
Market has moved slightly higher on previous week, still price should pass solid distance to change situation drastically. it could change only if market will move above 1400 area. Reson for rally was suspicious – Russia has started military exercises near Ukraine’s border and Obama gave an order to start Air strikes in north Iraq. As we said in our daily updates – it looks like gold has tired to wait and catches any more or less valuable news to show action.
Since currently August mostly is an inside month for July our former analysis is still working. Althgough investors have not got hawkish hints from Fed and recent NFP data was slightly lower than analysts poll, major factors are still valid - good economy data, that right now is confirmed by US companies earning reports, week physical demand – all these moments prevent gold appreciation. The only factor that could support gold somehow is gepolitical tensions. Previously we have turmoil in Iraq and Ukraine, now Israel and Palestine added.
Grabber pattern is important, but June, and especially July has blocked gradual downward action and white candles break the bearish harmony of recent action. Next upside important level is 1360 – Yearly pivot point. If market will move above it – this could be an indication that gold will continue move higher and this really could become a breaking moment on gold market. Otherwise, grabber will be valid and potentially could lead price back at least to 1180 lows again.
That’s being said, situation on the monthly chart does not suggest yet taking long-term positions on gold. Still, fundamental picture is moderately bearish in long-term. Possible sanctions from EU and US could hurt their own economies (especially EU). Many analysts already have started to talk about it. It means that economies will start to loose upside momentum and inflation will remain anemic. In such situations investors mostly invest in interest-bear assets, such as bonds. Inflation also will be depressed and this is negative sign for gold. At the same time we do not want to say that situation is cloudless for bears, absolutely not. Especially due to the pattern that we’ve got on weekly chart…
Weekly
Weekly chart is a goldmine of potential patterns. As we just have finished discussion of first bullish grabber on previous week – now we’ve got another one, and its minimum target stands above 1350 area, very close to YPP ~ 1360. Trend is bullish here. Possible success of grabber has very important meaning for strategic picture. Recall that previously we’ve discussed weekly bearish AB=CD and 1250 lows is 0.618 target. Recent upward move to 1345 area could be treated as retracement and then market re-established downward action. But if right now grabbers will work – market will have to return right back up again and this contradicts to normal bearish development. This could really shift medium term sentiment to bullish. To keep bearish setup – price should erase grabbers and move below its lows.
Second bullish moment here – gold has tested and moved above MPP. So, conclusion here is until grabbers’ lows hold – it is unsafe to take bearish position. Besides, seasonal trend will shift bullish at the end of August and lasts till the late February:
Thus if you’re bearish - it is better to wait when market will done with grabbers. Others could try to ride on grabbers.
And finally, just to finish with this picture... Since action above 1350 area will mean probably erasion of weekly bearish patterns and context – market could not just stop on minor target. For example, appearing of butterfly here with ~1430$ destination point is not absolutely impossible thing.
Daily
So, guys, I would like to felicitate us, because situation on gold market stands clear right now. I do not want to say that it will be simple to trade it, but, at least we have clarity in short-term perspective. Thus, since first - we’ve estimated that’s a bit early, or, at least, unsafe to enter short. Hence, we can either enter long or do nothing. If we will enter long – we just need only recent swing up on daily chart, because this is a swing of our weekly grabbers. If market will erase this swing – it will erase grabbers also and our trading context will disappear as well, right? Consequently, we need just watch for most recent lows as invalidation point and try to take long position as close to them as possible.
Previously we’ve mentioned some concerns on existed downward AB-CD patterns that were not completed properly. But right now minor (4-hour) AB-CD has been erased, since price has moved above C point. Daily AB-CD still exists, and this will be our task – it would be nice if price will take out top in red square on chart. In this case all our concerns will be resolved. On daily chart trend is bullish as well. As we’ve said on Friday – since market has reached 5/8 Fib resistance, MPR1 – retracement could start and this has happened.
4-hour
Trend has turned bearish here. Market stands with retracement down. Our first point to watch for is 1305 area. It should be re-tested and this almost has happened on Friday. This area is broken without any respect daily K-resistance and odds suggest it re-testing from other side. Second area to watch for – 1296 Fib support. We can’t exclude that retracement will be deep and this probably even better from risk/reward point of view.
30-min
Currently guys, it is difficult to find any clear patterns on lower chart. You can argue and point that this shape reminds H&S pattern, well, may be. But ratios are not very perfect among head and shoulders. Thus, it would be better probably to focus on this butterfly initally. It has destination points that are very close to our Fib support levels.
Conclusion:
Situation on gold market remains sophisticated. Despite some obviously bearish moments, such as bullish USD sentiment, lack of physical demand, gold does not show real downward acceleration and we could see that gold troubles downward action. Definitely that there are some reasons for that and they probably are not limited by just geopolitical tensions.
In this situation it is better to work on definite patterns, such as grabber that we’ve got on weekly chart.
In short term perspective situation is relatively clear. As we’ve estimated that it is better to not go against weekly grabbers – we can either do nothing or try to trade grabbers to the upside. How to do it we’ve discussed on daily and intraday charts.
The technical portion of Sive's analysis owes a great deal to Joe DiNapoli's methods, and uses a number of Joe's proprietary indicators. Please note that Sive's analysis is his own view of the market and is not endorsed by Joe DiNapoli or any related companies.