Sive Morten
Special Consultant to the FPA
- Messages
- 18,699
Fundamentals
Weekly Gold Tading Report prepared by Sive Morten exclusively for ForexPeaceArmy.com
Reuters reports, Gold edged lower on Friday as some buyers cashed in recent gains, but the metal had its biggest weekly rise in two months as the dollar retreated and sliding oil prices hurt risk appetite.
Gold was up 2.5 percent this week after Tuesday's big rally. Falling stock markets have prompted some investors to buy the metal as an alternative asset, while a drop in the greenback made dollar-priced bullion cheaper for holders of other currencies.
"When the equity markets dropped quite sharply, precious metals soared, so there is definitely still the link between equities and gold in particular (due to) risk appetite among market players," Commerzbank analyst Daniel Briesemann said.
"Some of the equity markets had a decent run this year. We don't expect this to be continued to the same extent next year, so this might give some tailwind to gold prices."
The spot market briefly fell as much as 1 percent to $1,215.60 after a survey showed U.S. consumer sentiment rose in December to a new eight-year high.
"What we're looking at here is better retail sales," said Eli Tesfaye, senior market strategist for RJO Futures in Chicago.
"These better numbers basically are going to bolster the case for the Federal Reserve to be more hawkish going forward. That's never good news for gold."
European shares posted their biggest weekly loss since mid-2011, while U.S. stocks also fell, putting the benchmark S&P 500 on track for its first weekly decline in eight.
The improved sentiment toward gold showed in the holdings of the world's top bullion-backed exchange-traded fund, SPDR Gold Trust , which rose 0.13 percent to 725.75 tonnes on Thursday, up nearly 5 tonnes this week.
That marks the second straight week of inflows and the biggest weekly increase in its holdings since early July.
CFTC data gives us more confirmation of sentiment shifting on previous week. Thus, two week ago we’ve seen mass short covering, while on last week CFTC shows increasing in speculative long positions and shy growth of open interest. SPDR fund also reports on 5 tonnes of inflow. This is not tremendous inflow, but this is a bit more than just weekly fluctuations:
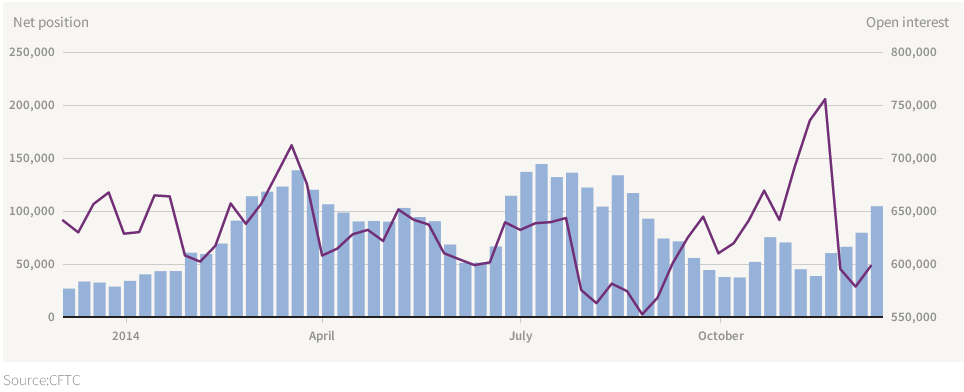
Here is detailed breakdown of speculative positions:
Open interest:
 Shorts:
 Longs:

Technicals
Monthly
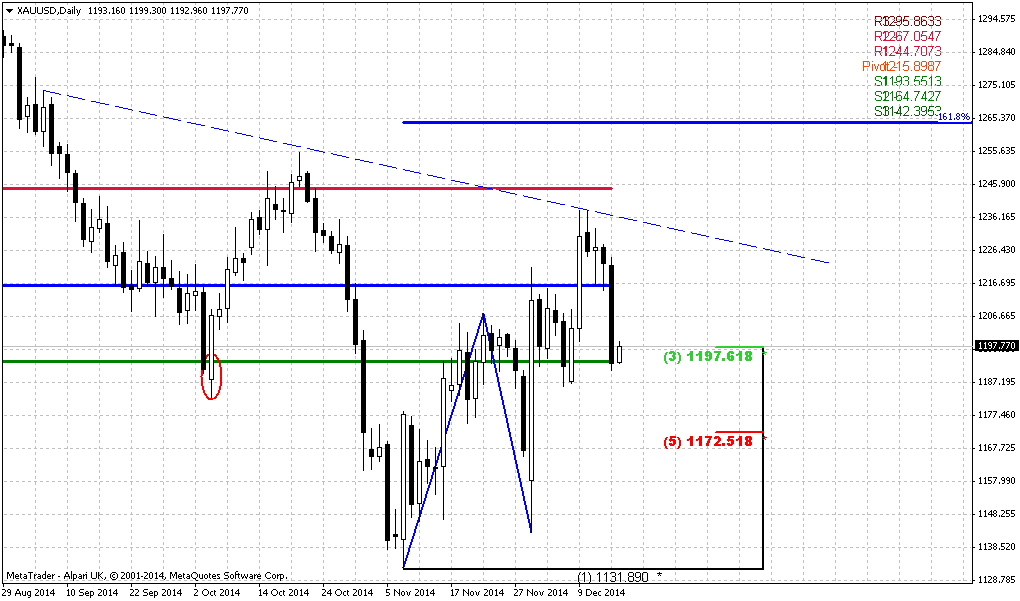
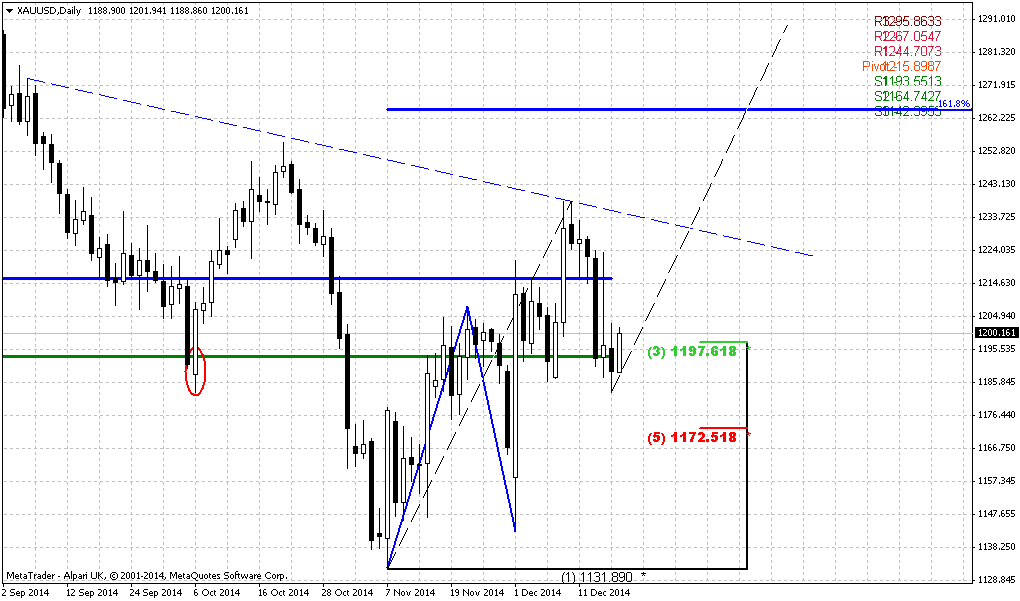
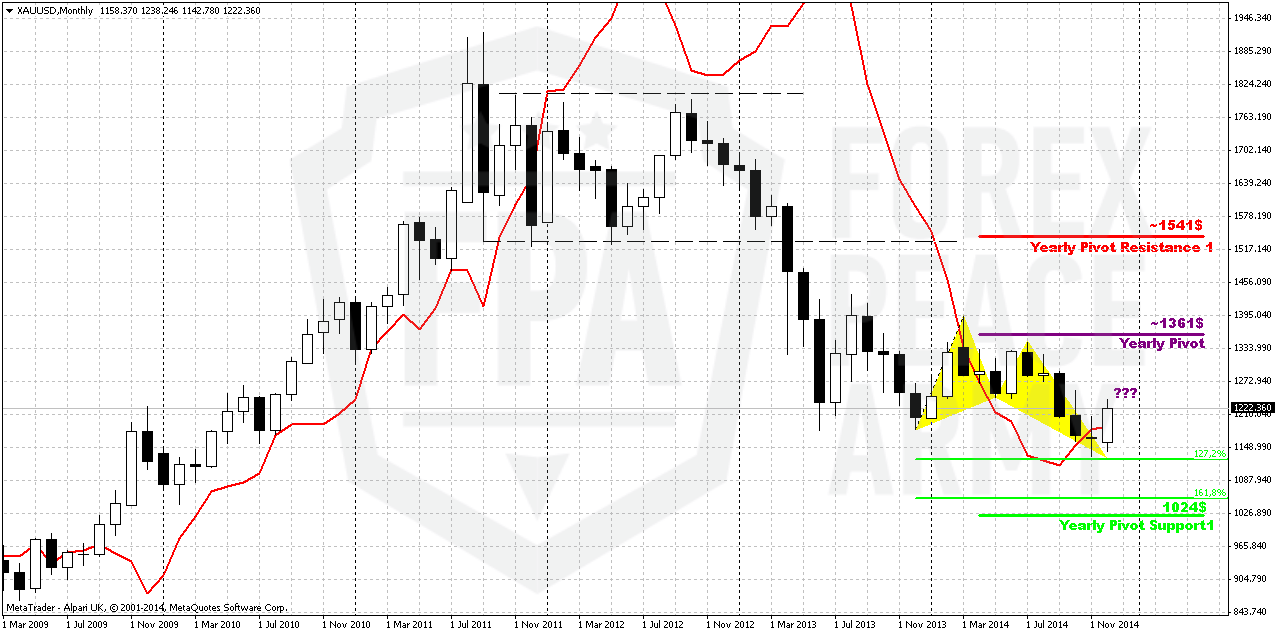
As we’ve said two of our patterns have been completed - bearish grabber @ 1400 and recent dynamic pressure that have led market to 1180 lows and clear them out. Still we have another pattern in progress that is Volatility breakout (VOB). It suggests at least 0.618 AB-CD down. And this target is 1050$.
On previous week we’ve said monthly chart has lost its piquancy. Bullish grabber has not been formed. In December we could get either just trend shifting back to bullish, or bearish grabber that will suggest further downward action. Massive closing of short positions could mean that December might become quiet month. Investors have contracted their positions significantly, pointing that they do not believe in soon downward breakout but also do not fascinating with upside perspectives. Most probable explanation is reducing positions before year end, bonuses calculation and long holidays. This also makes us think that hardly Fed will make any drastical comments on December 17th. They probably will not shake market before holidays and postpone new rhetoric to 2015.
The major driving factor for Gold is inflation and particularly here US economy has problem. Although recent report has shown shy increase in wages, but inflation still stands flat. Accompanied by positive NFP numbers increasing chances on sooner rate hiking will be negative combination for gold. That’s why currently we do not see reasons yet to cancel our 1050$ target.
At the same time guys we see some structural shifts in market sentiment and just can’t ignore it. Hardly could we call mass short covering, increasing longs and SDPR storage just occasional. That’s why although we probably keep our long-term target at 1050$ for awhile, but in short-term perspective we do not exclude deeper retracement to 1265$ area.
Weekly
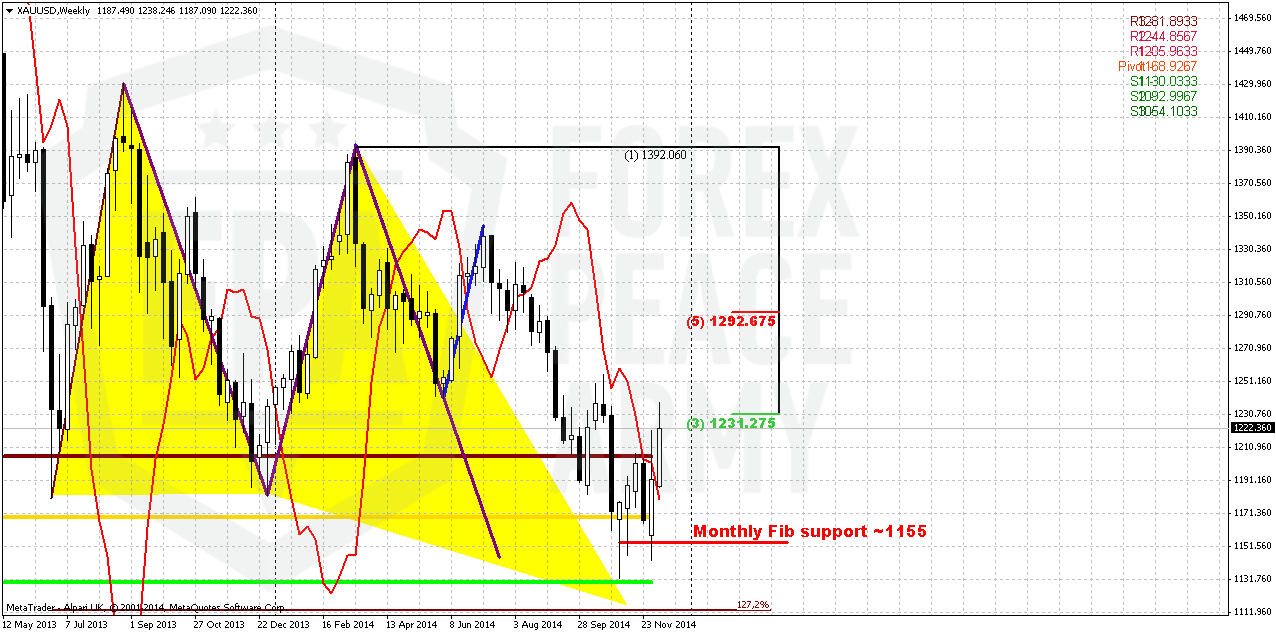
If you remember the major question of our discussion on previous week stand around “1210” level. We said if market will pass through it – it could be reason for deeper upside retracement. After CFTC and SPDR data we have more bullish signs from technical picture. Take a look that market has erased both bearish grabbers on weekly chart by closing above their tops. Also gold significantly overcomes MPR1 that could be sign of bullish power as well. At the same time, as you can see downward tendency is still valid as market continues to form lower lows and lower highs. That’s why theoretically our 1050 target still could be valid. To speak on changing of downward tendency we need at least to get reversal swing that will form higher top. But we do not have it yet. Right now upside action is held by Fib resistance and daily overbought.
Daily
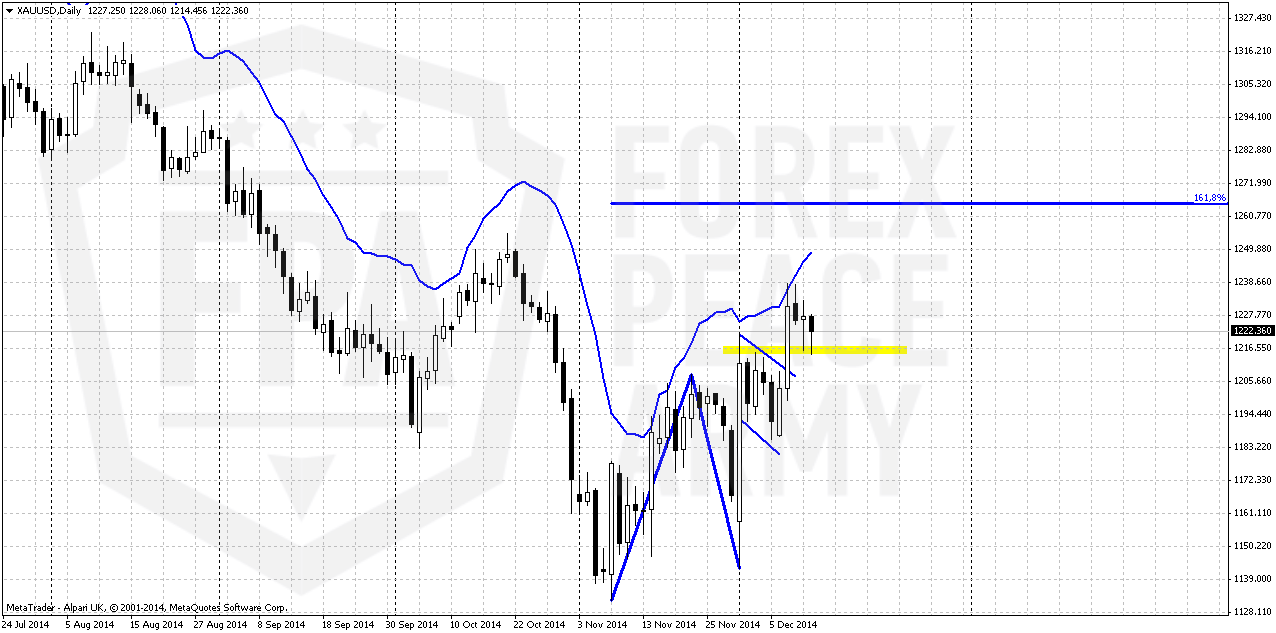
Daily chart looks a bit poor and empty on first glance. But it contains all our reasons, why we think that gold market looks bullish in short-term. First of all, recall our first discussion of upside rally, it was not supported by real purchases on spot market. That’s why we’ve expected that gold market will drop as it was previously, especially as market has completed upside harmonic swing. And this indeed has happened at NFP release. But after that normal behavior of bearish market has ended. Due to outstanding short covering market has erased NFP plunge and completed AB-CD pattern. Also gold has completed intraday 1.618 AB-CD target and normal market mechanics suggests downward continuation. But instead of this gold has turned to coiling right below major resistance level and formed bullish flag there. Two days before breakout we’ve said that it smells like breakout is possible and this has happened.
Take a look that upside action is really fast. Now add here changing in CFTC, SPDR data, moving above MPR1. And finally, take a look at action on previous week – after solid breakout market has not returned right back down, so it was not W&R. Tight standing above broken tops keeps door open for upside action. And it seems that market has not moved higher previously due overbought. What I’m trying to say that recent market behavior looks mostly bullish, at least in short-term and when action up develops as fast as we have now – in most cases it leads to upside continuation. That’s why in short-term perspective we expect possible reaching of 1.618 daily AB=CD at 1260$ area.
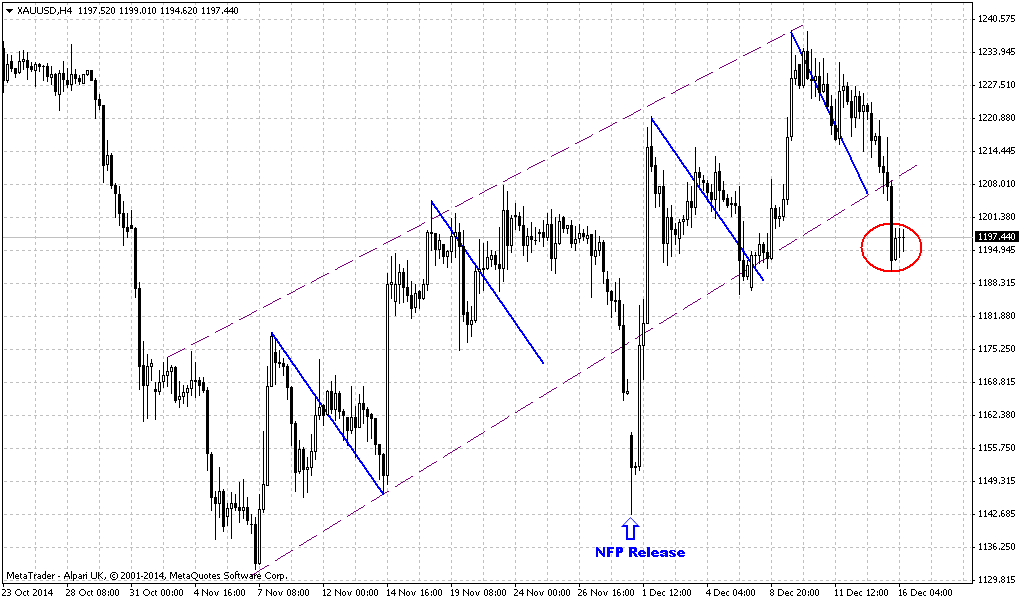
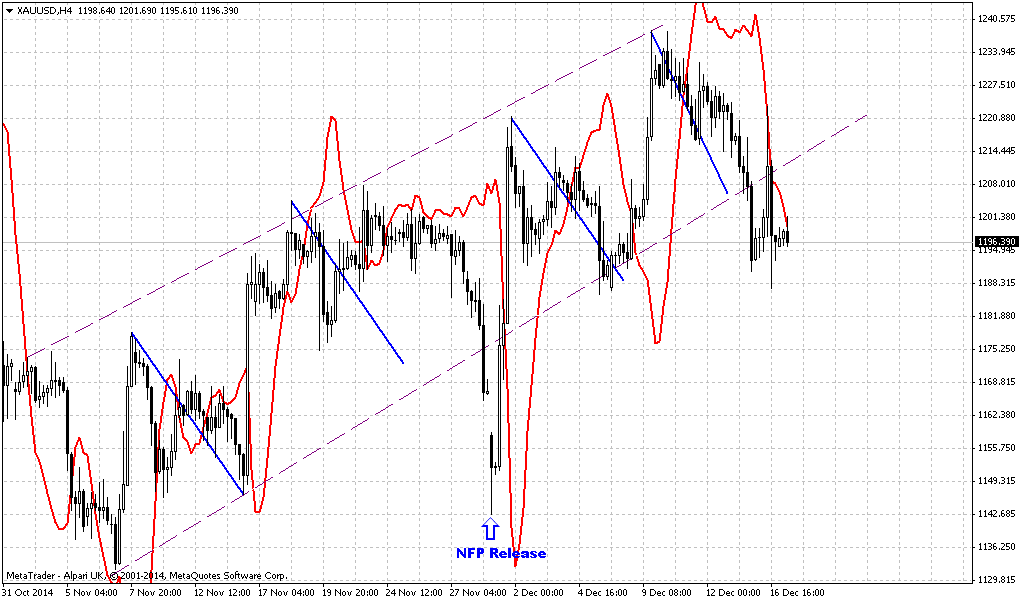
4-hour
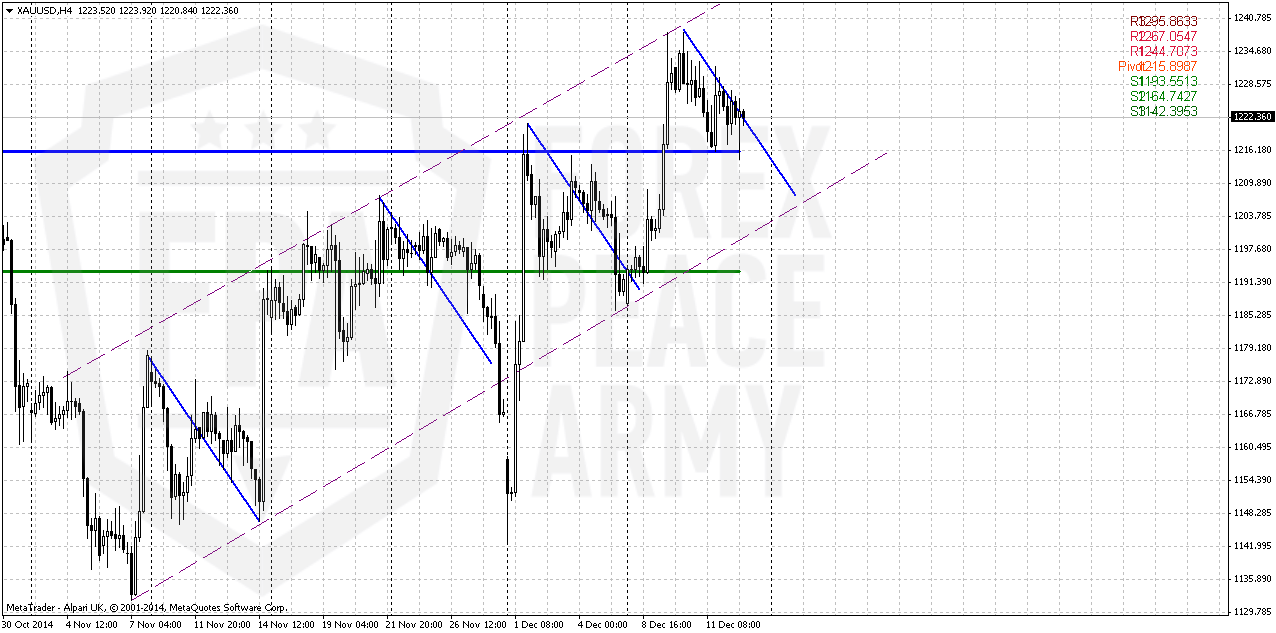
On this time frame we do not have many changes. Gold stands in upside channel and shows harmonic retracements. Theoretically, as daily overbought has been corrected and gold has re-tested broken top, upside action could be re-established at any moment. Market will open around WPP. Previous retracements take the shape of AB-CD, may be we will see it again, but it is difficult to say it definitely. Unfortunately we do not have clear reversal patterns as here as on hourly chart. Harmonic swing points on 1208 area as potential start of upside action again.
Conclusion:
Since market still keeps normal bearish tendency we should not refuse our 1050 target yet. Still we just can’t ignore changes that we see in market sentiment by CFTC and SPDR data. This makes us think that market could move to 1265 area in short-term perspective. But this action will not necessary cancel 1050 target.
In short-term perspective market shows bullish behavior, action on previous week definitely has character of retracement. But we do not have clear patterns that could help us better estimate potential start point of upside continuation. All that we have currently is harmonic swing that points at 1208$ area.
The technical portion of Sive's analysis owes a great deal to Joe DiNapoli's methods, and uses a number of Joe's proprietary indicators. Please note that Sive's analysis is his own view of the market and is not endorsed by Joe DiNapoli or any related companies.
Weekly Gold Tading Report prepared by Sive Morten exclusively for ForexPeaceArmy.com
Reuters reports, Gold edged lower on Friday as some buyers cashed in recent gains, but the metal had its biggest weekly rise in two months as the dollar retreated and sliding oil prices hurt risk appetite.
Gold was up 2.5 percent this week after Tuesday's big rally. Falling stock markets have prompted some investors to buy the metal as an alternative asset, while a drop in the greenback made dollar-priced bullion cheaper for holders of other currencies.
"When the equity markets dropped quite sharply, precious metals soared, so there is definitely still the link between equities and gold in particular (due to) risk appetite among market players," Commerzbank analyst Daniel Briesemann said.
"Some of the equity markets had a decent run this year. We don't expect this to be continued to the same extent next year, so this might give some tailwind to gold prices."
The spot market briefly fell as much as 1 percent to $1,215.60 after a survey showed U.S. consumer sentiment rose in December to a new eight-year high.
"What we're looking at here is better retail sales," said Eli Tesfaye, senior market strategist for RJO Futures in Chicago.
"These better numbers basically are going to bolster the case for the Federal Reserve to be more hawkish going forward. That's never good news for gold."
European shares posted their biggest weekly loss since mid-2011, while U.S. stocks also fell, putting the benchmark S&P 500 on track for its first weekly decline in eight.
The improved sentiment toward gold showed in the holdings of the world's top bullion-backed exchange-traded fund, SPDR Gold Trust , which rose 0.13 percent to 725.75 tonnes on Thursday, up nearly 5 tonnes this week.
That marks the second straight week of inflows and the biggest weekly increase in its holdings since early July.
CFTC data gives us more confirmation of sentiment shifting on previous week. Thus, two week ago we’ve seen mass short covering, while on last week CFTC shows increasing in speculative long positions and shy growth of open interest. SPDR fund also reports on 5 tonnes of inflow. This is not tremendous inflow, but this is a bit more than just weekly fluctuations:
Here is detailed breakdown of speculative positions:
Open interest:
Technicals
Monthly
As we’ve said two of our patterns have been completed - bearish grabber @ 1400 and recent dynamic pressure that have led market to 1180 lows and clear them out. Still we have another pattern in progress that is Volatility breakout (VOB). It suggests at least 0.618 AB-CD down. And this target is 1050$.
On previous week we’ve said monthly chart has lost its piquancy. Bullish grabber has not been formed. In December we could get either just trend shifting back to bullish, or bearish grabber that will suggest further downward action. Massive closing of short positions could mean that December might become quiet month. Investors have contracted their positions significantly, pointing that they do not believe in soon downward breakout but also do not fascinating with upside perspectives. Most probable explanation is reducing positions before year end, bonuses calculation and long holidays. This also makes us think that hardly Fed will make any drastical comments on December 17th. They probably will not shake market before holidays and postpone new rhetoric to 2015.
The major driving factor for Gold is inflation and particularly here US economy has problem. Although recent report has shown shy increase in wages, but inflation still stands flat. Accompanied by positive NFP numbers increasing chances on sooner rate hiking will be negative combination for gold. That’s why currently we do not see reasons yet to cancel our 1050$ target.
At the same time guys we see some structural shifts in market sentiment and just can’t ignore it. Hardly could we call mass short covering, increasing longs and SDPR storage just occasional. That’s why although we probably keep our long-term target at 1050$ for awhile, but in short-term perspective we do not exclude deeper retracement to 1265$ area.
Weekly
If you remember the major question of our discussion on previous week stand around “1210” level. We said if market will pass through it – it could be reason for deeper upside retracement. After CFTC and SPDR data we have more bullish signs from technical picture. Take a look that market has erased both bearish grabbers on weekly chart by closing above their tops. Also gold significantly overcomes MPR1 that could be sign of bullish power as well. At the same time, as you can see downward tendency is still valid as market continues to form lower lows and lower highs. That’s why theoretically our 1050 target still could be valid. To speak on changing of downward tendency we need at least to get reversal swing that will form higher top. But we do not have it yet. Right now upside action is held by Fib resistance and daily overbought.
Daily
Daily chart looks a bit poor and empty on first glance. But it contains all our reasons, why we think that gold market looks bullish in short-term. First of all, recall our first discussion of upside rally, it was not supported by real purchases on spot market. That’s why we’ve expected that gold market will drop as it was previously, especially as market has completed upside harmonic swing. And this indeed has happened at NFP release. But after that normal behavior of bearish market has ended. Due to outstanding short covering market has erased NFP plunge and completed AB-CD pattern. Also gold has completed intraday 1.618 AB-CD target and normal market mechanics suggests downward continuation. But instead of this gold has turned to coiling right below major resistance level and formed bullish flag there. Two days before breakout we’ve said that it smells like breakout is possible and this has happened.
Take a look that upside action is really fast. Now add here changing in CFTC, SPDR data, moving above MPR1. And finally, take a look at action on previous week – after solid breakout market has not returned right back down, so it was not W&R. Tight standing above broken tops keeps door open for upside action. And it seems that market has not moved higher previously due overbought. What I’m trying to say that recent market behavior looks mostly bullish, at least in short-term and when action up develops as fast as we have now – in most cases it leads to upside continuation. That’s why in short-term perspective we expect possible reaching of 1.618 daily AB=CD at 1260$ area.
4-hour
On this time frame we do not have many changes. Gold stands in upside channel and shows harmonic retracements. Theoretically, as daily overbought has been corrected and gold has re-tested broken top, upside action could be re-established at any moment. Market will open around WPP. Previous retracements take the shape of AB-CD, may be we will see it again, but it is difficult to say it definitely. Unfortunately we do not have clear reversal patterns as here as on hourly chart. Harmonic swing points on 1208 area as potential start of upside action again.
Conclusion:
Since market still keeps normal bearish tendency we should not refuse our 1050 target yet. Still we just can’t ignore changes that we see in market sentiment by CFTC and SPDR data. This makes us think that market could move to 1265 area in short-term perspective. But this action will not necessary cancel 1050 target.
In short-term perspective market shows bullish behavior, action on previous week definitely has character of retracement. But we do not have clear patterns that could help us better estimate potential start point of upside continuation. All that we have currently is harmonic swing that points at 1208$ area.
The technical portion of Sive's analysis owes a great deal to Joe DiNapoli's methods, and uses a number of Joe's proprietary indicators. Please note that Sive's analysis is his own view of the market and is not endorsed by Joe DiNapoli or any related companies.