Sive Morten
Special Consultant to the FPA
- Messages
- 18,760
Greetings,
I’m happy to announce new regular research that is sponsored by Pellucid FX and it is dedicated to Gold market.
Since this is the first research, let me make small intro.
First of all, we need to understand that gold is absolutely unique asset. It combines different qualities – commodity, industrial metal, luxury object, safe-haven asset and inflation protection asset – money rival. Although it is possible to deal with gold pure technically, since this is rather liquid market, nevertheless it will not be sufficient. Currencies feel impact from news, speeches statistics, but still they are a bit simpler. It is possible to deal with them pure technically. It is easy to print and destroy it, easy to change a policy how to manage them – that is what countries do. Gold, in turn, is a quite different substance, because its international. There is no such issue as EU Gold or US Gold. Gold is a gold that’s it. It is hard to extract, store and convey it. It has limited ammount in the World and its increasing is very limited. That’s why such issues as demand, supply, seasonal trends, funds holding take very important meaning.
Since we make weekly researches, our major task here is to find out what gold fundamental data are particularly important on weekly basis. We definitely will combine fundamental analysis of Gold market and technical view. Daily videos will be technical only, since data on gold changes not as often.
Today we will start with common issues and thoughts, take a look at perspective and technical picture, but gradually I will start to add more fundamentals in analysis. Otherwise we will not be able to understand what is going on. So, today’s research will be a bit more extended, since I have to describe some initial issues that we will need to use and remember in every research.
Absolutely welcome if you will share your thoughts on forum on gold analysis, share your view, take active part in discussion and provide your observations of this market, data and fundamentals that could be treated as significant and that have solid impact on gold. Otherwise, let’s make community, since we have the same object – trade gold effectively and with profit. We need team work, since Gold stands among most cunning markets.
Fundamentals
Since we’re talking on long-term perspective, let’s add some fundamental issues right from the point. We will monitor them on every week. First of all, I would like to say that Gold is a seasonal market. On the chart lower we see seasonal trend. It shows that seasonally gold is bullish since mid August till February, when bearish seasonal trend starts. So, now we stand right at the eve of it. But honestly speaking – this is not always leads to collapse - market could just turn to some flat action, retracement or consolidation. Other words, it just has less intrinsic bullish power in this time.

Second moment that I would like to show you right in the first research is COT Report on Gold, but in kind of contracted version:
 What conclusions could be made here? First of all take a look at Open Interest (OI) - it is growing. It means that traders initiate new contracts on gold, i.e. open new positions. Also we see that OI is far from its extreme value and has a lot of room to grow more. The growing OI could be early warning about possible acceleration in one or another side, because when market stands in the tight consolidation, but traders add more and more to positions – intrinsic pressure is growing, market feels tight with huge volume inside of range and it turns to kind of churning action. Probably we are not at breakout eve yet but if this tendency will continue, then probability of breakout will increase.
Second moment is speculative positions. Shortly speaking they are some sort of trend indicator. Although we see that they decreased a bit on previous week, but net position is still long. So we have growth volume of total number of position opened and see that speculators stand on long side on Gold just yet.
What else we see here? Another important thing –net position value stands at rather low value around 80K contracts. That was a lowest position value in 2012. The ultimate net position value is 200 K contracts – 2.5 times greater. If currently speculators stand long with 200 K net, I probably would say – “guys, gold is ready to go down, since all stands long, reversal is near”. But here we see that speculators hold long, but net position is far from satiety. In general, from this analysis we could say that despite the fact that gold in recent time shows heavy action – it still stands in the range and inside of this range sentiment is rather bullish then bearish. Well, I think that is enough for discussion starter. On next week we will definitely add more fundamental issues - I just will have to decide which of them are most important on weekly basis. If you have any ideas – feel free to share on forum.
Now let’s shift to technical picture.
Monthly
This time frame extremely useful for gold market, since as you can see it stands in the range within 1.5 years. Why? Well, generally it could be explained by changing environment on financial markets. Globe economy has felt extremely bad, demand for gold was solid from China and India, banks have invested in gold actively as well - so invest in gold was simple. But now situation looks more complicated and blur. We see some improvements here and there, US stock market is growing, but bond yields still hold on all time lows. From time to time we see good statistics data, for example on US house market, but later we again see disappointing numbers. The same is in EU. It is possible that gold has turned to consolidation because it looks like to abandon gold is too early and risky and what the alternative, but conversely – something is changing, and may be it’s too late to invest in gold? So, market in fact, stands on guard and “hold” longs. Because if sell-off has started, we probably now should have gold around 1200$. Such situation and overall sentiment on the market puts impact on trading style, because traders can’t join long-term trends, they have to search for short-term trading against some significant levels and not marry any positions, trades have to be based on definite patterns that could give definite entry level, stop and profit objectives. That is the short characteristic of current gold market.
Still, current technical picture confirms conclusions of COT analysis. Market has non-obvious bullish gravitation. It could be seen from tight consolidation; market has shown very tight retracement after tremendous trend up and still stands tight. This usually happens before upward continuation.
On first chart we see two significant moments. First – take a look at trend by MACD. It is strongly bearish, but what is a price action? Right, it’s flat and does not support bear trend. This could suggest hidden bullish power and calls as “Dynamic pressure”. Second is, market is flirting with yearly pivot point at 1665 area. Yearly pivots are important by two reasons. Gold market has a tendency to create high or low for the year during first quarter. If market will move below it and take out current year lows around 1620 – I do not want to be bullish on Gold. That is the first scenario – keep an eye on yearly pivot and current year low. If market will move below it – our road is to yearly pivot support 1 that is lower border of consolidation as well. Will it mean that bullish sentiment is broken? Not necessarily. We know that when market stands in a long-term bull trend – Pivot Support 1 should hold retracement, if trend is still in play. Besides, move to lower border of consolidation doesn’t mean yet that bearish breakout will follow.

Now let’s speak about bullish perpsectives. I think that here could be Butterfly with 1.27 around 2000 level. Now it looks not as accurate as previously, but initial swing still intact. If we will stick with horizontal consolidation – in the case of upward breakout it will give us the same destinaton. Also you can see here triangle. Anyway, all patterns suggest upward move.

As conclusion from analysis of monthly chart we can say – two crucial levels for us here. They are 1625 current year low. Until it holds – we have a hope to upward continuation. If it will fail – we will turn on way to yearly pivot support 1 and lower border of monthly coil – 1536, that is a second level to watch.
Weekly
From the weekly perspective we have situation of stalemate. From the one point of view, trend is bearish. We have completed downward AB=CD pattern + Agreement right at 5/8 Fib support and shallow bounce up, that looks heavy and not impressive. Price now stands right around MPP=1662 that is also very close to yearly pivot. Until market stands above yearly lows (red circle) it is better to search possibility to enter long, but as closer to 1625 as possible. This level is also MPS1, currently we see weak respect of AB=CD, but this is Gartley “222” Buy as well, so, it might be re-test of this low and upward move. You should know that 0.618 retracements is a favorable level for Gold. It usually shows deep retracements and as a rule they are 0.618. Besides, this level is very common for butterflies.
If market will pass lower, then we should be ready for downward move right to the low of current consolidation. That’s why until this level holds it is better to tune on long positions with reasonable risks.

Daily
Daily picture of gold very sophisticated. Still, beginning should be more or less clear. We have bear trend and two bearish stop grabber side-by-sides right in the direction of previous move. This suggests that first market action should be downside and take out previous lows around 1650. So, if you’re scalper you may search the possibility to enter short on hourly chart. Potential target is downward AB=CD projection and Agreement with 0.768 Fib support 1640-1642 area.
Guys, but what could happen next – is very difficult to anticipate. If market is really bullish – the last chance to prove it is to hold at this 1640 level, create “222” buy and continue move up. Those of you who are bullish – this is the only setup that you can use for long entry. But if market will fail here – we will not have any other supports on all way down, and it could turn to butterfly “Buy” pattern. Further situation will depend on it. If market will form some sort of W&R and return right back above 1625 – hopes on bullish development will hold. If not and there will not be any reversal after butterfly, then it could road to the downside, as we’ve discussed above.
So, our trading plan here is to stick with stop grabber first and later we will see what to do… Don’t miss daily updates on gold.

4-hour
This chart shows why 1640 area is so signficant for bullish survival. In fact, here we have the mirror of daily picture but in smaller scale – bearish stop grabber as starting point of butterfly’s right wing. 1.27 butterfly target coincides with daily 0.768 support. Also butterfly inner AB-CD pattern has a 1.618 extension target in this area. Trend is bearish here.

1-hour
May be you will be laughing, but recent action on hourly chart could be treated as butterfly as well. Even more – it has 1.618 extension at the same 1640 area. Trend has turned bearish here, market is not at oversold, so, probably we could be focused on most resent downside swing to initiate short scalp trade. The inlay of 5-min chart shows K-resistance area around 1669 – recall, gold likes to make 5/8 retracements. So, probably it could be useful for entry, but it depends on your risk management and what particular pattern you will trade. Each of them have different stop level, so you have choice between 6 different patterns – 3 stop grabbers, 3 butterflies. Honestly speaking, it will be safer to place stop above daily stop grabber high, but not everybody could take this risk.

Conclusion:
As we’ve mentioned, gold stands among most cunning markets. Long-term picture suggests that market still stands in long-term bullish trend and has not broken yet, despite on 1.5 year consolidation. If upward move will continue, then market could reach 2000 level within 12-18 months.
If market will move and hold below current year’s low at 1625 – that could trigger retracement to 1536 level – low border of consolidation and yearly PS1. But even this move will not erase bullish trend.
Anyway long term picture does not give us any setups for trading, that’s why we have to look for intraday patterns and stick with it by FIFO way – fast in-fast out. (Who knows accounting will catch this joke). Since we have bearish trend at all time frames and bearish patterns that suggest downward move at least to 1640 level, we could try to join it on some pullback, probably to 1670 level.
Simultaneously we will continue to monitor fundamental picture around significant levels trying to understand the probability of re-establishing of long-term upward trend.
The technical portion of Sive's analysis owes a great deal to Joe DiNapoli's methods, and uses a number of Joe's proprietary indicators. Please note that Sive's analysis is his own view of the market and is not endorsed by Joe DiNapoli or any related companies.
I’m happy to announce new regular research that is sponsored by Pellucid FX and it is dedicated to Gold market.
Since this is the first research, let me make small intro.
First of all, we need to understand that gold is absolutely unique asset. It combines different qualities – commodity, industrial metal, luxury object, safe-haven asset and inflation protection asset – money rival. Although it is possible to deal with gold pure technically, since this is rather liquid market, nevertheless it will not be sufficient. Currencies feel impact from news, speeches statistics, but still they are a bit simpler. It is possible to deal with them pure technically. It is easy to print and destroy it, easy to change a policy how to manage them – that is what countries do. Gold, in turn, is a quite different substance, because its international. There is no such issue as EU Gold or US Gold. Gold is a gold that’s it. It is hard to extract, store and convey it. It has limited ammount in the World and its increasing is very limited. That’s why such issues as demand, supply, seasonal trends, funds holding take very important meaning.
Since we make weekly researches, our major task here is to find out what gold fundamental data are particularly important on weekly basis. We definitely will combine fundamental analysis of Gold market and technical view. Daily videos will be technical only, since data on gold changes not as often.
Today we will start with common issues and thoughts, take a look at perspective and technical picture, but gradually I will start to add more fundamentals in analysis. Otherwise we will not be able to understand what is going on. So, today’s research will be a bit more extended, since I have to describe some initial issues that we will need to use and remember in every research.
Absolutely welcome if you will share your thoughts on forum on gold analysis, share your view, take active part in discussion and provide your observations of this market, data and fundamentals that could be treated as significant and that have solid impact on gold. Otherwise, let’s make community, since we have the same object – trade gold effectively and with profit. We need team work, since Gold stands among most cunning markets.
Fundamentals
Since we’re talking on long-term perspective, let’s add some fundamental issues right from the point. We will monitor them on every week. First of all, I would like to say that Gold is a seasonal market. On the chart lower we see seasonal trend. It shows that seasonally gold is bullish since mid August till February, when bearish seasonal trend starts. So, now we stand right at the eve of it. But honestly speaking – this is not always leads to collapse - market could just turn to some flat action, retracement or consolidation. Other words, it just has less intrinsic bullish power in this time.

Second moment that I would like to show you right in the first research is COT Report on Gold, but in kind of contracted version:

Second moment is speculative positions. Shortly speaking they are some sort of trend indicator. Although we see that they decreased a bit on previous week, but net position is still long. So we have growth volume of total number of position opened and see that speculators stand on long side on Gold just yet.
What else we see here? Another important thing –net position value stands at rather low value around 80K contracts. That was a lowest position value in 2012. The ultimate net position value is 200 K contracts – 2.5 times greater. If currently speculators stand long with 200 K net, I probably would say – “guys, gold is ready to go down, since all stands long, reversal is near”. But here we see that speculators hold long, but net position is far from satiety. In general, from this analysis we could say that despite the fact that gold in recent time shows heavy action – it still stands in the range and inside of this range sentiment is rather bullish then bearish. Well, I think that is enough for discussion starter. On next week we will definitely add more fundamental issues - I just will have to decide which of them are most important on weekly basis. If you have any ideas – feel free to share on forum.
Now let’s shift to technical picture.
Monthly
This time frame extremely useful for gold market, since as you can see it stands in the range within 1.5 years. Why? Well, generally it could be explained by changing environment on financial markets. Globe economy has felt extremely bad, demand for gold was solid from China and India, banks have invested in gold actively as well - so invest in gold was simple. But now situation looks more complicated and blur. We see some improvements here and there, US stock market is growing, but bond yields still hold on all time lows. From time to time we see good statistics data, for example on US house market, but later we again see disappointing numbers. The same is in EU. It is possible that gold has turned to consolidation because it looks like to abandon gold is too early and risky and what the alternative, but conversely – something is changing, and may be it’s too late to invest in gold? So, market in fact, stands on guard and “hold” longs. Because if sell-off has started, we probably now should have gold around 1200$. Such situation and overall sentiment on the market puts impact on trading style, because traders can’t join long-term trends, they have to search for short-term trading against some significant levels and not marry any positions, trades have to be based on definite patterns that could give definite entry level, stop and profit objectives. That is the short characteristic of current gold market.
Still, current technical picture confirms conclusions of COT analysis. Market has non-obvious bullish gravitation. It could be seen from tight consolidation; market has shown very tight retracement after tremendous trend up and still stands tight. This usually happens before upward continuation.
On first chart we see two significant moments. First – take a look at trend by MACD. It is strongly bearish, but what is a price action? Right, it’s flat and does not support bear trend. This could suggest hidden bullish power and calls as “Dynamic pressure”. Second is, market is flirting with yearly pivot point at 1665 area. Yearly pivots are important by two reasons. Gold market has a tendency to create high or low for the year during first quarter. If market will move below it and take out current year lows around 1620 – I do not want to be bullish on Gold. That is the first scenario – keep an eye on yearly pivot and current year low. If market will move below it – our road is to yearly pivot support 1 that is lower border of consolidation as well. Will it mean that bullish sentiment is broken? Not necessarily. We know that when market stands in a long-term bull trend – Pivot Support 1 should hold retracement, if trend is still in play. Besides, move to lower border of consolidation doesn’t mean yet that bearish breakout will follow.

Now let’s speak about bullish perpsectives. I think that here could be Butterfly with 1.27 around 2000 level. Now it looks not as accurate as previously, but initial swing still intact. If we will stick with horizontal consolidation – in the case of upward breakout it will give us the same destinaton. Also you can see here triangle. Anyway, all patterns suggest upward move.

As conclusion from analysis of monthly chart we can say – two crucial levels for us here. They are 1625 current year low. Until it holds – we have a hope to upward continuation. If it will fail – we will turn on way to yearly pivot support 1 and lower border of monthly coil – 1536, that is a second level to watch.
Weekly
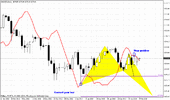
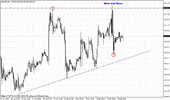
From the weekly perspective we have situation of stalemate. From the one point of view, trend is bearish. We have completed downward AB=CD pattern + Agreement right at 5/8 Fib support and shallow bounce up, that looks heavy and not impressive. Price now stands right around MPP=1662 that is also very close to yearly pivot. Until market stands above yearly lows (red circle) it is better to search possibility to enter long, but as closer to 1625 as possible. This level is also MPS1, currently we see weak respect of AB=CD, but this is Gartley “222” Buy as well, so, it might be re-test of this low and upward move. You should know that 0.618 retracements is a favorable level for Gold. It usually shows deep retracements and as a rule they are 0.618. Besides, this level is very common for butterflies.
If market will pass lower, then we should be ready for downward move right to the low of current consolidation. That’s why until this level holds it is better to tune on long positions with reasonable risks.

Daily
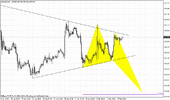
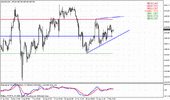
Daily picture of gold very sophisticated. Still, beginning should be more or less clear. We have bear trend and two bearish stop grabber side-by-sides right in the direction of previous move. This suggests that first market action should be downside and take out previous lows around 1650. So, if you’re scalper you may search the possibility to enter short on hourly chart. Potential target is downward AB=CD projection and Agreement with 0.768 Fib support 1640-1642 area.
Guys, but what could happen next – is very difficult to anticipate. If market is really bullish – the last chance to prove it is to hold at this 1640 level, create “222” buy and continue move up. Those of you who are bullish – this is the only setup that you can use for long entry. But if market will fail here – we will not have any other supports on all way down, and it could turn to butterfly “Buy” pattern. Further situation will depend on it. If market will form some sort of W&R and return right back above 1625 – hopes on bullish development will hold. If not and there will not be any reversal after butterfly, then it could road to the downside, as we’ve discussed above.
So, our trading plan here is to stick with stop grabber first and later we will see what to do… Don’t miss daily updates on gold.

4-hour
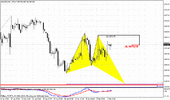
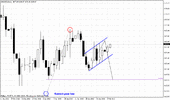
This chart shows why 1640 area is so signficant for bullish survival. In fact, here we have the mirror of daily picture but in smaller scale – bearish stop grabber as starting point of butterfly’s right wing. 1.27 butterfly target coincides with daily 0.768 support. Also butterfly inner AB-CD pattern has a 1.618 extension target in this area. Trend is bearish here.

1-hour
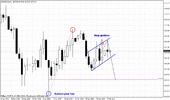
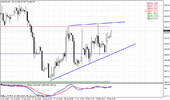
May be you will be laughing, but recent action on hourly chart could be treated as butterfly as well. Even more – it has 1.618 extension at the same 1640 area. Trend has turned bearish here, market is not at oversold, so, probably we could be focused on most resent downside swing to initiate short scalp trade. The inlay of 5-min chart shows K-resistance area around 1669 – recall, gold likes to make 5/8 retracements. So, probably it could be useful for entry, but it depends on your risk management and what particular pattern you will trade. Each of them have different stop level, so you have choice between 6 different patterns – 3 stop grabbers, 3 butterflies. Honestly speaking, it will be safer to place stop above daily stop grabber high, but not everybody could take this risk.

Conclusion:
As we’ve mentioned, gold stands among most cunning markets. Long-term picture suggests that market still stands in long-term bullish trend and has not broken yet, despite on 1.5 year consolidation. If upward move will continue, then market could reach 2000 level within 12-18 months.
If market will move and hold below current year’s low at 1625 – that could trigger retracement to 1536 level – low border of consolidation and yearly PS1. But even this move will not erase bullish trend.
Anyway long term picture does not give us any setups for trading, that’s why we have to look for intraday patterns and stick with it by FIFO way – fast in-fast out. (Who knows accounting will catch this joke). Since we have bearish trend at all time frames and bearish patterns that suggest downward move at least to 1640 level, we could try to join it on some pullback, probably to 1670 level.
Simultaneously we will continue to monitor fundamental picture around significant levels trying to understand the probability of re-establishing of long-term upward trend.
The technical portion of Sive's analysis owes a great deal to Joe DiNapoli's methods, and uses a number of Joe's proprietary indicators. Please note that Sive's analysis is his own view of the market and is not endorsed by Joe DiNapoli or any related companies.
Last edited by a moderator:
