Sive Morten
Special Consultant to the FPA
- Messages
- 18,760
Fundamentals
Gold rose 1.5 percent on Friday, cementing a third consecutive weekly gain, after disappointing U.S. jobs data stirred speculation the Federal Reserve will take a gradual approach to tapering its bond-buying stimulus this year. The dollar fell broadly and the S&P 500 equities index was flat after a closely watched Labor Department report showed U.S. employers in December hired the fewest number of workers in almost three years. U.S. nonfarm payrolls rose just 74,000 in December, the smallest increase since January 2011, while the unemployment rate fell 0.3 percentage point to 6.7 percent as more people left the labor force. Analysts said that falling U.S. labor participation is likely to prompt the Fed to be cautious in trimming its stimulus after the central bank opted to cut its bond purchases for the first time in December. In addition, gold could be further underpinned by falling equities prices following last year's tumble in bullion prices and stock markets' record run-up, analysts said.
"As the stock market declines, hedge funds and momentum traders are taking profits off their equities positions and rolling them into gold," said Jeffrey Sica, chief investment officer at New Jersey-based Sica Wealth, which manages more than $1 billion in client assets. For the week, gold was up almost 1 percent, extending its rise to a third consecutive week, its longest weekly winning streak since August.
Other analysts, however, said the weaker-than-expected U.S. jobs data will boost gold prices in the short term only, because an overall improvement in the U.S. economic outlook and a rising interest-rate environment will weigh on the metal's price. "Gold has been on the firm side this year and this data helps support that but the effect is being moderated by the fact that the Fed has begun tapering ... nobody is now thinking the U.S. economy is near collapsing," Macquarie analyst Matthew Turner said.
Monthly
January has started with upward action. Still changes are shy here. Trend holds bearish. As on EUR, here I also have drawn new yearly Pivot Points. Appearing of 1361 Yearly PP could get special meaning from possible retracement point of view. It could become possible nearest upside target. Yearly PR1 is also very significant. We know that gold likes to re-test previously broken lows and consolidations. 1540 area is monthly overbought, YPR1 and low border of broken long-term rectangle. As market was strongly oversold, why it can’t reach overbought? This is very typical action for any market.
As another application of significantly oversold we’ve suggested retracement up. Thus, we’ve made an assumption of possible deeper upward retracement that could take a shape of AB=CD, and invalidation for this setup is previous lows around 1170s. In fact current move up could be the last chance for possible upward bounce, if, say, market will show something like double bottom. Currently price action is very suitable for that – W&R of first bottom. This action in general is very typical for double bottoms and fake breakout could be the first sign of possible retracement up. Bearish market has no other reasons to stop right here, since there is no support right now – it has passed through 3/8 support, it’s not at oversold. Currently we should keep a close eye on move up. Now I’m gravitating to the thought that there really was W&R. Comex data is more reliable than just some Retail Forex broker, even Alpari UK.

Weekly
Trend has shifted bullish here. Upward action couldn’t get solid momentum yet. Price move is very gradual. Initially we’ve thought that this could become butterfly “buy” pattern, but it also could be “222” Buy, since if we’ve suggested that AB=CD has been completed and W&R really has happened, this could be double bottom. Also take a look, we have solid bullish divergence with MACD. By treating valleys as AB=CD pattern we’ll see that minor extension stands almost right at Yearly Pivot Point, and 1.618 extension stands slightly higher than Yearly PR1. This is really interesting agreement. Weekly chart points that we should search possibility for long entry. Odds suggest that after AB=CD completion market usually shows at minimum 3/8 retracement, and on the weekly chart this will be not small move. This, of cause, makes sense only if W&R of 1180 lows really has happened. If we will be wrong with this suggestion then we will get the trap that we’ve discussed previously.

Daily
It is difficult to add something really new here. Anyway analysis will stand around this possible H&S pattern. Trend holds bullish here and price has come up to expectations. Recall that we’ve said – if market is really bullish and trying to shift long-term sentiment, it should not at any case turn down again right now, because this could become an end for any bullish perspectives. Price should not show any unreasonable and sudden downward returns when it forms reversal pattern. Otherwise this pattern will loose foundation. So price has held above MPP that simultaneously was neckline of intraday Double Bottom pattern and kept chances for upward continuation.
Thus, in nearest day we have to keep an eye on move to 1250-1267 that is neckline, Fib resistance and MPR1. Scalpers could try to find bearish setups there, since according to our plan price should return right back down to 1217-1220 area – where should spear the valley of right shoulder. But for daily traders major concern stands around chances for long entry by this reverse H&S pattern. So, for day-traders major activity still stands in the future.

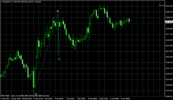
4-hour
So trend still holds bullish here. As market has held above neckline of Double Bottom pattern and that was former WPP, it has kept chances for greater reversal pattern on daily time frame chart. Now we have AB-CD pattern in progress with minimum target at 1257 that almost coinsides with WPR1=1260. That’s the setup for Monday. Unfortunately we will not get butterfly “sell” pattern here, since market already has exceeded previous high. If any retracement will happen prior target reaching, it will be better if price still will remain above WPP.

Conclusion:
Market still preparing and preparing possible solid reversal pattern on daily thus, it looks like major events will follow a bit later. But right now we already can see interesting agreement between possible upward targets and Yearly Pivots.
Meantime, in shorter-term perspective, on current week we will watch how market will form right shoulder of possible reversal H&S pattern.
The technical portion of Sive's analysis owes a great deal to Joe DiNapoli's methods, and uses a number of Joe's proprietary indicators. Please note that Sive's analysis is his own view of the market and is not endorsed by Joe DiNapoli or any related companies.
Gold rose 1.5 percent on Friday, cementing a third consecutive weekly gain, after disappointing U.S. jobs data stirred speculation the Federal Reserve will take a gradual approach to tapering its bond-buying stimulus this year. The dollar fell broadly and the S&P 500 equities index was flat after a closely watched Labor Department report showed U.S. employers in December hired the fewest number of workers in almost three years. U.S. nonfarm payrolls rose just 74,000 in December, the smallest increase since January 2011, while the unemployment rate fell 0.3 percentage point to 6.7 percent as more people left the labor force. Analysts said that falling U.S. labor participation is likely to prompt the Fed to be cautious in trimming its stimulus after the central bank opted to cut its bond purchases for the first time in December. In addition, gold could be further underpinned by falling equities prices following last year's tumble in bullion prices and stock markets' record run-up, analysts said.
"As the stock market declines, hedge funds and momentum traders are taking profits off their equities positions and rolling them into gold," said Jeffrey Sica, chief investment officer at New Jersey-based Sica Wealth, which manages more than $1 billion in client assets. For the week, gold was up almost 1 percent, extending its rise to a third consecutive week, its longest weekly winning streak since August.
Other analysts, however, said the weaker-than-expected U.S. jobs data will boost gold prices in the short term only, because an overall improvement in the U.S. economic outlook and a rising interest-rate environment will weigh on the metal's price. "Gold has been on the firm side this year and this data helps support that but the effect is being moderated by the fact that the Fed has begun tapering ... nobody is now thinking the U.S. economy is near collapsing," Macquarie analyst Matthew Turner said.
Monthly
January has started with upward action. Still changes are shy here. Trend holds bearish. As on EUR, here I also have drawn new yearly Pivot Points. Appearing of 1361 Yearly PP could get special meaning from possible retracement point of view. It could become possible nearest upside target. Yearly PR1 is also very significant. We know that gold likes to re-test previously broken lows and consolidations. 1540 area is monthly overbought, YPR1 and low border of broken long-term rectangle. As market was strongly oversold, why it can’t reach overbought? This is very typical action for any market.
As another application of significantly oversold we’ve suggested retracement up. Thus, we’ve made an assumption of possible deeper upward retracement that could take a shape of AB=CD, and invalidation for this setup is previous lows around 1170s. In fact current move up could be the last chance for possible upward bounce, if, say, market will show something like double bottom. Currently price action is very suitable for that – W&R of first bottom. This action in general is very typical for double bottoms and fake breakout could be the first sign of possible retracement up. Bearish market has no other reasons to stop right here, since there is no support right now – it has passed through 3/8 support, it’s not at oversold. Currently we should keep a close eye on move up. Now I’m gravitating to the thought that there really was W&R. Comex data is more reliable than just some Retail Forex broker, even Alpari UK.
Weekly
Trend has shifted bullish here. Upward action couldn’t get solid momentum yet. Price move is very gradual. Initially we’ve thought that this could become butterfly “buy” pattern, but it also could be “222” Buy, since if we’ve suggested that AB=CD has been completed and W&R really has happened, this could be double bottom. Also take a look, we have solid bullish divergence with MACD. By treating valleys as AB=CD pattern we’ll see that minor extension stands almost right at Yearly Pivot Point, and 1.618 extension stands slightly higher than Yearly PR1. This is really interesting agreement. Weekly chart points that we should search possibility for long entry. Odds suggest that after AB=CD completion market usually shows at minimum 3/8 retracement, and on the weekly chart this will be not small move. This, of cause, makes sense only if W&R of 1180 lows really has happened. If we will be wrong with this suggestion then we will get the trap that we’ve discussed previously.
Daily
It is difficult to add something really new here. Anyway analysis will stand around this possible H&S pattern. Trend holds bullish here and price has come up to expectations. Recall that we’ve said – if market is really bullish and trying to shift long-term sentiment, it should not at any case turn down again right now, because this could become an end for any bullish perspectives. Price should not show any unreasonable and sudden downward returns when it forms reversal pattern. Otherwise this pattern will loose foundation. So price has held above MPP that simultaneously was neckline of intraday Double Bottom pattern and kept chances for upward continuation.
Thus, in nearest day we have to keep an eye on move to 1250-1267 that is neckline, Fib resistance and MPR1. Scalpers could try to find bearish setups there, since according to our plan price should return right back down to 1217-1220 area – where should spear the valley of right shoulder. But for daily traders major concern stands around chances for long entry by this reverse H&S pattern. So, for day-traders major activity still stands in the future.
4-hour
So trend still holds bullish here. As market has held above neckline of Double Bottom pattern and that was former WPP, it has kept chances for greater reversal pattern on daily time frame chart. Now we have AB-CD pattern in progress with minimum target at 1257 that almost coinsides with WPR1=1260. That’s the setup for Monday. Unfortunately we will not get butterfly “sell” pattern here, since market already has exceeded previous high. If any retracement will happen prior target reaching, it will be better if price still will remain above WPP.
Conclusion:
Market still preparing and preparing possible solid reversal pattern on daily thus, it looks like major events will follow a bit later. But right now we already can see interesting agreement between possible upward targets and Yearly Pivots.
Meantime, in shorter-term perspective, on current week we will watch how market will form right shoulder of possible reversal H&S pattern.
The technical portion of Sive's analysis owes a great deal to Joe DiNapoli's methods, and uses a number of Joe's proprietary indicators. Please note that Sive's analysis is his own view of the market and is not endorsed by Joe DiNapoli or any related companies.