Sive Morten
Special Consultant to the FPA
- Messages
- 18,699
Fundamentals
Weekly Gold Tading Report prepared by Sive Morten exclusively for ForexPeaceArmy.com
Reuters reports Gold gave up earlier gains on Friday after U.S. Federal Reserve Chair Janet Yellen said she expected the central bank to raise interest rates sometime this year but pointed to concerns that U.S. labor markets remain weak.
In a speech that cautioned about the status of workers as well as some international risks, Yellen gave no direct hint about whether she anticipated more than one rate hike over the Fed's four remaining meetings in 2015.
"(It) looks like a probable interest rate hike scheduled for this year, with or without Greece," said George Gero, precious metals strategist for RBC Capital Markets in New York.
"Yellen's more hawkish-than-expected tone is sparking a modest gold selloff," said Tai Wong, director of base and precious metals trading for BMO Capital Markets in New York.
"Gold is getting some support from the stronger euro, but if we get a deal with Greece on Sunday, it should be bearish for gold because it removes any risk," Societe Generale analyst Robin Bhar said.
Physical demand remained tepid this week as prospective investors in China chased bargains in equities after a market selloff, while those in India delayed purchases.
The metal in India still sold at a discount to the global benchmark.
Chinese stocks rose sharply for the second straight day after Beijing banned shareholders with large stakes in listed companies from selling, moving to stem a rout that pulled down key indexes by about 30 percent from mid-June.
Also benefiting gold earlier, the International Monetary Fund trimmed its forecast for global economic growth this year to 3.3 percent from 3.5 percent, citing recent weakness in the United States.
Recent CFTC data shows increase in open interest and contraction of net long position. Speculative short positions were increasing during whole June, while long positions mostly stand flat and even have decreased recently. So, CFTC data shows classical bearish dynamic and supports further decreasing on gold market.
SPDR fund mostly reports on stagnation of its storages. Two weeks ago they have dropped to 702 tonnes, and then have increased to 709. Now storages stands around 707.8 tonnes.
That’s being said sentiment data mostly supports further downward action on gold market.
Here is detailed breakdown of speculative positions:
Open interest:
 Shorts:
 Longs:
 Summary:
Technicals
Monthly
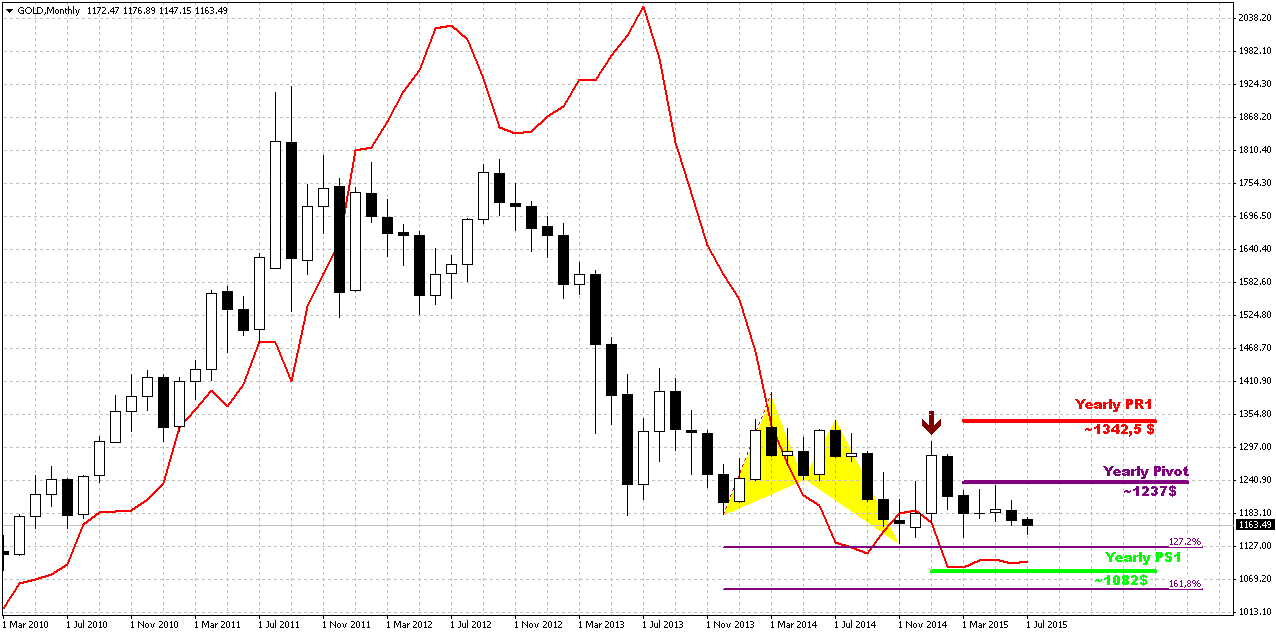
Last week shows no impact on monthly chart. Gold stands rather flat on monthly chart within 4 months in a row. Currently bearish dynamic pressure becomes very clear on this chart. It seems that gold just waits for some push. It means that as bearish dynamic pressure as VOB pattern are still valid.
On long-term horizon we still have last big pattern in progress that is Volatility breakout (VOB). It suggests at least 0.618 AB-CD down. And this target is 1050$. At the same time we need 1130 breakout to start clearly speak on 1050 target.
But what action market should show to break huge bearish patterns on monthly? Dynamic pressure is a tendency of lower highs within bullish trend. Hence, to break it, market should show higher high. I’ve marked it with arrow. It means that market should take out 1308 top to break this pattern and make investors doubt on bearish perspectives of gold market in long term. That’s why action that we have on daily and intraday charts right now is not an action of monthly one yet. Early bell of changing situation could be moving above YPP.
Overall picture still remains mostly bearish. In the beginning of the year market showed solid upside action. Gold was able to exceed yearly pivot, passed half way to Yearly Pivot resistance 1 but right now has reversed down and closed below YPP. From technical point of view this is bearish sign. This could be very significant moment and next logical destination will be yearly pivot support 1 around 1083$.
Fundamentally, gold mostly is hostage of dollar value and US economical data (mostly inflation) in nearest perspective. Approximately the same was announced by Fed in forecast on inflation and had become a reason of dovish approach to rate hiking. Another concern right now is too strong dollar that becomes a problem per se for economy growth and kills inflation. Prices are fallen so no needs to hike rates. The same information comes from President’s administration – it seems that Obama’s cabinet unsatisfied with too strong dollar and IMF was asking Fed to postpone rate hike on next year. We do not know whether these moments were become a reason of dovish tone in Fed comments or not, but result is the same. Fed has announced some worrying on employment and inflation and said that they need to get more strength in this data…
If we will take into consideration geopolitical situation and risks that have appeared recently, it could happen that situation will change, especially if situation in Ukraine will escalate and peaceful regulation will fail. Day by day we see worrying geopolitical news – Macedonia, Yemen, and Syria are to name some. Unfortunately the geopolicy is sphere where we can’t do much.
That’s being said, as gold has passed through 1200 and until it stands below 1308 top, our long-term next destination point is previous lows at 1130, but if gold will return to 1130 for second time – this is temporal destination and we should prepare for further downward action.
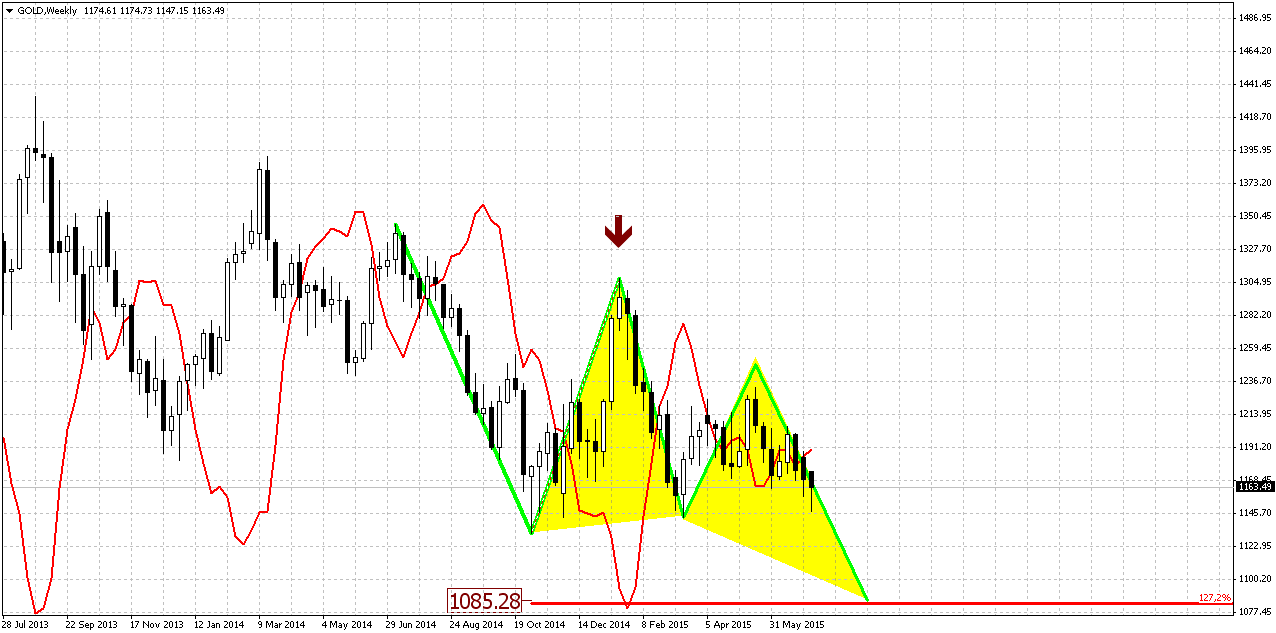
Trend is bearish here. Unfortunately (or fortunately) gold has not shown solid action on weekly chart and mostly situation remains the same as it was on previous week. Since April trend mostly holds bullish (by MACD), but price action is not, gold can’t start upside action. This could be the sign of market’s weakness.
Last week we also have got pure bearish grabber, and it looks as it should to. This is new pattern that points on downward continuation.
Our major pattern here is still big butterfly. Speaking on targets, we have three different patterns that point on the same level. They are butterfly “buy”, AB=CD and the part of this AB-CD that takes “222” Sell shape.
Thus, all these patterns point at the same destination around 1080$. This level is special, because it coincides with YPS1. Acceleration probably should happen after 1130 breakout.
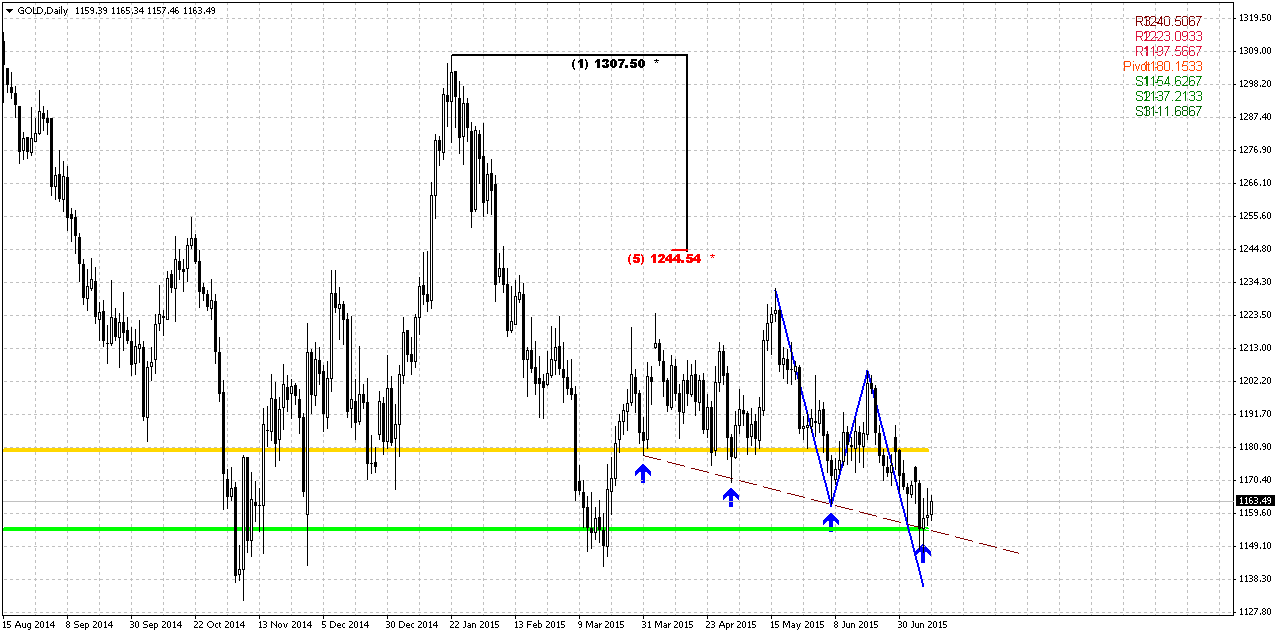
Daily
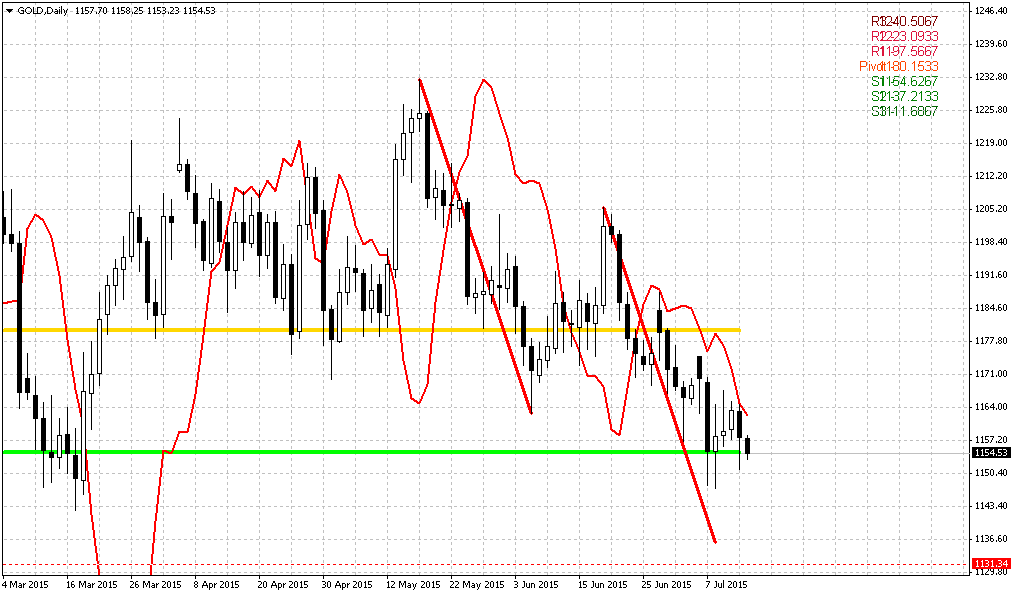
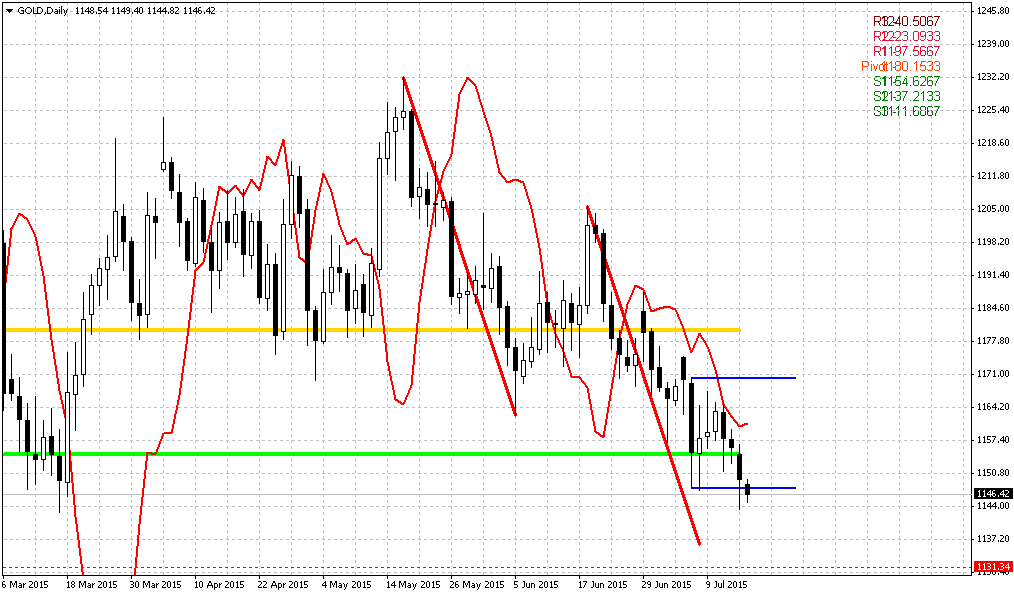
Trend is bearish here. On daily chart market slowly but stably continues move down. Major pattern here is downward AB=CD that should lead market to our next target around 1130-1135. Last week market has shown reasonable respect of support area around trend line and MPS1. As market has passed through minor 0.618 extension of AB-CD, now gold stands in kind of semi-position between 0.618 and 1.0 targets. In this case in most cases market gravitates to next target and rarely turns opposite direction before will hit it.
Theoretically we could assume appearing another minor butterfly here with left wing at 1140-1230 swing. But currently it is difficult to say whether this will happen or not.
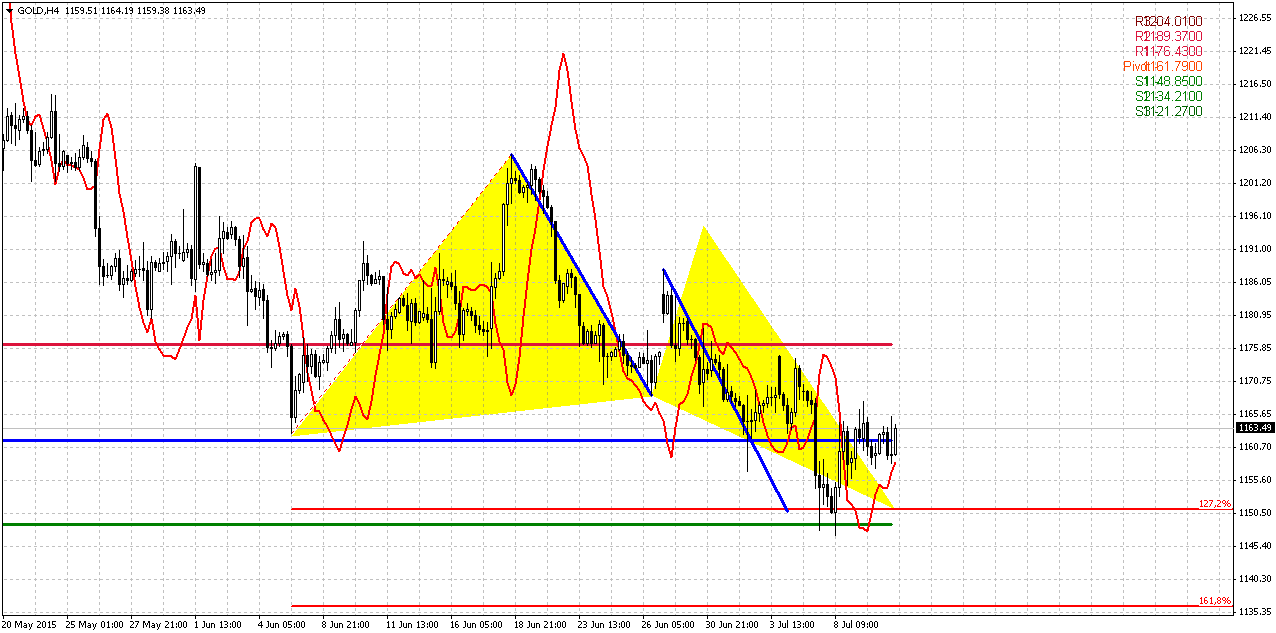
4-hour
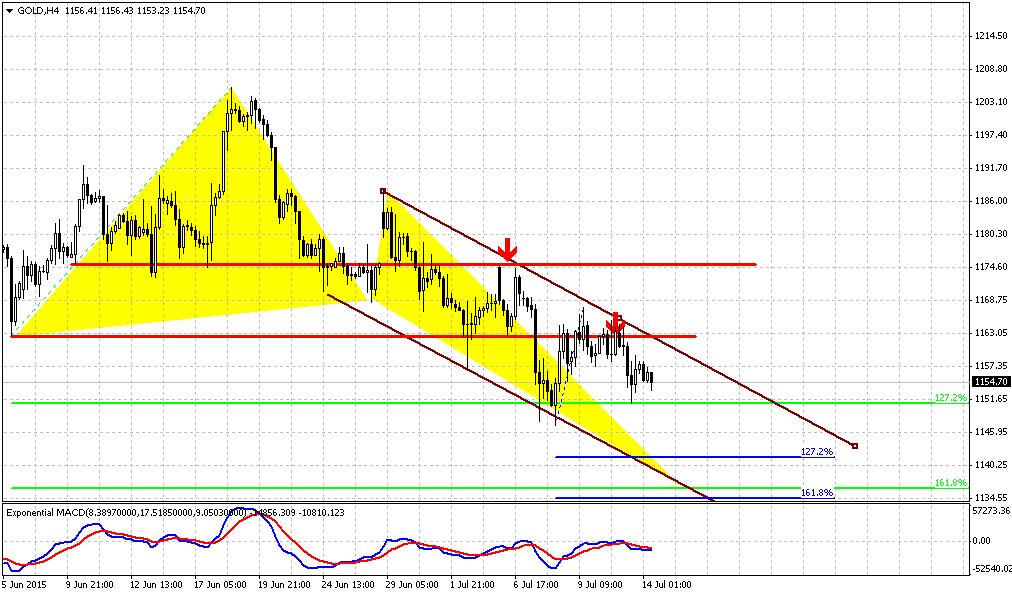
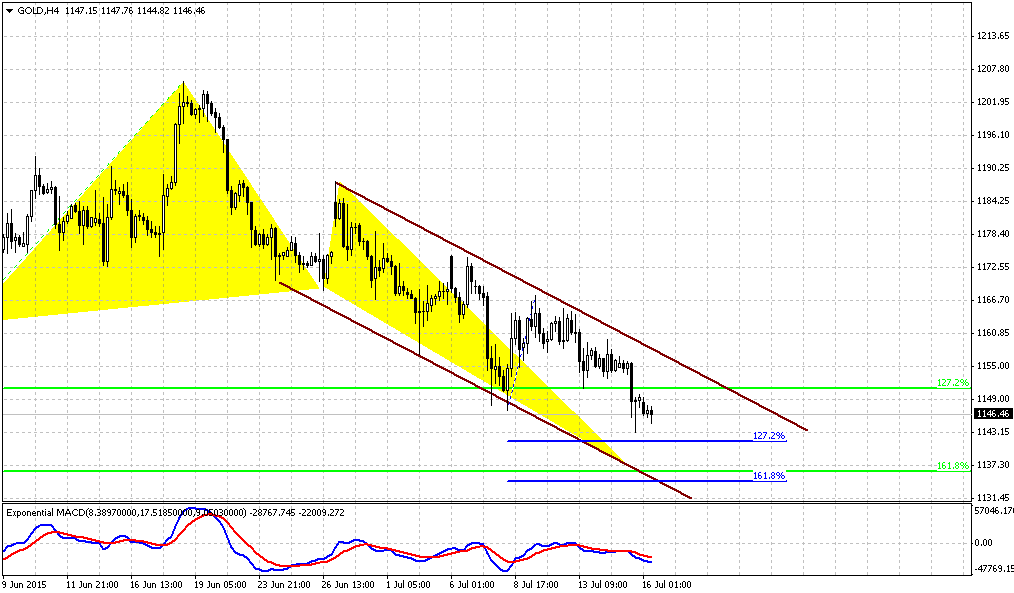
Last week market mostly accomplished our target and reached 1150 level. As we’ve suggested market whole week has spent in upside retracement to 1160-1162 level. Now we see couple of moments that could be important soon. First is, take a look that market has shown fast acceleration on the way to AB=CD target and 1.27 butterfly extension. Usually when market shows such sort of action, later it returns to downward action and reaches 1.618 extension. Second – take a look at recent action. Market has reached 1160 resistance but has not turned to downward action yet. Here we start to see signs of bearish dynamic pressure. While trend has turned bearish market mostly stands flat. That’s why picture that we see right now on 4-hour time frame suggests that downward continuation is a question of time.
Conclusion:
Long-term picture remains bearish and major patterns stand mostly intact. Our long-term target still stands at 1050-1080 area. We do not exclude scenario with possible upside action if situation in Greece will develop in negative direction but we think that hardly this event drastically will change the tendency. Other words speaking, we accept idea of possible upside action, may be it even could be significant, but this action hardly will break long-term bearish trend and sentiment. Reaction on Greece default could be strong, but probably it will not be long-term. Greece problem was discussing for a long period already and negative result probably partially was priced in already.
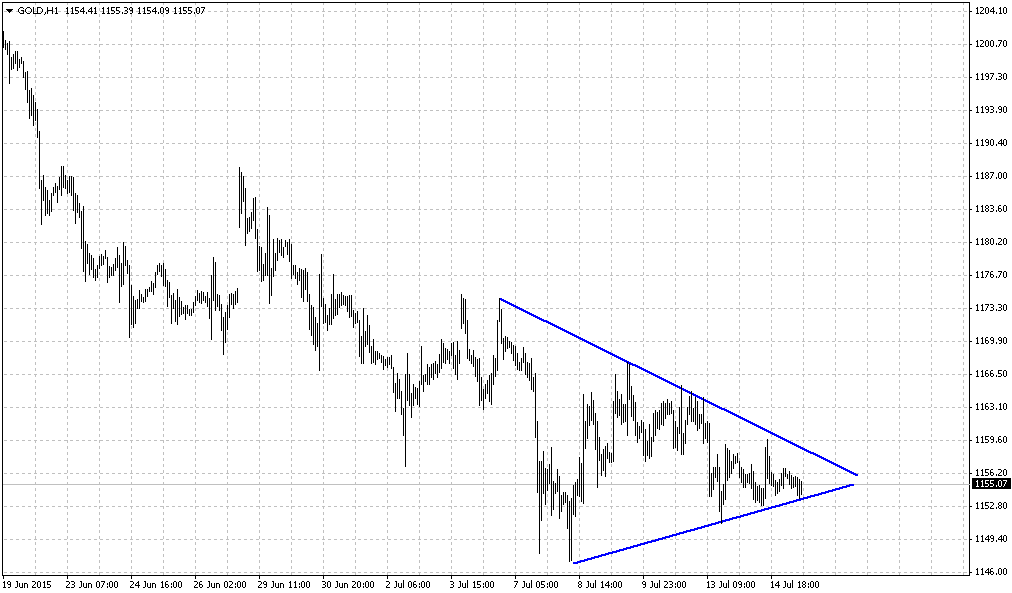
On short-term charts if nothing drastical will happen, we expect re-establishing of downward action from current levels to 1130-1135 area. Any explosive upside action at Monday’s open will tell us to avoid bearish position.
The technical portion of Sive's analysis owes a great deal to Joe DiNapoli's methods, and uses a number of Joe's proprietary indicators. Please note that Sive's analysis is his own view of the market and is not endorsed by Joe DiNapoli or any related companies.
Weekly Gold Tading Report prepared by Sive Morten exclusively for ForexPeaceArmy.com
Reuters reports Gold gave up earlier gains on Friday after U.S. Federal Reserve Chair Janet Yellen said she expected the central bank to raise interest rates sometime this year but pointed to concerns that U.S. labor markets remain weak.
In a speech that cautioned about the status of workers as well as some international risks, Yellen gave no direct hint about whether she anticipated more than one rate hike over the Fed's four remaining meetings in 2015.
"(It) looks like a probable interest rate hike scheduled for this year, with or without Greece," said George Gero, precious metals strategist for RBC Capital Markets in New York.
"Yellen's more hawkish-than-expected tone is sparking a modest gold selloff," said Tai Wong, director of base and precious metals trading for BMO Capital Markets in New York.
"Gold is getting some support from the stronger euro, but if we get a deal with Greece on Sunday, it should be bearish for gold because it removes any risk," Societe Generale analyst Robin Bhar said.
Physical demand remained tepid this week as prospective investors in China chased bargains in equities after a market selloff, while those in India delayed purchases.
The metal in India still sold at a discount to the global benchmark.
Chinese stocks rose sharply for the second straight day after Beijing banned shareholders with large stakes in listed companies from selling, moving to stem a rout that pulled down key indexes by about 30 percent from mid-June.
Also benefiting gold earlier, the International Monetary Fund trimmed its forecast for global economic growth this year to 3.3 percent from 3.5 percent, citing recent weakness in the United States.
Recent CFTC data shows increase in open interest and contraction of net long position. Speculative short positions were increasing during whole June, while long positions mostly stand flat and even have decreased recently. So, CFTC data shows classical bearish dynamic and supports further decreasing on gold market.
SPDR fund mostly reports on stagnation of its storages. Two weeks ago they have dropped to 702 tonnes, and then have increased to 709. Now storages stands around 707.8 tonnes.
That’s being said sentiment data mostly supports further downward action on gold market.
Here is detailed breakdown of speculative positions:
Open interest:
Technicals
Monthly
Last week shows no impact on monthly chart. Gold stands rather flat on monthly chart within 4 months in a row. Currently bearish dynamic pressure becomes very clear on this chart. It seems that gold just waits for some push. It means that as bearish dynamic pressure as VOB pattern are still valid.
On long-term horizon we still have last big pattern in progress that is Volatility breakout (VOB). It suggests at least 0.618 AB-CD down. And this target is 1050$. At the same time we need 1130 breakout to start clearly speak on 1050 target.
But what action market should show to break huge bearish patterns on monthly? Dynamic pressure is a tendency of lower highs within bullish trend. Hence, to break it, market should show higher high. I’ve marked it with arrow. It means that market should take out 1308 top to break this pattern and make investors doubt on bearish perspectives of gold market in long term. That’s why action that we have on daily and intraday charts right now is not an action of monthly one yet. Early bell of changing situation could be moving above YPP.
Overall picture still remains mostly bearish. In the beginning of the year market showed solid upside action. Gold was able to exceed yearly pivot, passed half way to Yearly Pivot resistance 1 but right now has reversed down and closed below YPP. From technical point of view this is bearish sign. This could be very significant moment and next logical destination will be yearly pivot support 1 around 1083$.
Fundamentally, gold mostly is hostage of dollar value and US economical data (mostly inflation) in nearest perspective. Approximately the same was announced by Fed in forecast on inflation and had become a reason of dovish approach to rate hiking. Another concern right now is too strong dollar that becomes a problem per se for economy growth and kills inflation. Prices are fallen so no needs to hike rates. The same information comes from President’s administration – it seems that Obama’s cabinet unsatisfied with too strong dollar and IMF was asking Fed to postpone rate hike on next year. We do not know whether these moments were become a reason of dovish tone in Fed comments or not, but result is the same. Fed has announced some worrying on employment and inflation and said that they need to get more strength in this data…
If we will take into consideration geopolitical situation and risks that have appeared recently, it could happen that situation will change, especially if situation in Ukraine will escalate and peaceful regulation will fail. Day by day we see worrying geopolitical news – Macedonia, Yemen, and Syria are to name some. Unfortunately the geopolicy is sphere where we can’t do much.
That’s being said, as gold has passed through 1200 and until it stands below 1308 top, our long-term next destination point is previous lows at 1130, but if gold will return to 1130 for second time – this is temporal destination and we should prepare for further downward action.
Trend is bearish here. Unfortunately (or fortunately) gold has not shown solid action on weekly chart and mostly situation remains the same as it was on previous week. Since April trend mostly holds bullish (by MACD), but price action is not, gold can’t start upside action. This could be the sign of market’s weakness.
Last week we also have got pure bearish grabber, and it looks as it should to. This is new pattern that points on downward continuation.
Our major pattern here is still big butterfly. Speaking on targets, we have three different patterns that point on the same level. They are butterfly “buy”, AB=CD and the part of this AB-CD that takes “222” Sell shape.
Thus, all these patterns point at the same destination around 1080$. This level is special, because it coincides with YPS1. Acceleration probably should happen after 1130 breakout.
Daily
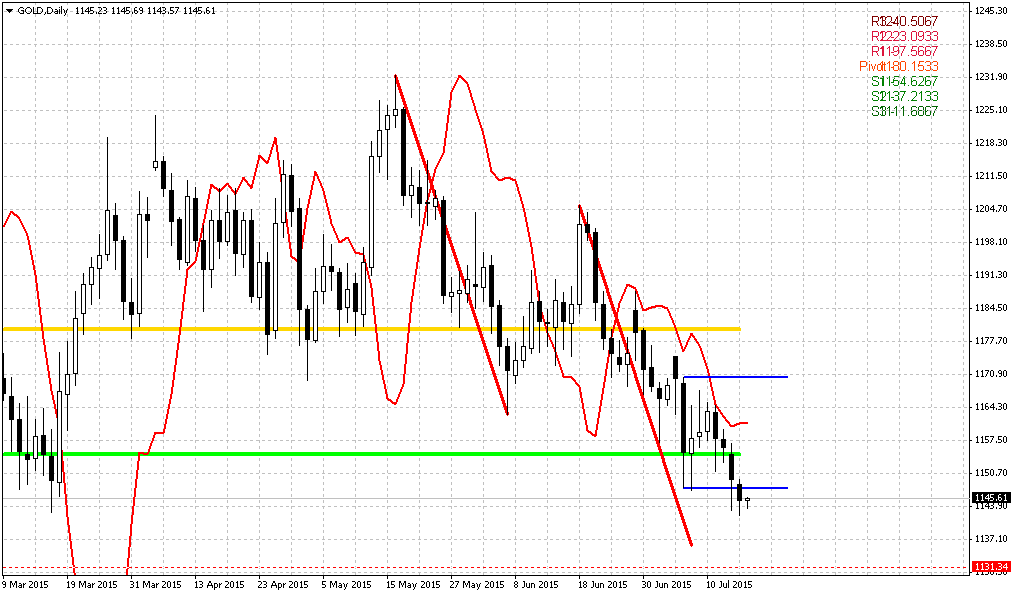
Trend is bearish here. On daily chart market slowly but stably continues move down. Major pattern here is downward AB=CD that should lead market to our next target around 1130-1135. Last week market has shown reasonable respect of support area around trend line and MPS1. As market has passed through minor 0.618 extension of AB-CD, now gold stands in kind of semi-position between 0.618 and 1.0 targets. In this case in most cases market gravitates to next target and rarely turns opposite direction before will hit it.
Theoretically we could assume appearing another minor butterfly here with left wing at 1140-1230 swing. But currently it is difficult to say whether this will happen or not.
4-hour
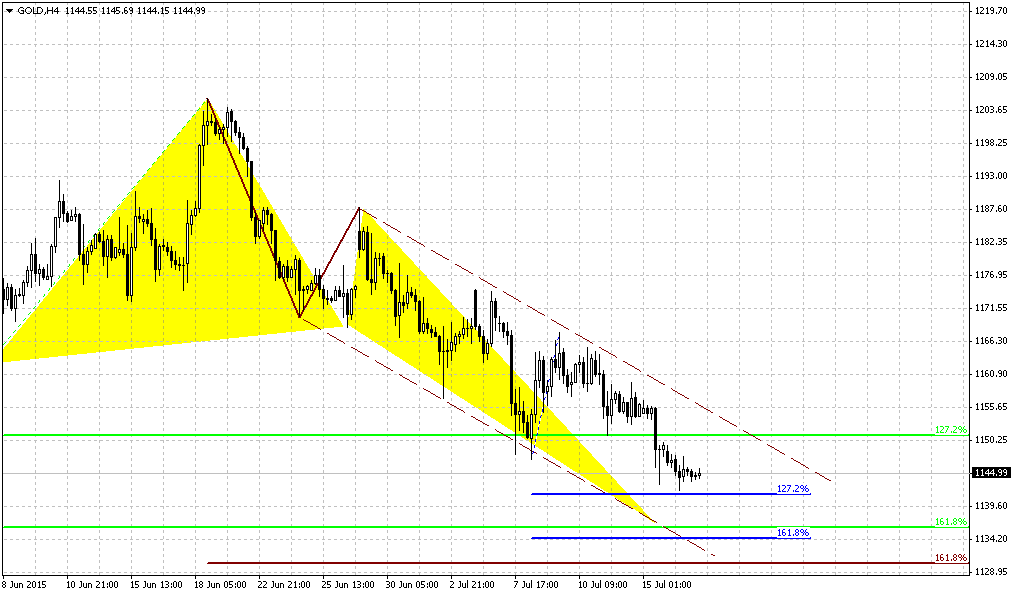
Last week market mostly accomplished our target and reached 1150 level. As we’ve suggested market whole week has spent in upside retracement to 1160-1162 level. Now we see couple of moments that could be important soon. First is, take a look that market has shown fast acceleration on the way to AB=CD target and 1.27 butterfly extension. Usually when market shows such sort of action, later it returns to downward action and reaches 1.618 extension. Second – take a look at recent action. Market has reached 1160 resistance but has not turned to downward action yet. Here we start to see signs of bearish dynamic pressure. While trend has turned bearish market mostly stands flat. That’s why picture that we see right now on 4-hour time frame suggests that downward continuation is a question of time.
Conclusion:
Long-term picture remains bearish and major patterns stand mostly intact. Our long-term target still stands at 1050-1080 area. We do not exclude scenario with possible upside action if situation in Greece will develop in negative direction but we think that hardly this event drastically will change the tendency. Other words speaking, we accept idea of possible upside action, may be it even could be significant, but this action hardly will break long-term bearish trend and sentiment. Reaction on Greece default could be strong, but probably it will not be long-term. Greece problem was discussing for a long period already and negative result probably partially was priced in already.
On short-term charts if nothing drastical will happen, we expect re-establishing of downward action from current levels to 1130-1135 area. Any explosive upside action at Monday’s open will tell us to avoid bearish position.
The technical portion of Sive's analysis owes a great deal to Joe DiNapoli's methods, and uses a number of Joe's proprietary indicators. Please note that Sive's analysis is his own view of the market and is not endorsed by Joe DiNapoli or any related companies.