Sive Morten
Special Consultant to the FPA
- Messages
- 18,673
Fundamentals
Weekly Gold Tading Report prepared by Sive Morten exclusively for ForexPeaceArmy.com
Reuters reports Gold edged up on Friday from the previous day's 2-1/2-week low, supported by a softer dollar and uncertainty over Greece's debt talks, but remained under pressure from expectations U.S. interest rates might rise soon.
The prospect of higher rates, which would boost the opportunity cost of holding non-yielding gold while lifting the dollar, kept the metal on track for a second weekly drop.
"The gold market will eventually have to discount the fact that the Fed is not going to put through a series of rate hikes, one after the other, but will rather just put in one in and wait," said Edward Meir, INTL FCStone analyst.
"If it does that, I think the market should respond by moving a bit higher. In the meantime, we're in this drift doing nothing."
The greenback's weakness came after rallying nearly 3 percent after Federal Reserve Chair Janet Yellen said last week that the U.S. central bank was on track to raise rates later this year.
"The recent surge in the dollar, which pushed crude oil prices lower, has put pressure on gold," ING commodities analyst Hamza Khan said.
There were mixed signals this week on the outcome of talks over Greece's debt, without which Athens risks default or bankruptcy in weeks.
Greek government spokesman said on Thursday that it intended to agree a cash-for-reforms deal by Sunday. Euro zone officials suggested, though, that a deal was far from imminent, and the head of the International Monetary Fund was quoted as saying Greece could fall out of the euro zone.
"While gold hasn't gained much of an upside (from the uncertainty over Greece) ... it hasn't seen much of a downside, given the resurgence of the dollar," Standard Chartered's global head of commodities research Paul Horsnall said.
Dealers noted quiet gold trading overnight in Asia, the metal's main physical markets, where premiums in major trading centers failed to rise this week despite the price drop.
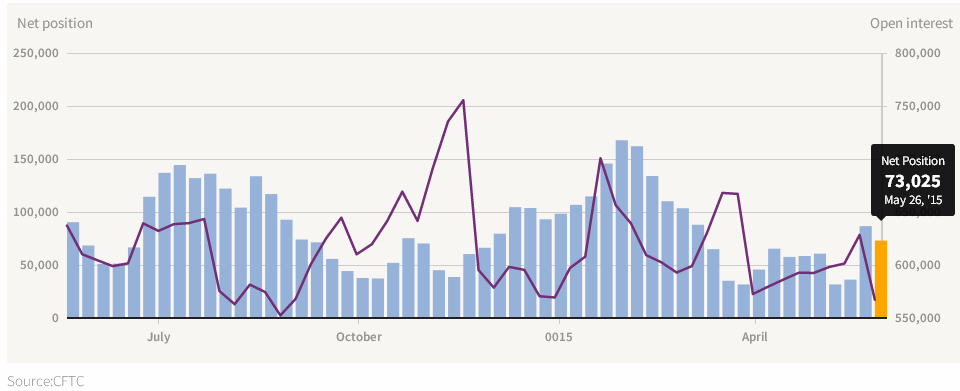
Our suspicions on upside jump in CFTC data have been confirmed. Last week COT report shows huge drop in open interest and net long position. At the same time, speculative shorts are up for 7K. Hedgers also show massive out from gold, but more shorts were closed. As hedgers take counter-trend position, it means that they assess upside reversal as not very probable right now.
SPDR fund has not shown any strong outflow, storages are down just for 3 tonnes to 715 tonnes of gold, this is not very significant weekly drop. Still, this is definitely not an increasing of position and in general confirms dynamic of COT report. This is warning for us that any long position right now will be under pressure, fragile and carries great risk.
 Summary:
 Technicals
Monthly
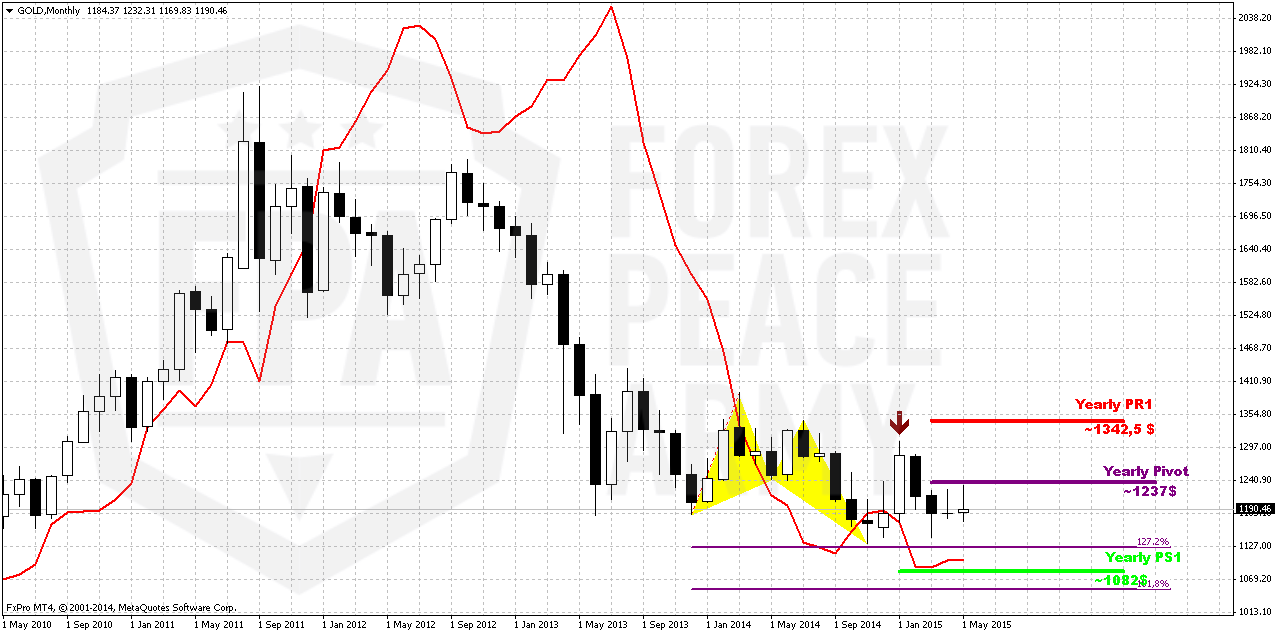
Last week shows no impact on monthly chart. Gold stands rather flat on monthly chart within second month in a row. But between April standing and May standing is big difference. In May investors are coming to action, at least, CFTC data shows the signs of it, while in April CFTC was absolutely anemic and market was driven by technical and news flows. So, this lets us hope that we will see some acceleration soon
Whether recent jump has harmed any of our long-term patterns? Not yet. As bearish dynamic pressure as VOB pattern are still valid.
On long-term horizon we still have last big pattern in progress that is Volatility breakout (VOB). It suggests at least 0.618 AB-CD down. And this target is 1050$. At the same time we need 1130 breakout to start clearly speak on 1050 target.
But what action market should show to break huge bearish patterns on monthly? Dynamic pressure is a tendency of lower highs within bullish trend. Hence, to break it, market should show higher high. I’ve marked it with arrow. It means that market should take out 1308 top to break this pattern and make investors doubt on bearish perspectives of gold market in long term. That’s why action that we have on daily and intraday charts right now is not an action of monthly one yet. Early bell of changing situation could be moving above YPP.
Overall picture still remains mostly bearish. In the beginning of the year market showed solid upside action. Gold was able to exceed yearly pivot, passed half way to Yearly Pivot resistance 1 but right now has reversed down and closed below YPP. From technical point of view this is bearish sign. This could be very significant moment and next logical destination will be yearly pivot support 1 around 1083$.
Currently, despite rare upside splashes in CFTC data, we couldn’t say yet that situation has changed drastically. We need to get few weeks of net long position increasing, to get positive dynamic on SPDR storages to get confidence with upside action. Other words, we need to get some proves that recent changes is not occasion, as it has happened recently.
Still right now gold mostly is hostage of dollar value and US economical data (mostly inflation) in nearest perspective. Approximately the same was announced by Fed in forecast on inflation and had become a reason of dovish approach to rate hiking. Another concern right now is too strong dollar that becomes a problem per se for economy growth and kills inflation. Prices are fallen so no needs to hike rates. So, after positive CPI report investors will wait for June Fed meeting and NFP on coming week.
If we will take into consideration geopolitical situation and risks that have appeared recently, it could happen that situation will change, especially if situation in Ukraine will escalate and peaceful regulation will fail. Day by day we see worrying geopolitical news – Macedonia, Yemen to name some. Unfortunately the geopolicy is sphere where we can’t do much.
That’s being said, as gold has passed through 1200 and until it stands below 1308 top, our long-term next destination point is previous lows at 1130, but since gold is returning to 1130 for second time – this is temporal destination and we should prepare for further downward action. Current upside action we should treat as retracement, although it could be really significant on lower time frames.
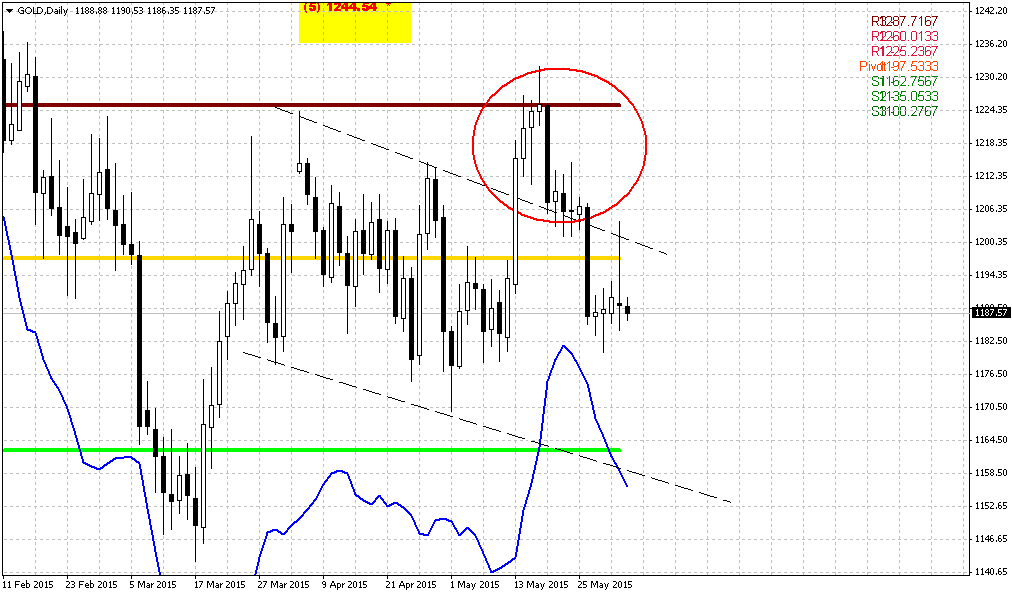
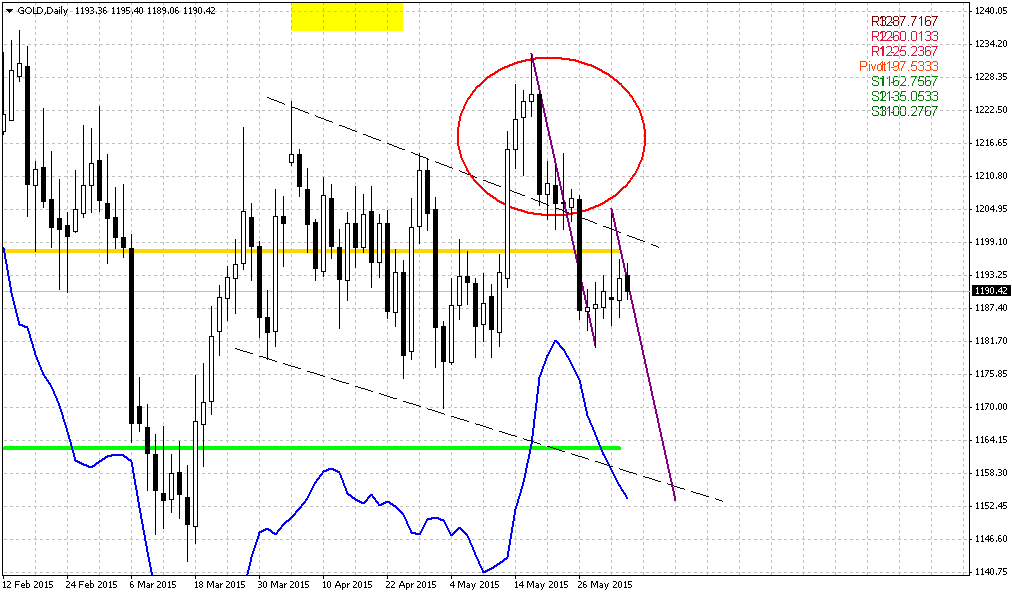
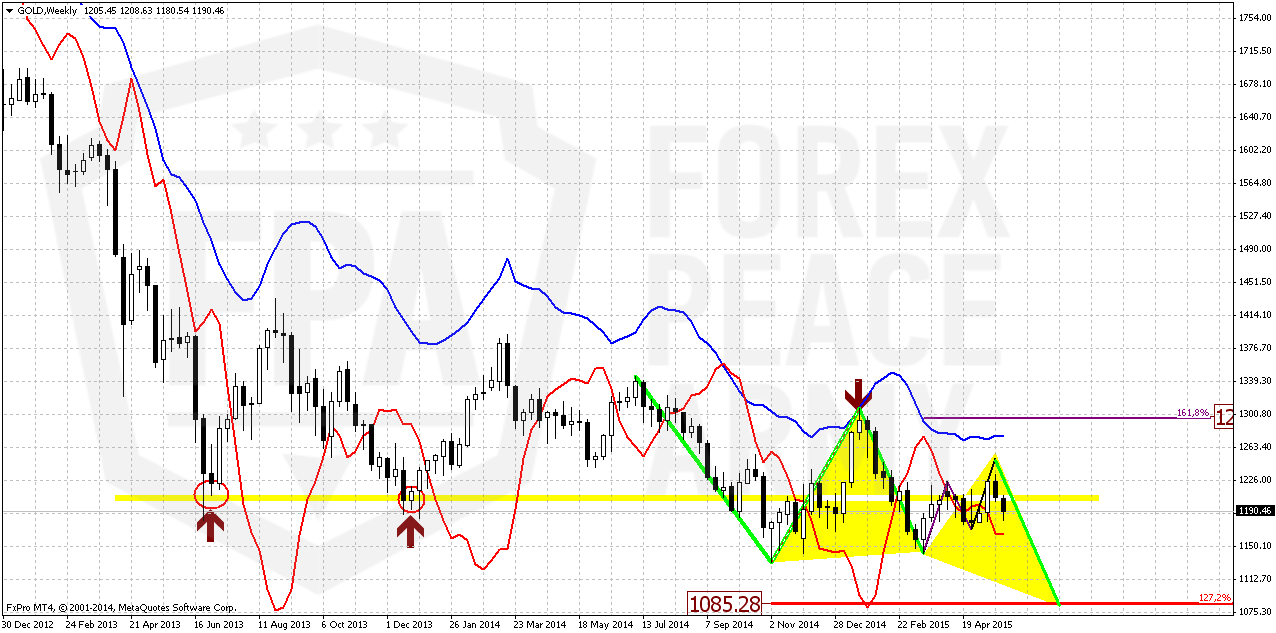
Weekly
Right now trend on weekly chart has shifted bullish, grabbers were vanished, but is it really shift long-term view on weekly chart? Although trend has turned bullish three weeks ago, market does not show any upside acceleration, mostly stands flat and even decreasing in last two weeks. Such action easily could take the shape of bearish dynamic pressure.
Recently market has passed through long-term natural support/resitsance level (marked with circles) but last week has returned right back down. Market has not even completed AB-CD pattern with destination point will be around 1230-1250 level. In general, this is the sign of weakness, when market can’t complete AB-CD target. It has approximately the same meaning as market can’t reach the border of triangle and turns in opposite direction.
Anyway if even gold will form 1.618 AB-CD up, it will remain below 1308. This will be second barier, and currently it is very difficult to say whether gold will be able to pass through them.
At the same time here we get the clue. We know that retracement will be just till 1298 area, hence any action above it will not be retracement any more. Thus, around this level we will understand whether long-term picture has changed or not.
Meantime, as you can see even 1.618 AB=CD will not destroy butterfly shape and keep valid long-term bearish scenario. That’s why current action is nice and probably tradable on lower charts but here as well as on monthly it does not change situation yet.
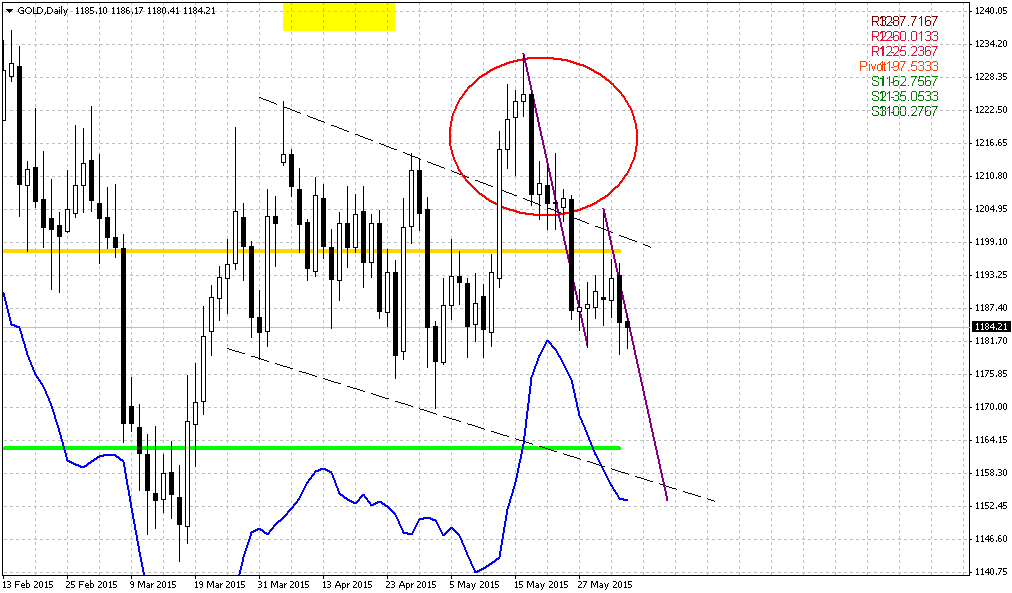
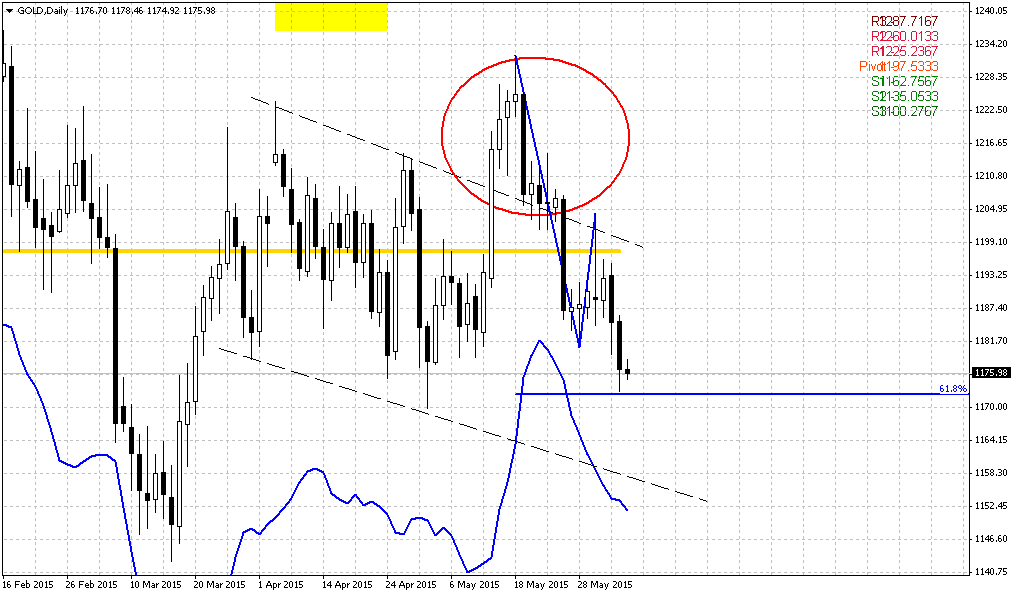
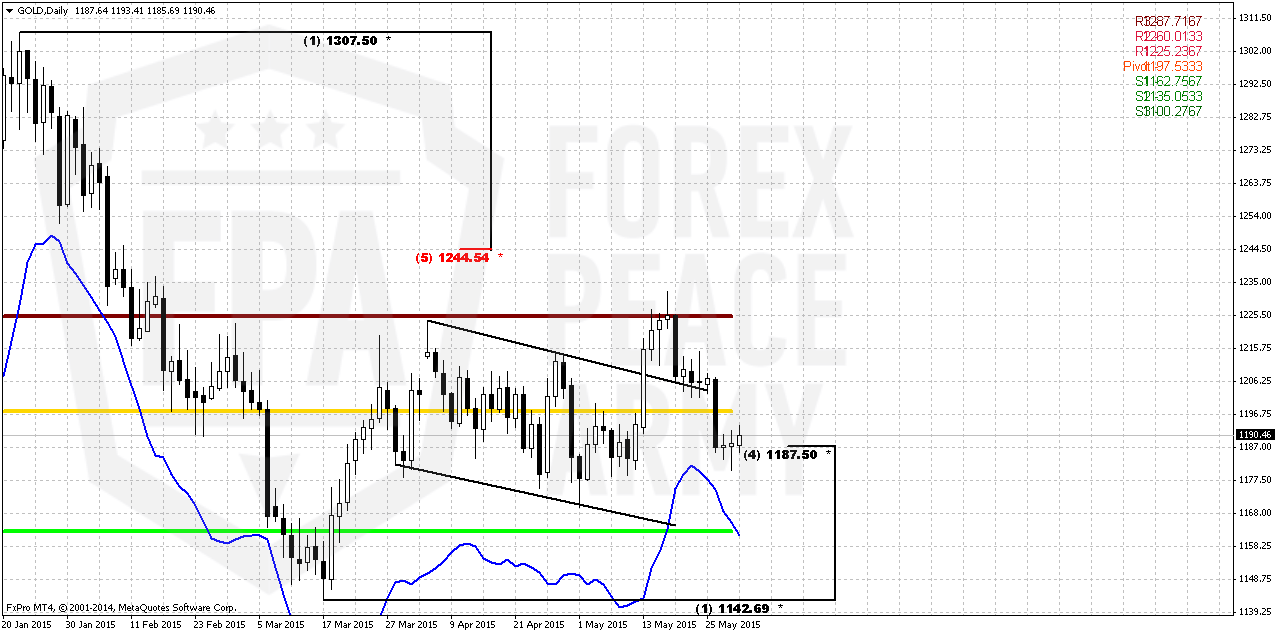
Daily
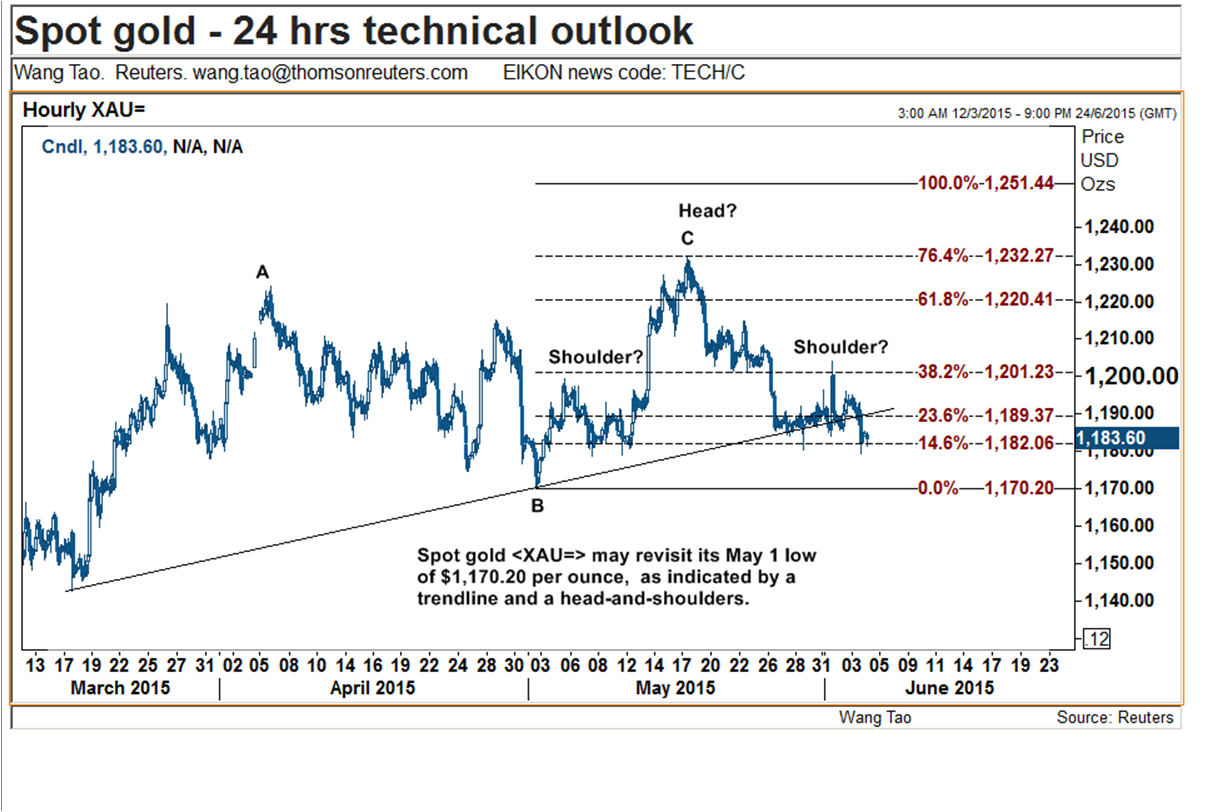
Trend is bearish here. As you can see market stands flat within recent 3 days and right now we just can repeat thoughts that already have been said. As market has formed consolidation and tried to break out of it, any return back will have opposite direction. It means that failure upside breakout of the flag and price returning inside of it should be treated as bearish sign. According to classic technical analysis in such situations market at least shows action to opposite border of the pattern and very often passes 2 times distance after breakout in opposite side.
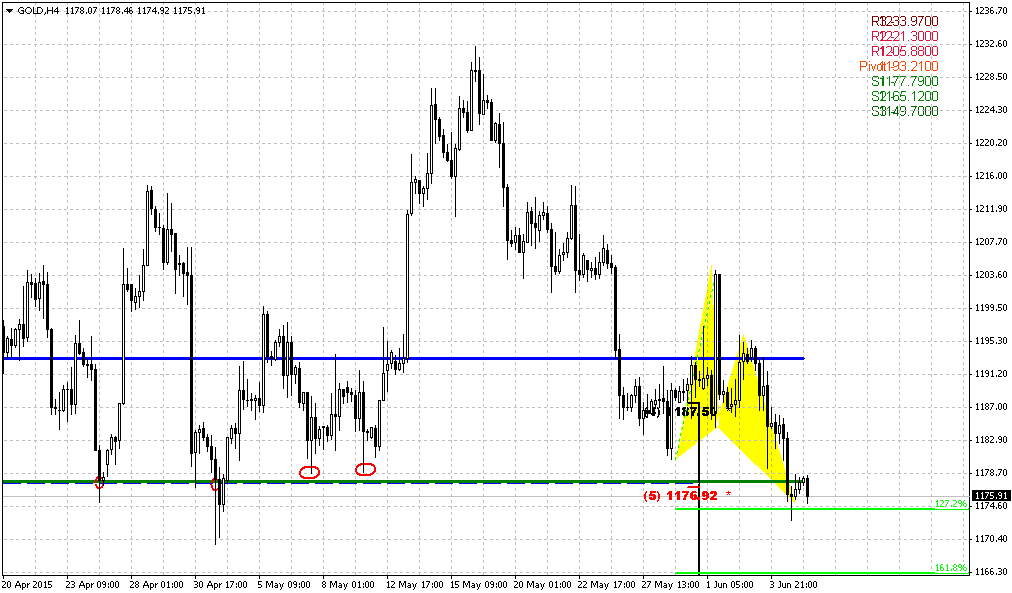
Thus, taking in consideration all issues that we’ve discussed above – CFTC, bearish patterns it seems that currently it is difficult to find any reasons for going long here, except may be very short-term scalp trading. Still, we can’t exclude that market could turn to some fluctuations due expectation of important NFP data and Fed meeting later in the month. During this coiling market probably will test new June Pivot point @ 1197.
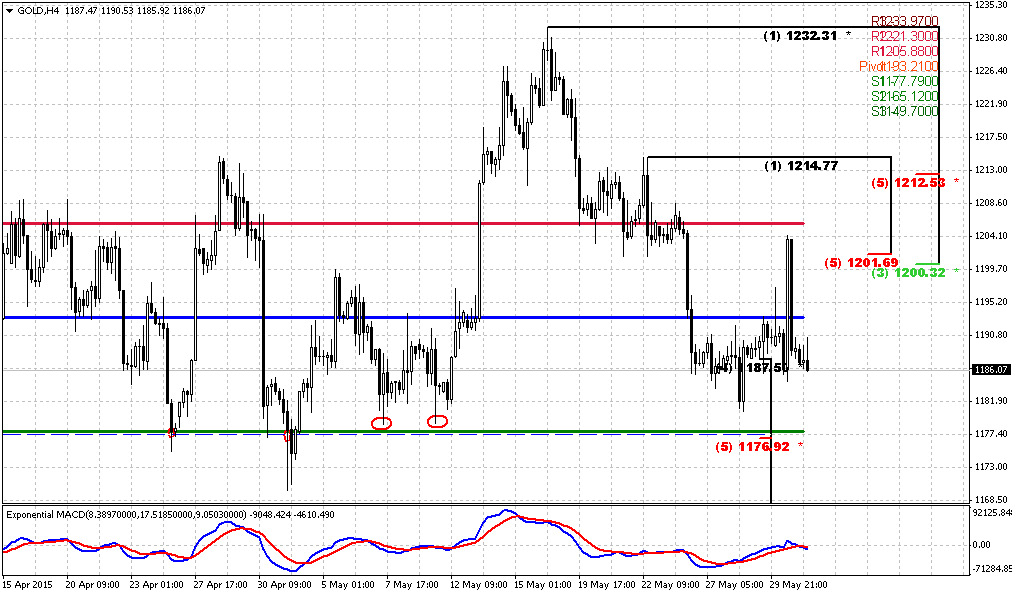
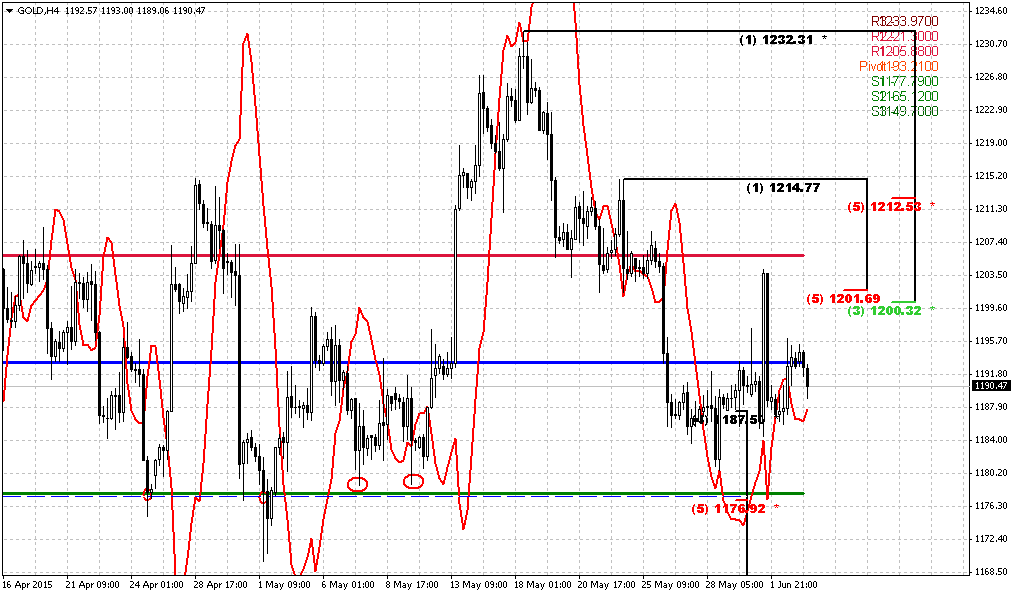
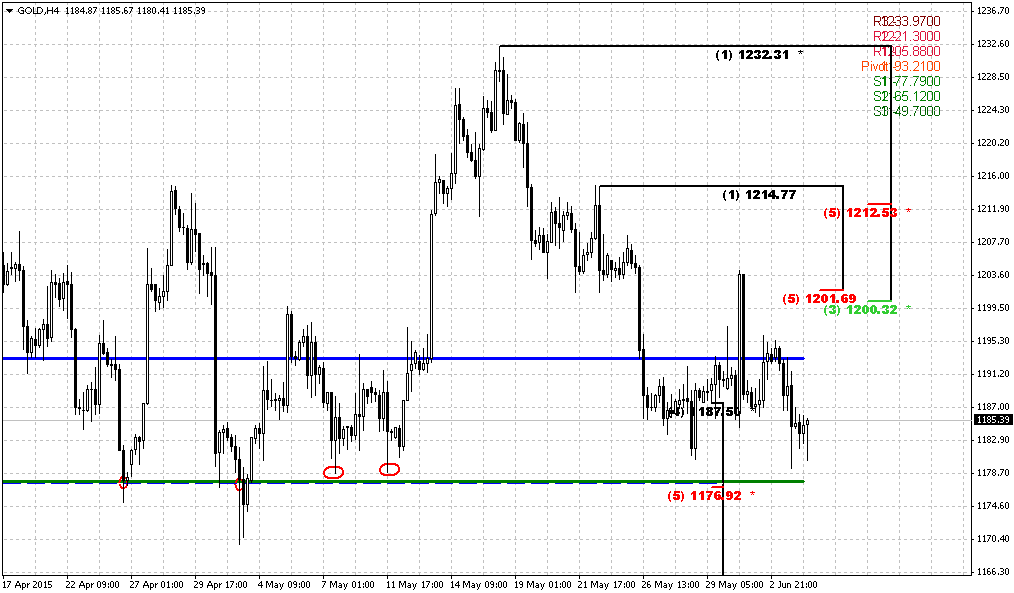
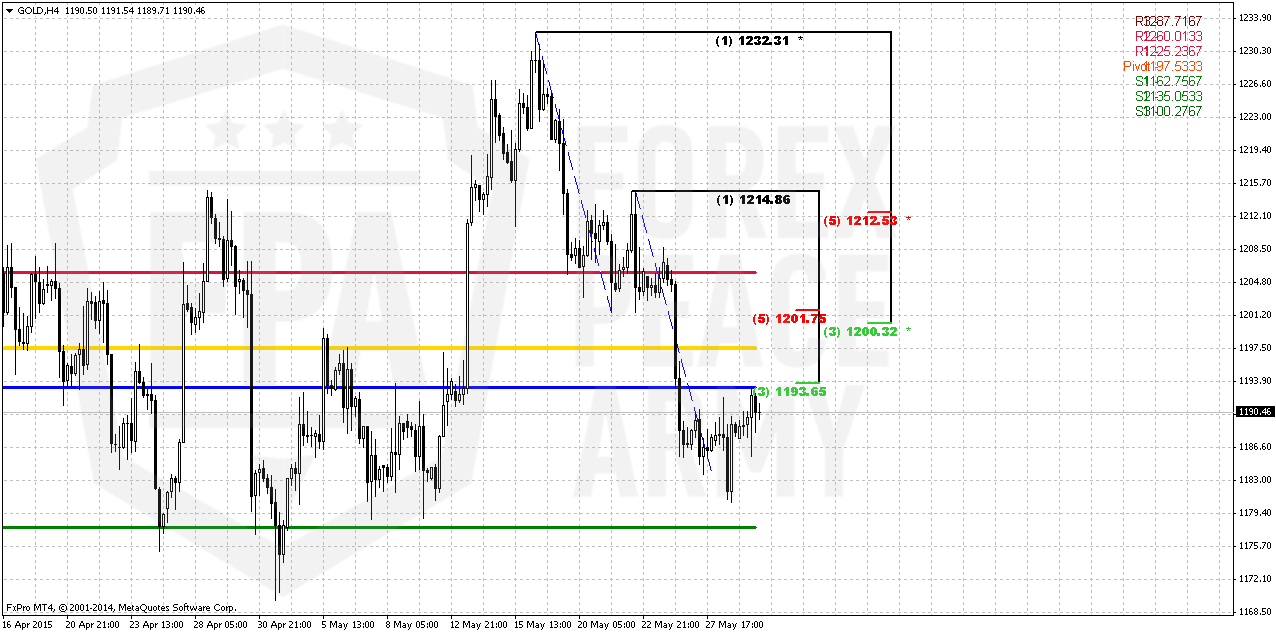
4-hour
Trend is bullish here. Gold has completed steep AB-CD pattern by forming nicely looking bullish engulfing pattern. As we probably will have some news vacuum (except Greece may be), gold could turn to short-term upside retracement. As we’ve estimated on Friday, the most probable target of it stands around 1195 area that is very close to new MPP and K-resistance around 1200. Theoretically market should not go higher if nothing drastical will happen. If you will take a look at hourly chart as well, you’ll see that price action itself has no signs of thrust, very choppy and mostly corresponds to retracement action.
Conclusion:
Long-term picture remains bearish and major patterns stand mostly intact.
On short-term charts market gold stands at support. As important data will come only at the end of the week, market could get some freedom and turn to wider fluctuations. As result, we can’t exclude possibility of reaching MPP and 1200 K-resistance area. Theoretically market should not go higher if nothing drastical will happen.
The technical portion of Sive's analysis owes a great deal to Joe DiNapoli's methods, and uses a number of Joe's proprietary indicators. Please note that Sive's analysis is his own view of the market and is not endorsed by Joe DiNapoli or any related companies.
Weekly Gold Tading Report prepared by Sive Morten exclusively for ForexPeaceArmy.com
Reuters reports Gold edged up on Friday from the previous day's 2-1/2-week low, supported by a softer dollar and uncertainty over Greece's debt talks, but remained under pressure from expectations U.S. interest rates might rise soon.
The prospect of higher rates, which would boost the opportunity cost of holding non-yielding gold while lifting the dollar, kept the metal on track for a second weekly drop.
"The gold market will eventually have to discount the fact that the Fed is not going to put through a series of rate hikes, one after the other, but will rather just put in one in and wait," said Edward Meir, INTL FCStone analyst.
"If it does that, I think the market should respond by moving a bit higher. In the meantime, we're in this drift doing nothing."
The greenback's weakness came after rallying nearly 3 percent after Federal Reserve Chair Janet Yellen said last week that the U.S. central bank was on track to raise rates later this year.
"The recent surge in the dollar, which pushed crude oil prices lower, has put pressure on gold," ING commodities analyst Hamza Khan said.
There were mixed signals this week on the outcome of talks over Greece's debt, without which Athens risks default or bankruptcy in weeks.
Greek government spokesman said on Thursday that it intended to agree a cash-for-reforms deal by Sunday. Euro zone officials suggested, though, that a deal was far from imminent, and the head of the International Monetary Fund was quoted as saying Greece could fall out of the euro zone.
"While gold hasn't gained much of an upside (from the uncertainty over Greece) ... it hasn't seen much of a downside, given the resurgence of the dollar," Standard Chartered's global head of commodities research Paul Horsnall said.
Dealers noted quiet gold trading overnight in Asia, the metal's main physical markets, where premiums in major trading centers failed to rise this week despite the price drop.
Our suspicions on upside jump in CFTC data have been confirmed. Last week COT report shows huge drop in open interest and net long position. At the same time, speculative shorts are up for 7K. Hedgers also show massive out from gold, but more shorts were closed. As hedgers take counter-trend position, it means that they assess upside reversal as not very probable right now.
SPDR fund has not shown any strong outflow, storages are down just for 3 tonnes to 715 tonnes of gold, this is not very significant weekly drop. Still, this is definitely not an increasing of position and in general confirms dynamic of COT report. This is warning for us that any long position right now will be under pressure, fragile and carries great risk.
Monthly
Last week shows no impact on monthly chart. Gold stands rather flat on monthly chart within second month in a row. But between April standing and May standing is big difference. In May investors are coming to action, at least, CFTC data shows the signs of it, while in April CFTC was absolutely anemic and market was driven by technical and news flows. So, this lets us hope that we will see some acceleration soon
Whether recent jump has harmed any of our long-term patterns? Not yet. As bearish dynamic pressure as VOB pattern are still valid.
On long-term horizon we still have last big pattern in progress that is Volatility breakout (VOB). It suggests at least 0.618 AB-CD down. And this target is 1050$. At the same time we need 1130 breakout to start clearly speak on 1050 target.
But what action market should show to break huge bearish patterns on monthly? Dynamic pressure is a tendency of lower highs within bullish trend. Hence, to break it, market should show higher high. I’ve marked it with arrow. It means that market should take out 1308 top to break this pattern and make investors doubt on bearish perspectives of gold market in long term. That’s why action that we have on daily and intraday charts right now is not an action of monthly one yet. Early bell of changing situation could be moving above YPP.
Overall picture still remains mostly bearish. In the beginning of the year market showed solid upside action. Gold was able to exceed yearly pivot, passed half way to Yearly Pivot resistance 1 but right now has reversed down and closed below YPP. From technical point of view this is bearish sign. This could be very significant moment and next logical destination will be yearly pivot support 1 around 1083$.
Currently, despite rare upside splashes in CFTC data, we couldn’t say yet that situation has changed drastically. We need to get few weeks of net long position increasing, to get positive dynamic on SPDR storages to get confidence with upside action. Other words, we need to get some proves that recent changes is not occasion, as it has happened recently.
Still right now gold mostly is hostage of dollar value and US economical data (mostly inflation) in nearest perspective. Approximately the same was announced by Fed in forecast on inflation and had become a reason of dovish approach to rate hiking. Another concern right now is too strong dollar that becomes a problem per se for economy growth and kills inflation. Prices are fallen so no needs to hike rates. So, after positive CPI report investors will wait for June Fed meeting and NFP on coming week.
If we will take into consideration geopolitical situation and risks that have appeared recently, it could happen that situation will change, especially if situation in Ukraine will escalate and peaceful regulation will fail. Day by day we see worrying geopolitical news – Macedonia, Yemen to name some. Unfortunately the geopolicy is sphere where we can’t do much.
That’s being said, as gold has passed through 1200 and until it stands below 1308 top, our long-term next destination point is previous lows at 1130, but since gold is returning to 1130 for second time – this is temporal destination and we should prepare for further downward action. Current upside action we should treat as retracement, although it could be really significant on lower time frames.
Weekly
Right now trend on weekly chart has shifted bullish, grabbers were vanished, but is it really shift long-term view on weekly chart? Although trend has turned bullish three weeks ago, market does not show any upside acceleration, mostly stands flat and even decreasing in last two weeks. Such action easily could take the shape of bearish dynamic pressure.
Recently market has passed through long-term natural support/resitsance level (marked with circles) but last week has returned right back down. Market has not even completed AB-CD pattern with destination point will be around 1230-1250 level. In general, this is the sign of weakness, when market can’t complete AB-CD target. It has approximately the same meaning as market can’t reach the border of triangle and turns in opposite direction.
Anyway if even gold will form 1.618 AB-CD up, it will remain below 1308. This will be second barier, and currently it is very difficult to say whether gold will be able to pass through them.
At the same time here we get the clue. We know that retracement will be just till 1298 area, hence any action above it will not be retracement any more. Thus, around this level we will understand whether long-term picture has changed or not.
Meantime, as you can see even 1.618 AB=CD will not destroy butterfly shape and keep valid long-term bearish scenario. That’s why current action is nice and probably tradable on lower charts but here as well as on monthly it does not change situation yet.
Daily
Trend is bearish here. As you can see market stands flat within recent 3 days and right now we just can repeat thoughts that already have been said. As market has formed consolidation and tried to break out of it, any return back will have opposite direction. It means that failure upside breakout of the flag and price returning inside of it should be treated as bearish sign. According to classic technical analysis in such situations market at least shows action to opposite border of the pattern and very often passes 2 times distance after breakout in opposite side.
Thus, taking in consideration all issues that we’ve discussed above – CFTC, bearish patterns it seems that currently it is difficult to find any reasons for going long here, except may be very short-term scalp trading. Still, we can’t exclude that market could turn to some fluctuations due expectation of important NFP data and Fed meeting later in the month. During this coiling market probably will test new June Pivot point @ 1197.
4-hour
Trend is bullish here. Gold has completed steep AB-CD pattern by forming nicely looking bullish engulfing pattern. As we probably will have some news vacuum (except Greece may be), gold could turn to short-term upside retracement. As we’ve estimated on Friday, the most probable target of it stands around 1195 area that is very close to new MPP and K-resistance around 1200. Theoretically market should not go higher if nothing drastical will happen. If you will take a look at hourly chart as well, you’ll see that price action itself has no signs of thrust, very choppy and mostly corresponds to retracement action.
Conclusion:
Long-term picture remains bearish and major patterns stand mostly intact.
On short-term charts market gold stands at support. As important data will come only at the end of the week, market could get some freedom and turn to wider fluctuations. As result, we can’t exclude possibility of reaching MPP and 1200 K-resistance area. Theoretically market should not go higher if nothing drastical will happen.
The technical portion of Sive's analysis owes a great deal to Joe DiNapoli's methods, and uses a number of Joe's proprietary indicators. Please note that Sive's analysis is his own view of the market and is not endorsed by Joe DiNapoli or any related companies.