Sive Morten
Special Consultant to the FPA
- Messages
- 18,664
Fundamentals
Gold is driven mostly by the same factors - tariffs tensions and expected change in Fed policy that we could see as soon as on July meeting. Tariffs tensions have got minor relief as Mexico agrees on cooperation on stopping of migrants' flow - D. Trump stops launching of tariffs on Mexico export, at least for awhile.
As tariffs topic is mature, market needs something else to support demand and push gold higher, and this could be Fed. At the same time some more news could come from UK and EU where big political changes stand right around the corner.
In general, we keep our long term view that we've announced last year - gold stands in a starting point of new long-term bull trend. Ripening of big political tensions that starts coming on surface and this process will develop more. In rapidly changing situation countries turn to tough competition trying to improve position on global political arena. This process is a very good background for gold market. 2020 - 2021 is a years of big uncertainty due US and Russia president elections (autumn 2020 and spring 2021 correspondingly). Countries start preparation for this, as it could be big shake for global order. Now different Central Banks buying gold at all time high level. But we explain our conception and long-term view many times already.
In shorter-term perspective, Gold prices jumped 1% on Friday to their highest levels since April 2018 as a sharp slowdown in U.S. jobs growth sent the dollar lower on growing expectations that the Federal Reserve would cut interest rates this year.
Gold also has benefited from concerns that U.S. trade wars with Mexico and China will slow the global economy. The precious metal is up more than 2.5% so far this week.
The U.S. Labor Department reported on Friday that job growth slowed sharply in May and wages rose less than expected.
"The U.S. jobs number was weaker than expected and that rallied the gold market. That gives the bulls more technical momentum," said Jim Wyckoff, senior analyst at Kitco.
Chances "have significantly increased that the U.S. Federal Reserve is going to lower interest rates sooner rather than later and that is also working in favor of the precious metals bulls," Wyckoff said.
Traders of U.S. short-term interest rate futures added to bets that the Fed will start to cut rates as soon as July and reduce them two more times before the end of the year. Lower interest rates boost gold by reducing the opportunity cost of holding the metal and by weakening the dollar, which skidded to its lowest in 2-1/2 months after the U.S. jobs data.
The United States granted Chinese exporters two more weeks to get their products into the U.S. before increasing tariffs on those items, according to a U.S. government notice posted online.
"On China side this going to be a protracted trade war ... The resulting loss of economic momentum could push more investor allocations into gold and that would be the primary factor driving prices north of $1,350 (in the medium term)," said Daniel Ghali, commodity strategist at TD Securities.
President Donald Trump said on Friday there was a "good chance" that the United States would be able to reach a deal with Mexico over a surge of migrants on their border, although his administration was still pushing ahead with a plan to slap import tariffs on all Mexican goods next week.
Yesterday, in our FX report we talked in details on US statistics. We have more balanced position as data stands not as bad as it was introduced in media. Thus common expectation of USD weakness has to be tested by two major moments - IIQ GDP data and July Fed statement. Indeed, if as Fed as GDP will confirm slowdown of US economy - expectation of USD weakness will become more reasonable than now.
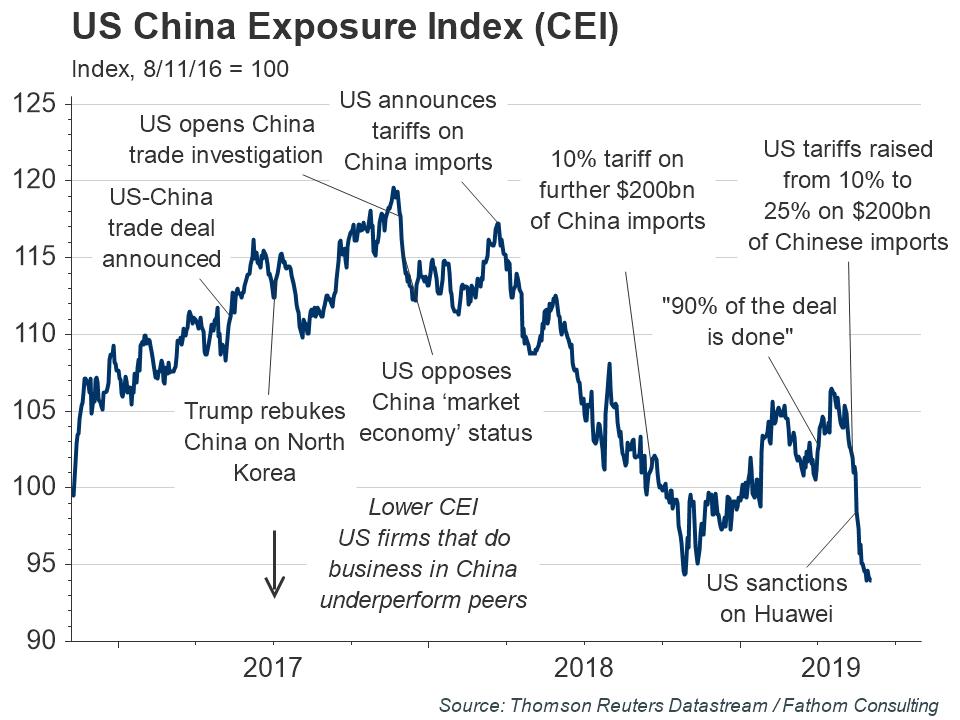
At the same time, Fathom consulting shows that China-depended US companies have been hurt by the tariffs, and situation yet to become worse:
Fathom’s proprietary China Exposure Index (CEI) measures the performance of US-listed firms that do business in China, relative to that of their peers. It has fallen sharply amid escalating trade tensions between the US and China. Hopes of a breakthrough in the long-running trade dispute had pushed the index to an eight-month high on 17 April before talks stalled and a new round of tit-for-tat measures was imposed. Firms in the CEI derive between 15% and 85% of their revenues from China, which are now worth less in US dollars given the recent weakening of the renminbi. The earnings of these firms are also vulnerable to sanctions, tariffs and a general slowdown in Chinese economic activity — on balance, they have now underperformed their US-listed peers since the election of Donald Trump in 2016
It means that US companies already start to feel the impact of the tariffs and gold takes correct trend, probably. CFTC data also confirms this, as net positions turns from dead point and shows almost 2 times increasing last week:

Source:cftc.gov
Charting by Investing.com
This lets us to make conclusion that positive sentiment on gold market is stable enough to support further upside action in short-term perspective.
Technical
Monthly
Technically, gold also shows good performance, keeping our long term view valid. Our fundamental and sentiment analysis shows that no big changes have happened and gold still stands positive. We happy with recent performance as gold was able to hold above YPP and turns up. Our first meaningful resistance here is 1377-1380 - major Fib level and YPR1. If we are correct on first stage of new bull trend - market should break this level up. Previously we already have mentioned MACD hidden divergence which suggests action above 1380 top in long-term perspective.
As we've said earlier, we're watching for our so called "symmetrical" model. It could be clear symmetry in market action, and we have suggested that future action could be a reflection of previous downside action shape. It could be described as "compound H&S pattern".
Gold has shown good performance in December - February, which could put the foundation of new long-term upside trend. We still keep our harmonic technical model on monthly chart as primary tool of analysis. Current retracement down looks strong on daily chart, but it is just 30% of major swing up which is minimal level.
Fundamental reasons for gold rising mostly relate to changing of global political and economical situation. Strong global shifts never could happen without big political events. This should provide big support to gold market. Now it is widely suggested that these processes should accelerate closer to 2020 year, or even in second half of 2019. Right now we see that it also has impact on economy.
Here is explanation of our "symmetrical" model and scenario.In two words we could describe it as "compounded reverse H&S" shape. Important COP target has been hit and upside action has started. In fact we have mirror action to the right and to the left from COP point. Market forms approximately equal lows on both sides. The speed is also similar. Is it possible that reversal is forming? Why not.
Thus, overall situation on monthly chart shows bullish sentiment.

Weekly
Weekly trend also has turned bullish last week. Overall price action shows bullish sentiment. Starting from November 2015 market shows higher lows, but with the same top around 1375-1385 area. It means that bearish power, that push gold lower out from this resistance becomes weaker and weaker every time.
Here we could estimate a lot of different upside targets, but all of them stand rather far. For instance, recent price action could give us upside butterfly pattern. But right now we need to focus on minor COP of most recent AB-CD pattern, which stands at 1382. It creates Agreement resistance with monthly 1377-1380 level.
Second - market hits overbought on weekly chart. This is serious issue that should hold our bullish outburst. Patience comes at first stage as we need to wait for retracement. Long position taking around this top could be very costly to our account.

Daily
So Friday's setup was done perfect - intraday triangle was broken up and upside action stopped accurately at daily Overbought of 1344...
Now, on daily chart market also overextended and stands at overbought and we have W&R of previous top. It is unclear a bit whether W&R stands due overbought, or it was real W&R. Anyway - OB as on weekly as on daily is a serious context to sit on the hands and wait for retracement.
Initially we could consider 1320 level. Also, I suggest that we also could keep an eye on B&B here. Although thrust is just 7 bars up, but the speed the length of the daily candles look impressive and suitable for DiNapoli setups.

Intraday
Here is our pennant that we've traded on Friday. As a result market has formed upside 1.27 butterfly. Now we have bearish grabber on top. Chances that gold will proceed to 1.618 1354 target are not very significant. Don't forget that on Monday market should react on Mexico tariffs relief.
If price will drop below the pennant - it means that retracement is underway. Conversely, (although it is not very probable), gold could proceed to 1354 first to complete 1.618 butterfly target. Anyway, our suggestion that this is not the moment for new long position. It is better to be dead serious with weekly overbought. It is very often leads market to daily oversold on retracement. May be we will not get as deep retracement here, but, anyway, this is strong technical driving factor.

Conclusion
No doubts, gold keeps positive mood, shows great upside impulse and fundamental background for continuation. At the same time we see market technically overextended as on daily as on weekly chart and it needs relief- some technical pullback. So, we suggest that it is not very good point for taking new long position by far.
The technical portion of Sive's analysis owes a great deal to Joe DiNapoli's methods, and uses a number of Joe's proprietary indicators. Please note that Sive's analysis is his own view of the market and is not endorsed by Joe DiNapoli or any related companies.
Gold is driven mostly by the same factors - tariffs tensions and expected change in Fed policy that we could see as soon as on July meeting. Tariffs tensions have got minor relief as Mexico agrees on cooperation on stopping of migrants' flow - D. Trump stops launching of tariffs on Mexico export, at least for awhile.
As tariffs topic is mature, market needs something else to support demand and push gold higher, and this could be Fed. At the same time some more news could come from UK and EU where big political changes stand right around the corner.
In general, we keep our long term view that we've announced last year - gold stands in a starting point of new long-term bull trend. Ripening of big political tensions that starts coming on surface and this process will develop more. In rapidly changing situation countries turn to tough competition trying to improve position on global political arena. This process is a very good background for gold market. 2020 - 2021 is a years of big uncertainty due US and Russia president elections (autumn 2020 and spring 2021 correspondingly). Countries start preparation for this, as it could be big shake for global order. Now different Central Banks buying gold at all time high level. But we explain our conception and long-term view many times already.
In shorter-term perspective, Gold prices jumped 1% on Friday to their highest levels since April 2018 as a sharp slowdown in U.S. jobs growth sent the dollar lower on growing expectations that the Federal Reserve would cut interest rates this year.
Gold also has benefited from concerns that U.S. trade wars with Mexico and China will slow the global economy. The precious metal is up more than 2.5% so far this week.
The U.S. Labor Department reported on Friday that job growth slowed sharply in May and wages rose less than expected.
"The U.S. jobs number was weaker than expected and that rallied the gold market. That gives the bulls more technical momentum," said Jim Wyckoff, senior analyst at Kitco.
Chances "have significantly increased that the U.S. Federal Reserve is going to lower interest rates sooner rather than later and that is also working in favor of the precious metals bulls," Wyckoff said.
Traders of U.S. short-term interest rate futures added to bets that the Fed will start to cut rates as soon as July and reduce them two more times before the end of the year. Lower interest rates boost gold by reducing the opportunity cost of holding the metal and by weakening the dollar, which skidded to its lowest in 2-1/2 months after the U.S. jobs data.
The United States granted Chinese exporters two more weeks to get their products into the U.S. before increasing tariffs on those items, according to a U.S. government notice posted online.
"On China side this going to be a protracted trade war ... The resulting loss of economic momentum could push more investor allocations into gold and that would be the primary factor driving prices north of $1,350 (in the medium term)," said Daniel Ghali, commodity strategist at TD Securities.
President Donald Trump said on Friday there was a "good chance" that the United States would be able to reach a deal with Mexico over a surge of migrants on their border, although his administration was still pushing ahead with a plan to slap import tariffs on all Mexican goods next week.
Yesterday, in our FX report we talked in details on US statistics. We have more balanced position as data stands not as bad as it was introduced in media. Thus common expectation of USD weakness has to be tested by two major moments - IIQ GDP data and July Fed statement. Indeed, if as Fed as GDP will confirm slowdown of US economy - expectation of USD weakness will become more reasonable than now.
At the same time, Fathom consulting shows that China-depended US companies have been hurt by the tariffs, and situation yet to become worse:
Fathom’s proprietary China Exposure Index (CEI) measures the performance of US-listed firms that do business in China, relative to that of their peers. It has fallen sharply amid escalating trade tensions between the US and China. Hopes of a breakthrough in the long-running trade dispute had pushed the index to an eight-month high on 17 April before talks stalled and a new round of tit-for-tat measures was imposed. Firms in the CEI derive between 15% and 85% of their revenues from China, which are now worth less in US dollars given the recent weakening of the renminbi. The earnings of these firms are also vulnerable to sanctions, tariffs and a general slowdown in Chinese economic activity — on balance, they have now underperformed their US-listed peers since the election of Donald Trump in 2016
It means that US companies already start to feel the impact of the tariffs and gold takes correct trend, probably. CFTC data also confirms this, as net positions turns from dead point and shows almost 2 times increasing last week:
Source:cftc.gov
Charting by Investing.com
This lets us to make conclusion that positive sentiment on gold market is stable enough to support further upside action in short-term perspective.
Technical
Monthly
Technically, gold also shows good performance, keeping our long term view valid. Our fundamental and sentiment analysis shows that no big changes have happened and gold still stands positive. We happy with recent performance as gold was able to hold above YPP and turns up. Our first meaningful resistance here is 1377-1380 - major Fib level and YPR1. If we are correct on first stage of new bull trend - market should break this level up. Previously we already have mentioned MACD hidden divergence which suggests action above 1380 top in long-term perspective.
As we've said earlier, we're watching for our so called "symmetrical" model. It could be clear symmetry in market action, and we have suggested that future action could be a reflection of previous downside action shape. It could be described as "compound H&S pattern".
Gold has shown good performance in December - February, which could put the foundation of new long-term upside trend. We still keep our harmonic technical model on monthly chart as primary tool of analysis. Current retracement down looks strong on daily chart, but it is just 30% of major swing up which is minimal level.
Fundamental reasons for gold rising mostly relate to changing of global political and economical situation. Strong global shifts never could happen without big political events. This should provide big support to gold market. Now it is widely suggested that these processes should accelerate closer to 2020 year, or even in second half of 2019. Right now we see that it also has impact on economy.
Here is explanation of our "symmetrical" model and scenario.In two words we could describe it as "compounded reverse H&S" shape. Important COP target has been hit and upside action has started. In fact we have mirror action to the right and to the left from COP point. Market forms approximately equal lows on both sides. The speed is also similar. Is it possible that reversal is forming? Why not.
Thus, overall situation on monthly chart shows bullish sentiment.
Weekly
Weekly trend also has turned bullish last week. Overall price action shows bullish sentiment. Starting from November 2015 market shows higher lows, but with the same top around 1375-1385 area. It means that bearish power, that push gold lower out from this resistance becomes weaker and weaker every time.
Here we could estimate a lot of different upside targets, but all of them stand rather far. For instance, recent price action could give us upside butterfly pattern. But right now we need to focus on minor COP of most recent AB-CD pattern, which stands at 1382. It creates Agreement resistance with monthly 1377-1380 level.
Second - market hits overbought on weekly chart. This is serious issue that should hold our bullish outburst. Patience comes at first stage as we need to wait for retracement. Long position taking around this top could be very costly to our account.
Daily
So Friday's setup was done perfect - intraday triangle was broken up and upside action stopped accurately at daily Overbought of 1344...
Now, on daily chart market also overextended and stands at overbought and we have W&R of previous top. It is unclear a bit whether W&R stands due overbought, or it was real W&R. Anyway - OB as on weekly as on daily is a serious context to sit on the hands and wait for retracement.
Initially we could consider 1320 level. Also, I suggest that we also could keep an eye on B&B here. Although thrust is just 7 bars up, but the speed the length of the daily candles look impressive and suitable for DiNapoli setups.
Intraday
Here is our pennant that we've traded on Friday. As a result market has formed upside 1.27 butterfly. Now we have bearish grabber on top. Chances that gold will proceed to 1.618 1354 target are not very significant. Don't forget that on Monday market should react on Mexico tariffs relief.
If price will drop below the pennant - it means that retracement is underway. Conversely, (although it is not very probable), gold could proceed to 1354 first to complete 1.618 butterfly target. Anyway, our suggestion that this is not the moment for new long position. It is better to be dead serious with weekly overbought. It is very often leads market to daily oversold on retracement. May be we will not get as deep retracement here, but, anyway, this is strong technical driving factor.
Conclusion
No doubts, gold keeps positive mood, shows great upside impulse and fundamental background for continuation. At the same time we see market technically overextended as on daily as on weekly chart and it needs relief- some technical pullback. So, we suggest that it is not very good point for taking new long position by far.
The technical portion of Sive's analysis owes a great deal to Joe DiNapoli's methods, and uses a number of Joe's proprietary indicators. Please note that Sive's analysis is his own view of the market and is not endorsed by Joe DiNapoli or any related companies.