Sive Morten
Special Consultant to the FPA
- Messages
- 18,660
Fundamentals
Gold market shows outstanding performance as different driving factors support the rally from all sides. We can't say that this is absolutely unexpected for us, as we've talked about bullish long-term trend since the beginning of the year, but for truth sake we expect not as explosive action as we have, especially in the beginning of the trend. It is difficult to catch the proper moment for position taking now, but this is tactical question, I'm sure that this will get it and not once probably.
Yesterday we've expressed our opinion on one of the major driving factors - Fed policy. And make the suggestion that Fed tries to keep on rate hiking cycle but needs to disguise its action as markets strongly watch for recession and negative events in US economy. This explains Fed fluctuations in their statements.
As Reuters reports - Gold prices surpassed $1,400 on Friday before retreating, still holding near a six-year high on the U.S. central bank’s dovish stance on monetary policy.
Prices also found support from worries about a potential U.S. military strike against Iran and a global trade conflict.
Prices surged to $1,410.78 in the session, a high not seen since early September 2013, and were set to mark their best week in over three-years.
Bullion rates have jumped more than 5% since the U.S. Federal Reserve on Wednesday hinted interest rate cuts were possible later this year, as it responded to increased economic uncertainty and tepid inflation.
“Gold is seeing a continuation move from bullish comments throughout the week, most notably the fact that world central banks easing monetary policy is generally very supportive for commodities overall, particularly gold,” said David Meger, director of metals trading at High Ridge Futures.
Middle East tensions have supported the gold market, while the U.S.-China trade war continues to concern investors, he added.
After initially approving military strikes against Iran in retaliation for the downing of an unmanned surveillance drone, U.S. President Donald Trump pulled back from launching the attacks.
Gold is often considered a safe haven in times of political and economic uncertainty.
U.S.-China trade talks are set to resume ahead of a G20 meeting next week. Hopes for an agreement have grown somewhat, but neither side has signaled a shift from positions that led to an impasse last month.
Gold prices traded within a wide range of $28.78, retreating from the more than $1,400 level touched earlier in the day.
“The levels above $1,400 are near term resistance, so you would not be surprised to see the market consolidate around this psychological level,” High Ridge Futures’ Meger said.
The next Fed meeting is six weeks away and investors are digesting this week’s signal for a rate cut, analysts said, indicating there may be few bullish cues to lift bullion prices any higher for now.
“To sustain it (the bullish run in gold), you can’t go too quickly too fast,” said Ross Norman, chief executive at bullion dealer Sharps Pixley.
Yesterday we already talked about US - Iran tensions. Taking in consideration the whole situation in Middle East and force balance in region, I think that we could relax as nothing serious should happen. Some political piking probably holds in media for awhile, but definitely no hot stage will start. This is first relief factor for gold market.
CFTC data shows good pace of sentiment as investors have increased net long positions this week as well. At the same time it is sufficient room above till extreme long speculative position level, thus, gold has no limits from sentiment point of view yet.

Source cftc.gov
Charting by Investing.com
Finally, third major driving factor is tariffs piking. Yesterday we said that it is more theoretical harm to US economy rather than real one. Besides, few times we already said that tariffs is unique US tool, economical weapon. It doesn't work at the same degree in the hands of other countries, because it based on control of major world reserve currency - USD as it serves whole global trade. Situation is changing but very slow and USD still keeps 65% share as global reserve currency.
Fathom consulting also sees deterioration of Chinese economy. This fact tells that China has not much time to come to consensus with US, despite how strong they try to look like publicly. Here is some extractions from Fathom's China – falling into the same long-term rut as Japan? article:
Fathom’s measure of economic activity in China, the China Momentum Indicator (CMI), slowed to 4.9% in April, down from 5.1% in the twelve months to March, hitting a new two-and-a-half-year low. As highlighted in the chart, this has resulted in a widening of the gap between Fathom’s measure of growth and the official measure, which was a steady 6.4% in the first quarter of the year.
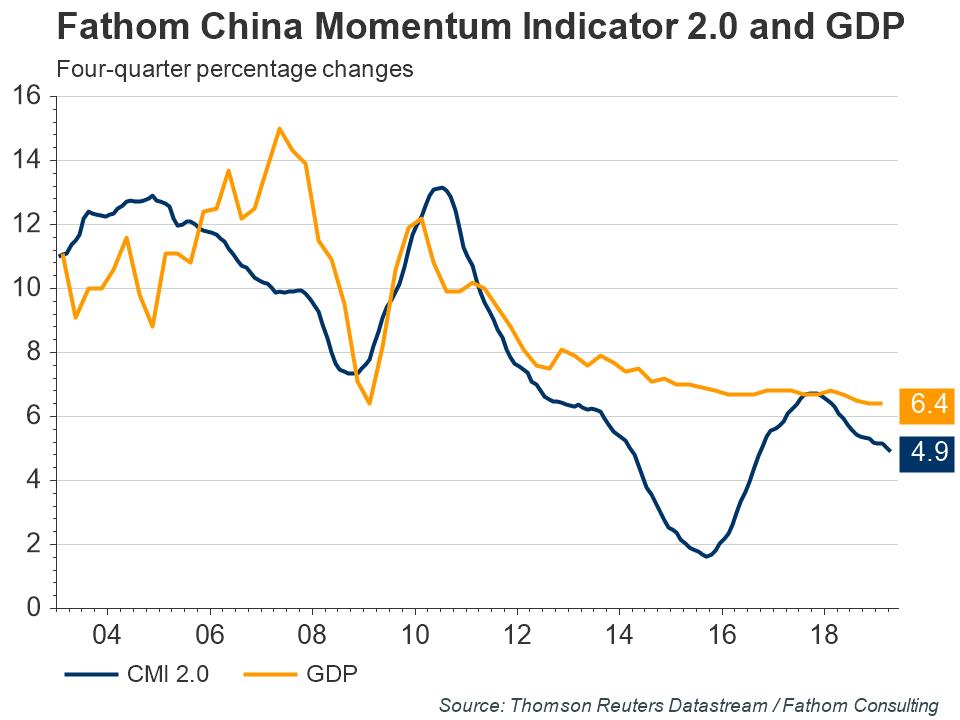
Based on Fathom’s measure, trend growth is lower than officially stated, as it has been since 2011, and that is despite financial conditions being looser than usual in China. Indeed, cuts to the reserve ratio requirement for banks, a go-to policy in times of economic weakness, have been harder and faster than at any point in recent history — including the financial crisis.
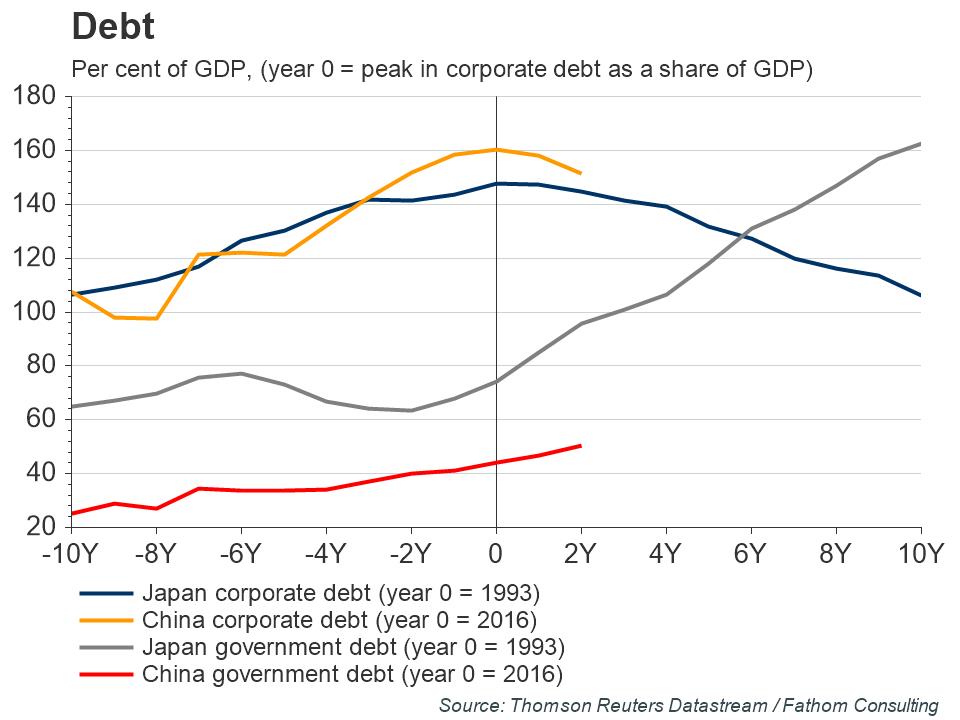
Even so, in an attempt to arrest the slowdown in underlying growth, China has resorted to its old tried-and-tested growth tactics of credit-fuelled investment. Problematically for Beijing, these efforts to cushion the economy will only exacerbate existing domestic and global imbalances.
Indeed, weaker trend growth is attributable in part to the astronomical expansion of credit observed in China in recent years, which has led to allocative mistakes at the macro level. That misallocation is evidenced by China’s non-performing loan problem, which, as Fathom detailed in a recent note to clients, is estimated to be a large and rising 28–38% of domestic GDP.
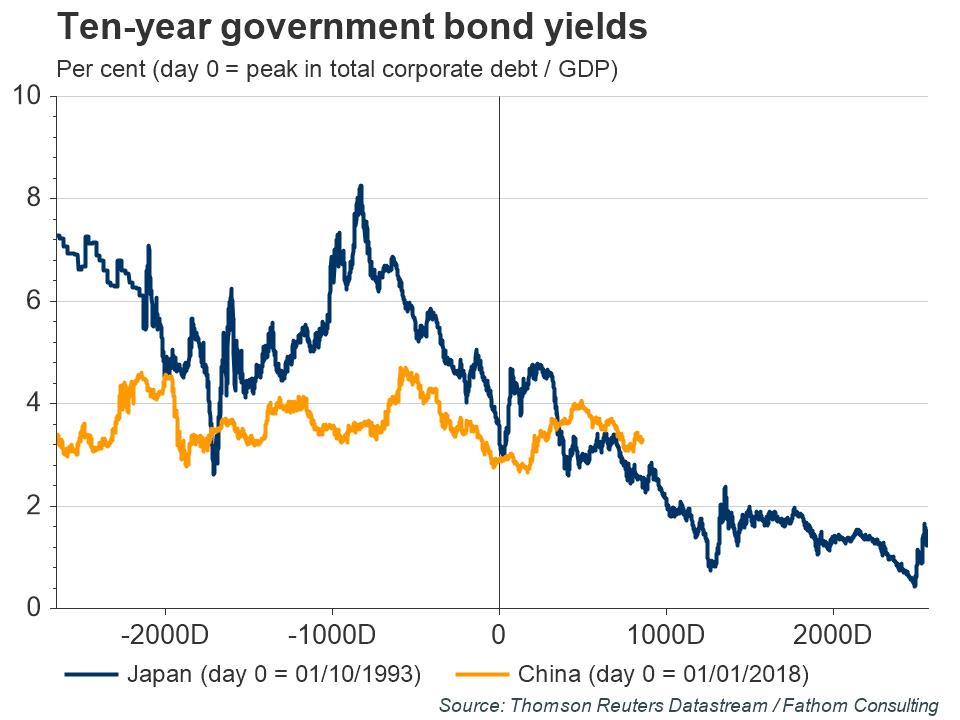
With China’s current policy mix suffering not only diminishing returns but allocative inefficiencies too, Fathom’s central scenario sees China falling into the same kind of long-term rut as Japan. In this world, despite the evergreening of bad loans and perennially low interest rates, China’s economy will slow to around 4% by 2021.
Taking its all together, with no doubts on new long-term bullish cycle on gold, it seems that time for moderate retracement is come, especially if we will be correct on Fed July meeting and rate will be kept with no change.
Technical
Monthly
This week we have significant changes on monthly chart. Market has broken through multiple important levels. They are major 3/8i Fib resistance, which also is a neckline of our extended H&S pattern and price exceeded YPR1. It is a bit early to talk on final breakout as gold market stands not too far from it, but if price will able to hold above it - this will be major confirmation of long-term bull trend on the market. Once price turns in area above Pivot Resistance 1 it stops to be retracement and becomes new trend.
Next target here is 1450 area. This is OP of our H&S, which also coincides with butterfly extension. Both targets stand below monthly OB level, so they could be hit in nearest future.
Our MACD hidden divergence which suggests action above 1380 top now is completed.
Fundamental reasons for gold rising mostly relate to changing of global political and economical situation. Strong global shifts never could happen without big political events. This should provide big support to gold market. Now it is widely suggested that these processes should accelerate closer to 2020 year, or even in second half of 2019. Right now we see that it also has impact on economy.
Thus we keep up with our "symmetrical" model of "compounded reverse H&S" shape. In fact we have mirror action to the right and to the left from the bottom. Market forms approximately equal lows on both sides. The speed is also similar. Is it possible that reversal is forming? Why not.
Thus, overall situation on monthly chart shows bullish sentiment. MACD trend stands bullish as well.

Weekly
On weekly chart we have the same patterns but of a smaller scale. Although weekly OP target coincides with the monthly one, butterfly has different extensions. 1.27 target stands around 1420. Other targets stand deep above OB level.
Despite how strong recent action looks, this is still the waiting time for us. Odds now stand not in favor of taking long position as market is deeply overbought here. By this reason, it is not too important for us where market will start retracement - either from 1420 or it will climb a bit higher. The only thing that is matter right now is retracement per se and its depth as it should provide us comfortable conditions for taking long position. Weekly K-area around 1320 looks like an area where setup for position taking could be formed.

Daily
Obviously that market is overextended on daily chart as well. Here price hits the local OP target as well. No signs of retracement yet and no patterns. Here we could consider two levels 1376 and K- area of 1355 where some trading setups could be formed. But nothing definite yet.

Intraday
We have mostly theoretical interest to intraday charts as we do not have any intention to trade gold market short right now and have an interest to them trying to identify retracement starting point. On 4H we have only bullish grabber pattern, that suggests at least another one swing up.
As we see on weekly chart, the butterfly there has 1420 target and it has not bee hit yet:

Hourly chart shows huge hidden bullish divergence with MACD. So, our scenario could look like here. Conversely - drop could start right at the opening on Monday. Gold follows existed driving factors two weeks in a row without any rest and they are mostly priced in already. As we have OB condition as on weekly as on daily charts - market position seems fragile, ready to drop at any time.

Conclusion
No doubts, gold keeps positive mood, shows great upside impulse and fundamental background for continuation. At the same time we see market technically overextended as on daily as on weekly chart and it needs relief- some technical pullback. So, we suggest that it is not very good point for taking new long position by far. As price is coming to important targets, retracement probably stands right around the corner.
The technical portion of Sive's analysis owes a great deal to Joe DiNapoli's methods, and uses a number of Joe's proprietary indicators. Please note that Sive's analysis is his own view of the market and is not endorsed by Joe DiNapoli or any related companies.
Gold market shows outstanding performance as different driving factors support the rally from all sides. We can't say that this is absolutely unexpected for us, as we've talked about bullish long-term trend since the beginning of the year, but for truth sake we expect not as explosive action as we have, especially in the beginning of the trend. It is difficult to catch the proper moment for position taking now, but this is tactical question, I'm sure that this will get it and not once probably.
Yesterday we've expressed our opinion on one of the major driving factors - Fed policy. And make the suggestion that Fed tries to keep on rate hiking cycle but needs to disguise its action as markets strongly watch for recession and negative events in US economy. This explains Fed fluctuations in their statements.
As Reuters reports - Gold prices surpassed $1,400 on Friday before retreating, still holding near a six-year high on the U.S. central bank’s dovish stance on monetary policy.
Prices also found support from worries about a potential U.S. military strike against Iran and a global trade conflict.
Prices surged to $1,410.78 in the session, a high not seen since early September 2013, and were set to mark their best week in over three-years.
Bullion rates have jumped more than 5% since the U.S. Federal Reserve on Wednesday hinted interest rate cuts were possible later this year, as it responded to increased economic uncertainty and tepid inflation.
“Gold is seeing a continuation move from bullish comments throughout the week, most notably the fact that world central banks easing monetary policy is generally very supportive for commodities overall, particularly gold,” said David Meger, director of metals trading at High Ridge Futures.
Middle East tensions have supported the gold market, while the U.S.-China trade war continues to concern investors, he added.
After initially approving military strikes against Iran in retaliation for the downing of an unmanned surveillance drone, U.S. President Donald Trump pulled back from launching the attacks.
Gold is often considered a safe haven in times of political and economic uncertainty.
U.S.-China trade talks are set to resume ahead of a G20 meeting next week. Hopes for an agreement have grown somewhat, but neither side has signaled a shift from positions that led to an impasse last month.
Gold prices traded within a wide range of $28.78, retreating from the more than $1,400 level touched earlier in the day.
“The levels above $1,400 are near term resistance, so you would not be surprised to see the market consolidate around this psychological level,” High Ridge Futures’ Meger said.
The next Fed meeting is six weeks away and investors are digesting this week’s signal for a rate cut, analysts said, indicating there may be few bullish cues to lift bullion prices any higher for now.
“To sustain it (the bullish run in gold), you can’t go too quickly too fast,” said Ross Norman, chief executive at bullion dealer Sharps Pixley.
Yesterday we already talked about US - Iran tensions. Taking in consideration the whole situation in Middle East and force balance in region, I think that we could relax as nothing serious should happen. Some political piking probably holds in media for awhile, but definitely no hot stage will start. This is first relief factor for gold market.
CFTC data shows good pace of sentiment as investors have increased net long positions this week as well. At the same time it is sufficient room above till extreme long speculative position level, thus, gold has no limits from sentiment point of view yet.
Source cftc.gov
Charting by Investing.com
Finally, third major driving factor is tariffs piking. Yesterday we said that it is more theoretical harm to US economy rather than real one. Besides, few times we already said that tariffs is unique US tool, economical weapon. It doesn't work at the same degree in the hands of other countries, because it based on control of major world reserve currency - USD as it serves whole global trade. Situation is changing but very slow and USD still keeps 65% share as global reserve currency.
Fathom consulting also sees deterioration of Chinese economy. This fact tells that China has not much time to come to consensus with US, despite how strong they try to look like publicly. Here is some extractions from Fathom's China – falling into the same long-term rut as Japan? article:
Fathom’s measure of economic activity in China, the China Momentum Indicator (CMI), slowed to 4.9% in April, down from 5.1% in the twelve months to March, hitting a new two-and-a-half-year low. As highlighted in the chart, this has resulted in a widening of the gap between Fathom’s measure of growth and the official measure, which was a steady 6.4% in the first quarter of the year.
Based on Fathom’s measure, trend growth is lower than officially stated, as it has been since 2011, and that is despite financial conditions being looser than usual in China. Indeed, cuts to the reserve ratio requirement for banks, a go-to policy in times of economic weakness, have been harder and faster than at any point in recent history — including the financial crisis.
Even so, in an attempt to arrest the slowdown in underlying growth, China has resorted to its old tried-and-tested growth tactics of credit-fuelled investment. Problematically for Beijing, these efforts to cushion the economy will only exacerbate existing domestic and global imbalances.
Indeed, weaker trend growth is attributable in part to the astronomical expansion of credit observed in China in recent years, which has led to allocative mistakes at the macro level. That misallocation is evidenced by China’s non-performing loan problem, which, as Fathom detailed in a recent note to clients, is estimated to be a large and rising 28–38% of domestic GDP.
With China’s current policy mix suffering not only diminishing returns but allocative inefficiencies too, Fathom’s central scenario sees China falling into the same kind of long-term rut as Japan. In this world, despite the evergreening of bad loans and perennially low interest rates, China’s economy will slow to around 4% by 2021.
Taking its all together, with no doubts on new long-term bullish cycle on gold, it seems that time for moderate retracement is come, especially if we will be correct on Fed July meeting and rate will be kept with no change.
Technical
Monthly
This week we have significant changes on monthly chart. Market has broken through multiple important levels. They are major 3/8i Fib resistance, which also is a neckline of our extended H&S pattern and price exceeded YPR1. It is a bit early to talk on final breakout as gold market stands not too far from it, but if price will able to hold above it - this will be major confirmation of long-term bull trend on the market. Once price turns in area above Pivot Resistance 1 it stops to be retracement and becomes new trend.
Next target here is 1450 area. This is OP of our H&S, which also coincides with butterfly extension. Both targets stand below monthly OB level, so they could be hit in nearest future.
Our MACD hidden divergence which suggests action above 1380 top now is completed.
Fundamental reasons for gold rising mostly relate to changing of global political and economical situation. Strong global shifts never could happen without big political events. This should provide big support to gold market. Now it is widely suggested that these processes should accelerate closer to 2020 year, or even in second half of 2019. Right now we see that it also has impact on economy.
Thus we keep up with our "symmetrical" model of "compounded reverse H&S" shape. In fact we have mirror action to the right and to the left from the bottom. Market forms approximately equal lows on both sides. The speed is also similar. Is it possible that reversal is forming? Why not.
Thus, overall situation on monthly chart shows bullish sentiment. MACD trend stands bullish as well.
Weekly
On weekly chart we have the same patterns but of a smaller scale. Although weekly OP target coincides with the monthly one, butterfly has different extensions. 1.27 target stands around 1420. Other targets stand deep above OB level.
Despite how strong recent action looks, this is still the waiting time for us. Odds now stand not in favor of taking long position as market is deeply overbought here. By this reason, it is not too important for us where market will start retracement - either from 1420 or it will climb a bit higher. The only thing that is matter right now is retracement per se and its depth as it should provide us comfortable conditions for taking long position. Weekly K-area around 1320 looks like an area where setup for position taking could be formed.
Daily
Obviously that market is overextended on daily chart as well. Here price hits the local OP target as well. No signs of retracement yet and no patterns. Here we could consider two levels 1376 and K- area of 1355 where some trading setups could be formed. But nothing definite yet.
Intraday
We have mostly theoretical interest to intraday charts as we do not have any intention to trade gold market short right now and have an interest to them trying to identify retracement starting point. On 4H we have only bullish grabber pattern, that suggests at least another one swing up.
As we see on weekly chart, the butterfly there has 1420 target and it has not bee hit yet:
Hourly chart shows huge hidden bullish divergence with MACD. So, our scenario could look like here. Conversely - drop could start right at the opening on Monday. Gold follows existed driving factors two weeks in a row without any rest and they are mostly priced in already. As we have OB condition as on weekly as on daily charts - market position seems fragile, ready to drop at any time.
Conclusion
No doubts, gold keeps positive mood, shows great upside impulse and fundamental background for continuation. At the same time we see market technically overextended as on daily as on weekly chart and it needs relief- some technical pullback. So, we suggest that it is not very good point for taking new long position by far. As price is coming to important targets, retracement probably stands right around the corner.
The technical portion of Sive's analysis owes a great deal to Joe DiNapoli's methods, and uses a number of Joe's proprietary indicators. Please note that Sive's analysis is his own view of the market and is not endorsed by Joe DiNapoli or any related companies.