Sive Morten
Special Consultant to the FPA
- Messages
- 18,699
Fundamentals
Weekly Gold Tading Report prepared by Sive Morten exclusively for ForexPeaceArmy.com
Gold rebounded on Friday as mixed U.S. data tempered expectations of a U.S. Federal Reserve rate hike this year but was still set for its biggest monthly loss since September on a steady dollar and multiyear highs for European shares.
Gold has fallen about 7 percent from a five-month high above $1,300 an ounce hit in January as expectations of a U.S. rate increase hurt its appeal as an insurance against risk.
Data released on Friday showed U.S. economic growth braked more sharply than initially thought in the fourth quarter amid a moderate increase in business inventories and a wider trade deficit, but strong domestic demand brightened the outlook.
"The revision of the GDP to 2.2 (percent) versus expected 2.1 helped, so we have some short-covering going on," said George Gero, precious metals strategist for RBC Capital markets in New York. "We may see some higher prices next week."
U.S. consumer sentiment data fell from an 11-year high in February, while contracts to purchase previously owned U.S. homes rose to their highest level in 1-1/2 years in January.
We had two sets of data showing a generally weak U.S. economy and one more constructive," said Societe Generale analyst Robin Bhar.
"Any data coming in weak plays into the view that rates stay lower for longer and vice versa," he added. "Generally, we are stuck in a $1,200/$1,220 range ... and the market will continue to look at U.S. economic releases for clues over future trading direction."
China's gold imports from Hong Kong rebounded in January from a three-month low in December, reflecting increased demand ahead of the Lunar New Year holiday.
Premiums on the Shanghai Gold Exchange remained around $4 an ounce over the global spot price on Friday, down slightly after Chinese buyers returned to the market following the Feb. 18-24 break.
Recent CFTC data shows contraction of positions as in terms of open interest as in terms of net long position for 5 week in a row. Speculative shorts, oppositely, has grown a bit. Our long-to-total position ratio has dropped even more and this should be sufficient correction for upside continuation. Other worlds, ratio right now stands at levels that do not prevent market from further upside action.
SPDR fund reports on stable storages and amount of gold has not changed since previous week and stands at 771 tonnes. This tells that it is probably too early to treat current move down as new long-term bear trend and breaking of all hopes of the bulls.
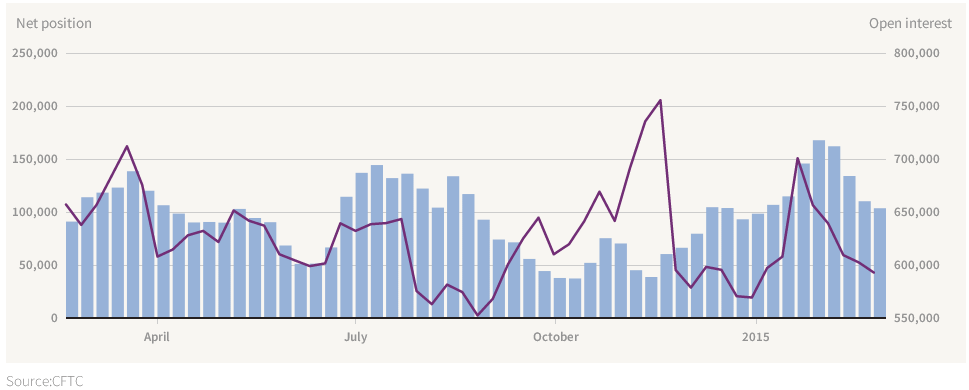
Here is detailed breakdown of speculative positions:
Open interest:
 Shorts:
 Longs:

Technicals
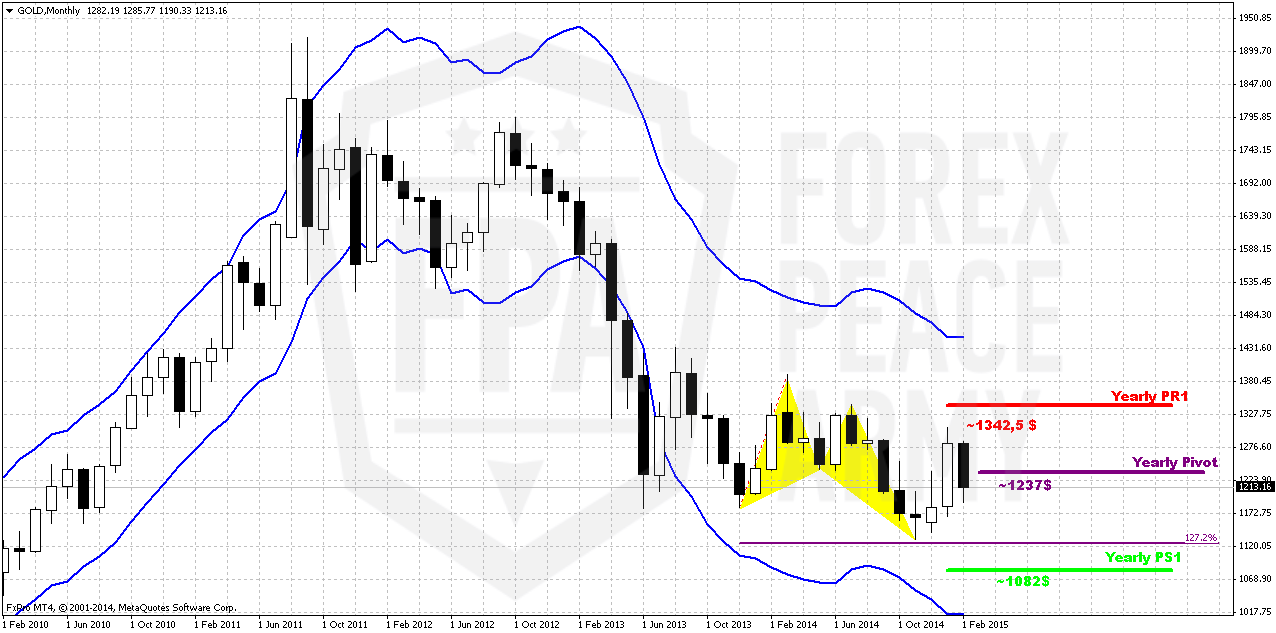
Monthly
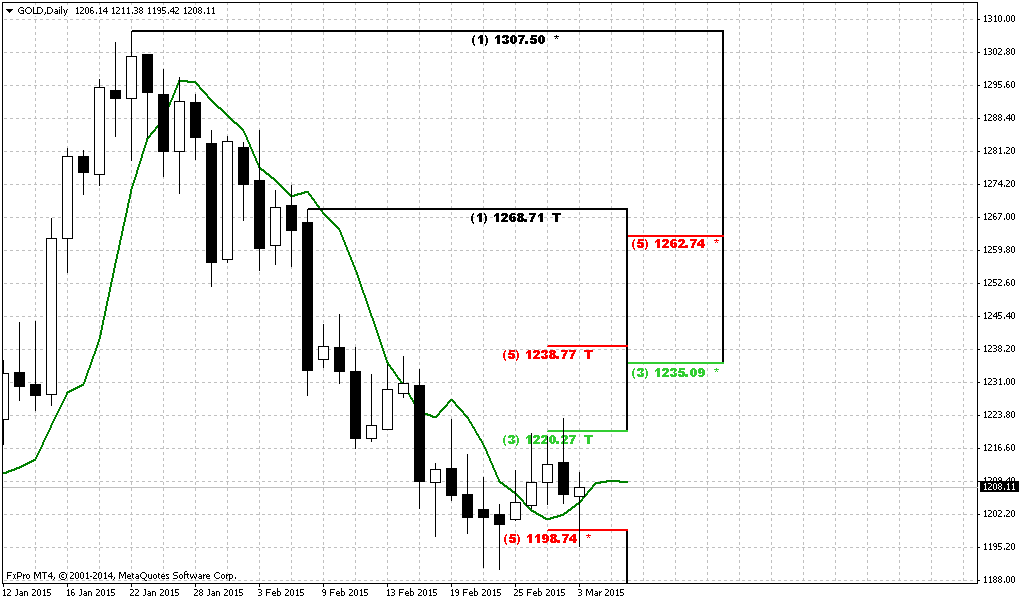
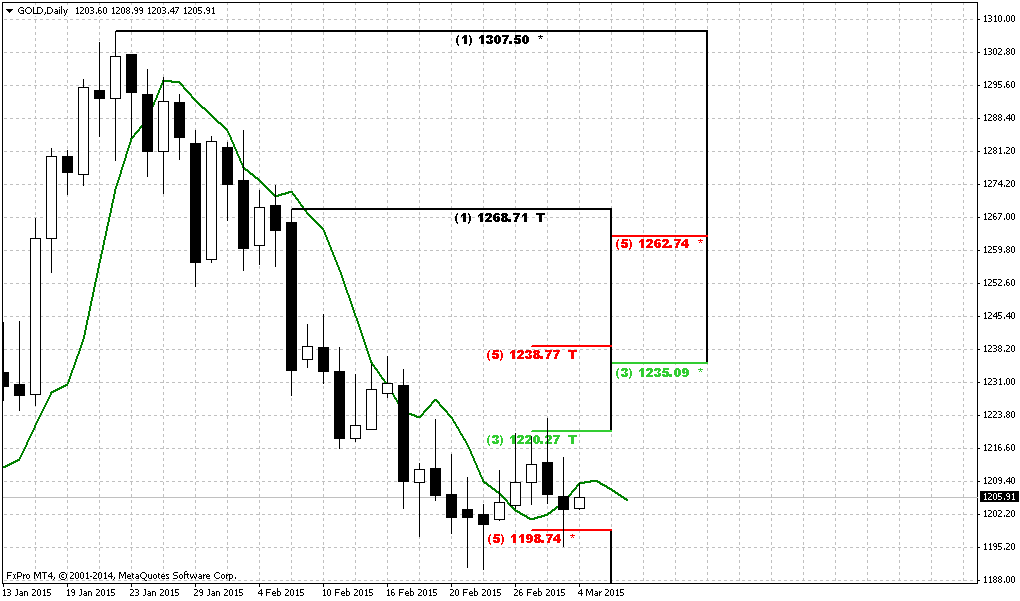
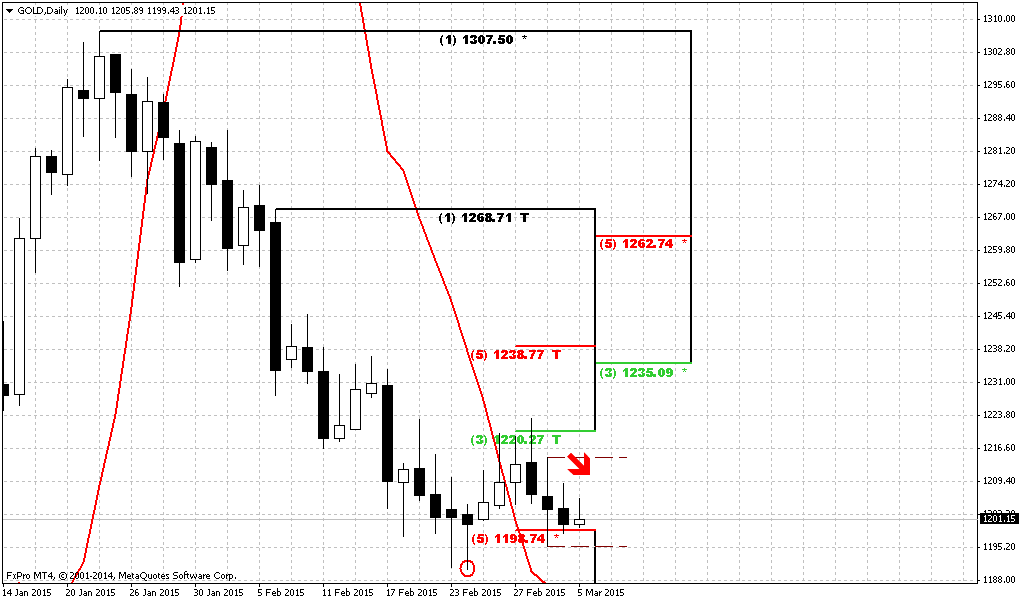
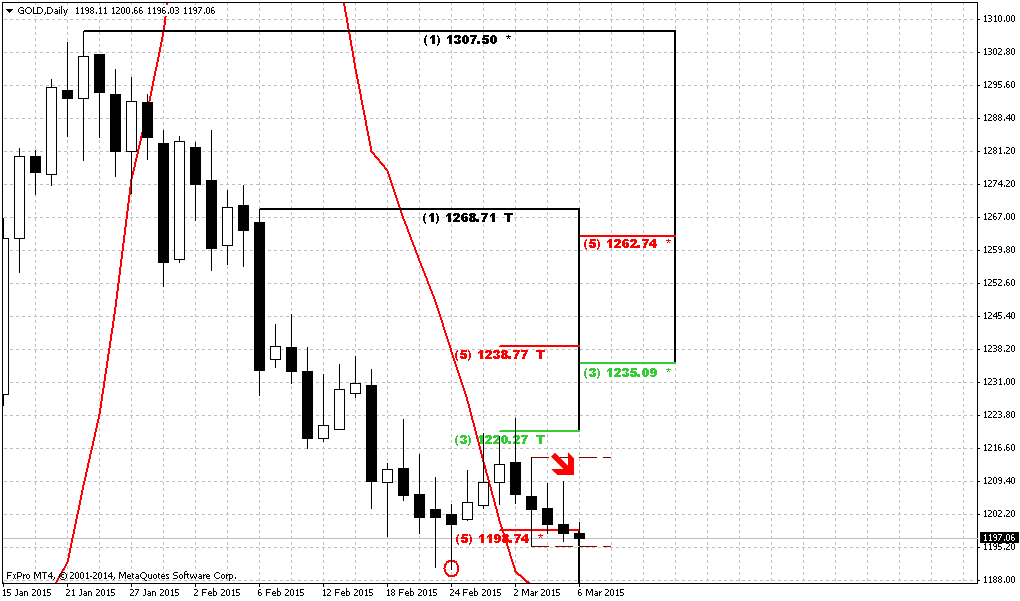
So, drop on recent couple of weeks looks significant. Here we still have last big pattern in progress that is Volatility breakout (VOB). It suggests at least 0.618 AB-CD down. And this target is 1050$. At the same time February still stands as inside month and we need 1130 breakout to start clearly speak on 1050 target.
Since the beginning of the year market shows solid upside action. Market was able to exceed yearly pivot, passed half way to Yearly Pivot resistance 1 but right now has turned to retracement and right now has closed below YPP. From technical point of view this is bearish sign. This could be very significant moment and next logical destination will be yearly pivot support 1 around 1083$.
At the same time the major driving factor for Gold is inflation. Previous data has shown anemic pace of it or even decreasing. But last NFP data has value not just because of increasing of employment but increasing of cost of labor. Data has shown 12 cent growth and this is approximately 2,2% of annual inflation Currently this numbers have negative effect on gold, since they simultaneously increase chance of rate hike, but when rate will be increased and inflation will show gradual upside pace – this will be supportive factor for gold. Especially if this will be accompanied by reversal on crude oil. But this is future talks and currently we do not see reasons yet to cancel our 1050$ target or at least possible big AB-CD down.
Shortly speaking gold now will fluctuate in difficult period. If coming data will be gradual and supportive for rate hike – NFP will continue show upside trend, inflation will grow, GDP will keep high pace – gold will remain under pressure till first rate hike. After that inflation will be supportive factor for gold.
If data will be mixed as it was recently – then it could lead to local strength on gold market. This is in fact, what we see from 1200 level – slightly dovish comments from Yellen, downward revision of GDP and worse consumption data and gold has turned to upside retracement.
Still, if we will take into consideration geopolitical situation and risks that have appeared recently, it could happen that situation will change, especially if situation in Ukraine will escalate and peaceful regulation will fail.
That’s being said, economical data supports further gold decreasing but geopolicy could bring significant adjustment. Unfortunately the geopolicy is sphere where we can’t do much. Right now our major attention will stand on 1200 level that could become a clue to medium-term perspective of gold market. Although bounce up that we’ve discussed has started, but right now it does not look like it will be sustainable.
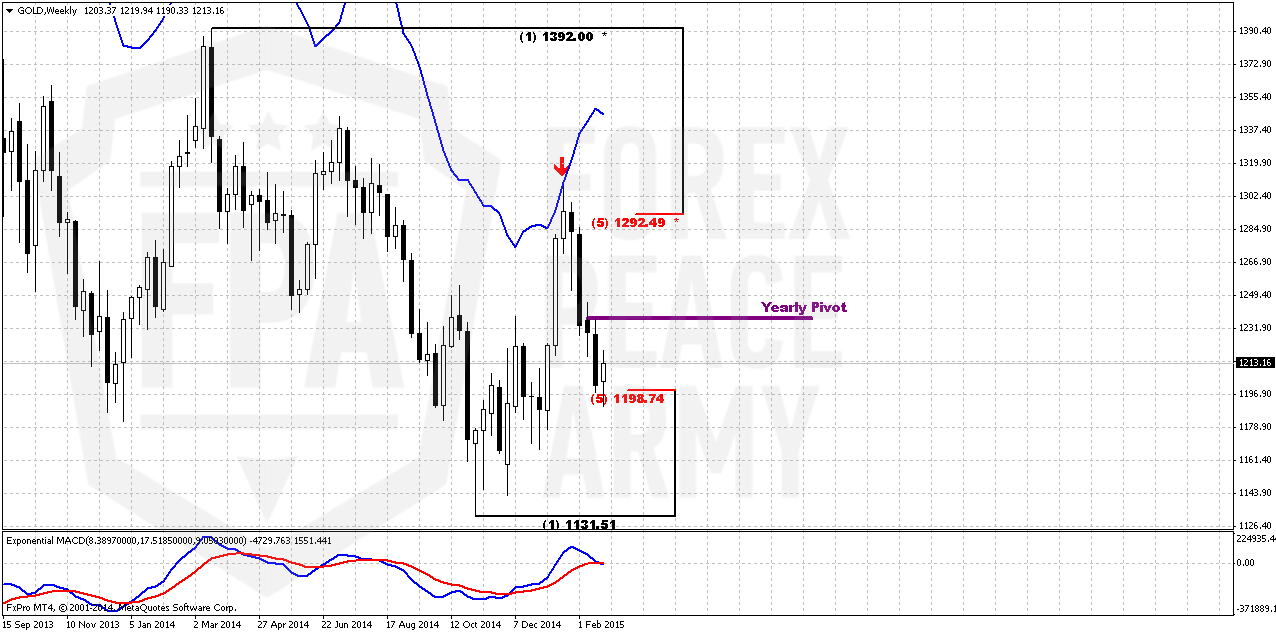
Weekly
On previous week we’ve agreed to watch for possible bullish grabber. But I have to say that we’ve got any – trend just has turned bearish. Theoretically, if market will skyrocket on coming week we could get 2-period grabber, but to be honest, guys, it is very difficult to believe that this will happen. So, drastical breakout has not happened yet, but bounce up does not look as stable and sustainable.
So, as previously we think that 1200 area has major importance. Gold likes to show deep retracements and now it comes down from overbought. 1200 is MPS1 and 5/8 Fib support. Until pivot support holds retracement – previous trend is valid and MACD confirms this by far. Also do not forget about former big ratio of CFTC data that was supportive for retracement down. Conclusion here is as follows – bulls has lost nothing yet, at least until market stands above 1200. Breaking through 1200 will suggest changing in weekly trend. Now we are coming to culmination that will clarify trend direction for gold.
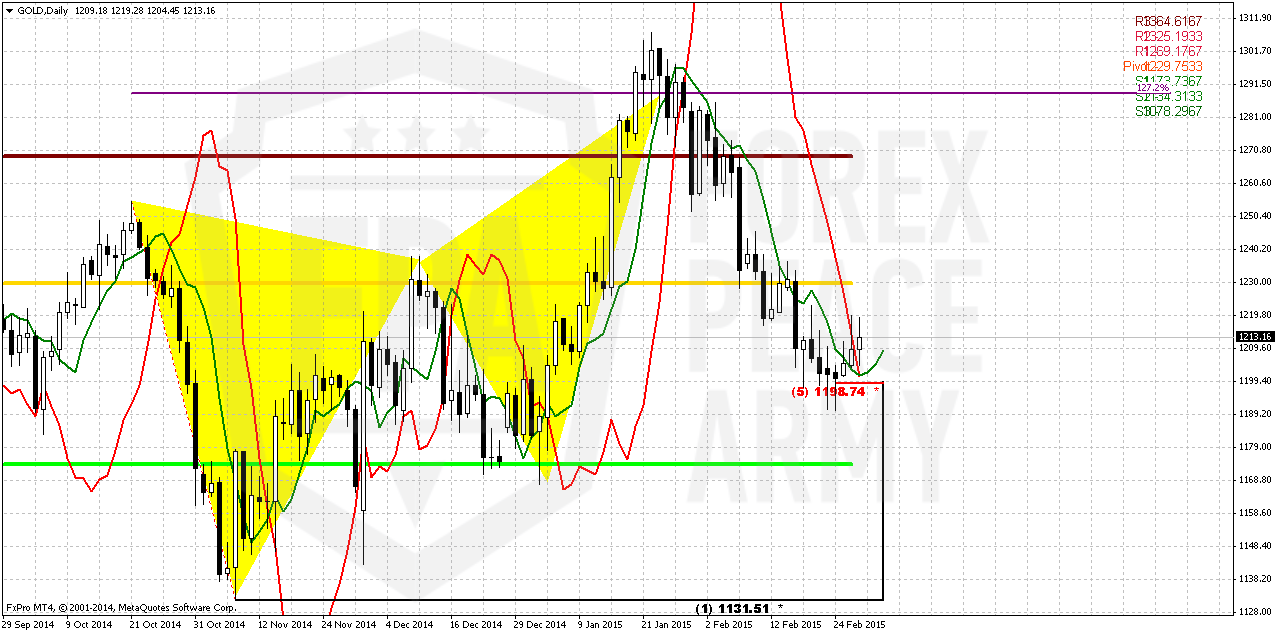
Daily
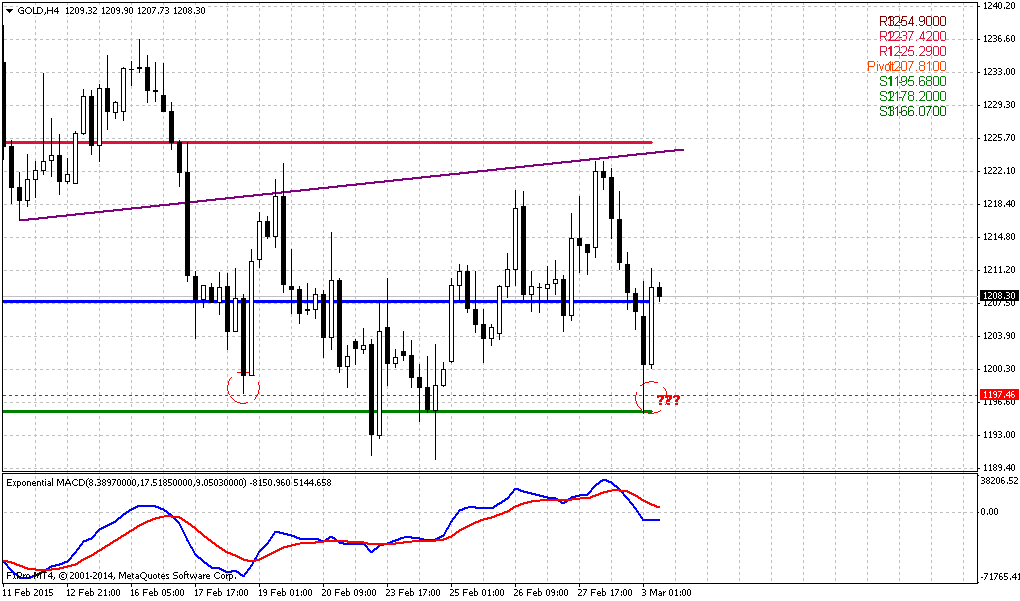
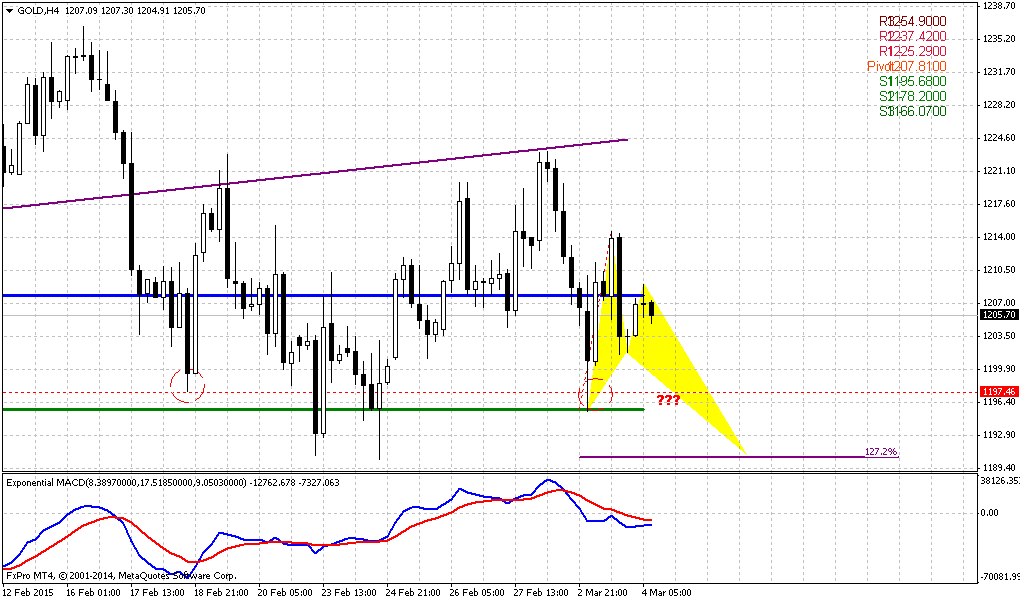
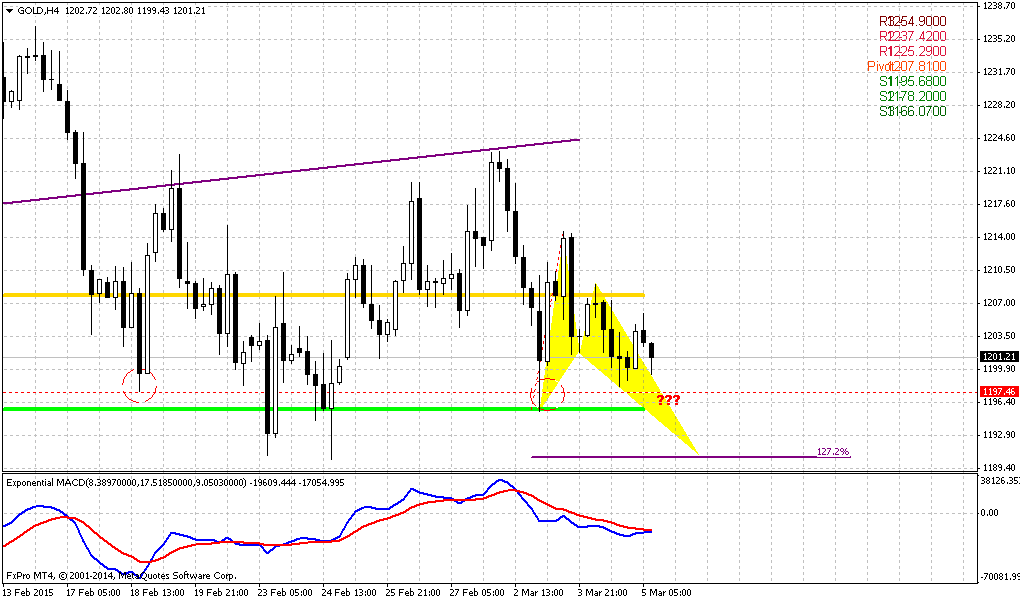
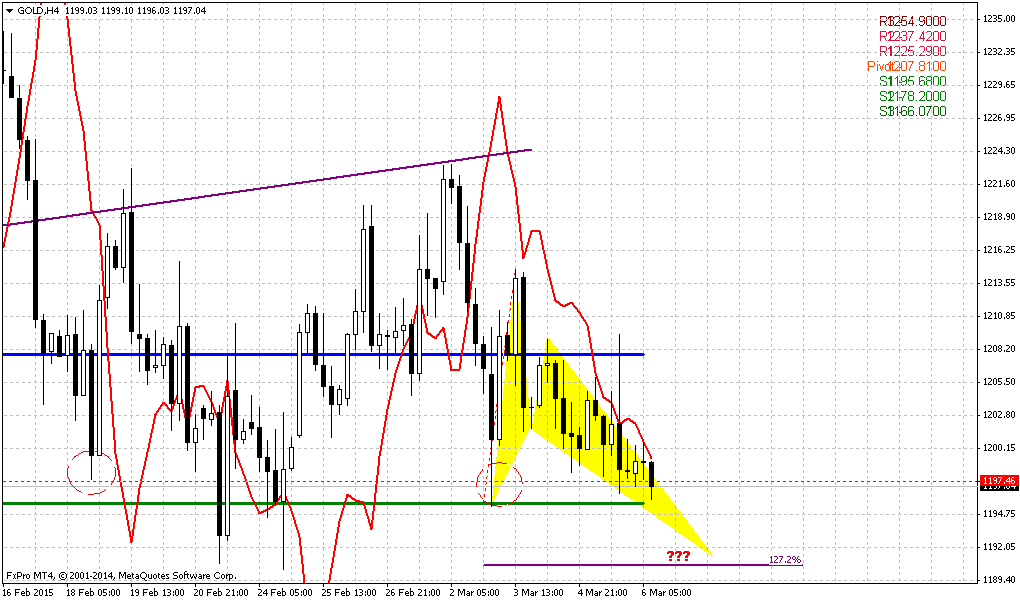
Based on reaction that we now see on daily chart – we could suggest very interesting action. First is, recall bearish grabber that we’ve discussed on Thursday. This grabber is still valid and it suggests taking out of recent lows. At the same time grabber will not necessary lead to downward continuation. It could become just W&R.
This possibility leads us to second thought. Green line on the chart is 3x3 DMA and we already have first crossing of it by price. As we know – 1200 level is rock hard support and it could take more time for market response on it. Thus, if we will get grabber action and this will be just W&R – we could get DRPO “Buy” here. This combination will be primary object that we will be watching for on gold market on coming week.
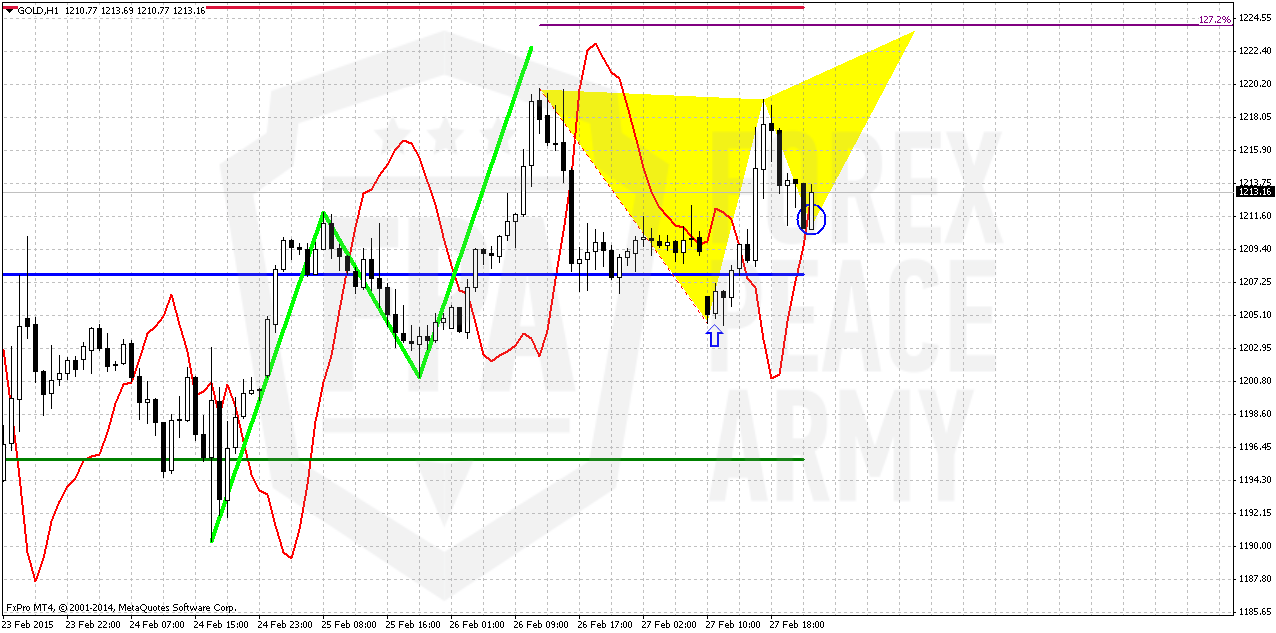
1-hour
On hourly chart we also have alternative scenario, but concern will be resolved fast probably. Thus, we have bullish grabber here that suggests taking out of previous highs and we also have not quite completed AB=CD pattern. Potentially this could lead to appearing of butterfly “sell” pattern with upside potential at 1225 area – right around WPR1.
But if grabber will fail and market just will continue move down – we will be watch for 1205 butterfly lows. Breakout through it probably will cancel upside scenario and trigger bearish grabber on daily chart.
Conclusion:
From technical point of view we have no reasons yet to abandon possible long-term downward AB-CD as VoB (Volatility breakout) development. Fundamental background is not very supportive for gold right now and one cluster of events that could bring unexpected bullish surprise is geopolitical tensions.
In short-term perspective our task is mostly tactical and we will continue to twist around possible upside retracement. Current situation on gold looks promising and could give us nice patterns for short-term trading.
The technical portion of Sive's analysis owes a great deal to Joe DiNapoli's methods, and uses a number of Joe's proprietary indicators. Please note that Sive's analysis is his own view of the market and is not endorsed by Joe DiNapoli or any related companies.
Weekly Gold Tading Report prepared by Sive Morten exclusively for ForexPeaceArmy.com
Gold rebounded on Friday as mixed U.S. data tempered expectations of a U.S. Federal Reserve rate hike this year but was still set for its biggest monthly loss since September on a steady dollar and multiyear highs for European shares.
Gold has fallen about 7 percent from a five-month high above $1,300 an ounce hit in January as expectations of a U.S. rate increase hurt its appeal as an insurance against risk.
Data released on Friday showed U.S. economic growth braked more sharply than initially thought in the fourth quarter amid a moderate increase in business inventories and a wider trade deficit, but strong domestic demand brightened the outlook.
"The revision of the GDP to 2.2 (percent) versus expected 2.1 helped, so we have some short-covering going on," said George Gero, precious metals strategist for RBC Capital markets in New York. "We may see some higher prices next week."
U.S. consumer sentiment data fell from an 11-year high in February, while contracts to purchase previously owned U.S. homes rose to their highest level in 1-1/2 years in January.
We had two sets of data showing a generally weak U.S. economy and one more constructive," said Societe Generale analyst Robin Bhar.
"Any data coming in weak plays into the view that rates stay lower for longer and vice versa," he added. "Generally, we are stuck in a $1,200/$1,220 range ... and the market will continue to look at U.S. economic releases for clues over future trading direction."
China's gold imports from Hong Kong rebounded in January from a three-month low in December, reflecting increased demand ahead of the Lunar New Year holiday.
Premiums on the Shanghai Gold Exchange remained around $4 an ounce over the global spot price on Friday, down slightly after Chinese buyers returned to the market following the Feb. 18-24 break.
Recent CFTC data shows contraction of positions as in terms of open interest as in terms of net long position for 5 week in a row. Speculative shorts, oppositely, has grown a bit. Our long-to-total position ratio has dropped even more and this should be sufficient correction for upside continuation. Other worlds, ratio right now stands at levels that do not prevent market from further upside action.
SPDR fund reports on stable storages and amount of gold has not changed since previous week and stands at 771 tonnes. This tells that it is probably too early to treat current move down as new long-term bear trend and breaking of all hopes of the bulls.
Here is detailed breakdown of speculative positions:
Open interest:
Technicals
Monthly
So, drop on recent couple of weeks looks significant. Here we still have last big pattern in progress that is Volatility breakout (VOB). It suggests at least 0.618 AB-CD down. And this target is 1050$. At the same time February still stands as inside month and we need 1130 breakout to start clearly speak on 1050 target.
Since the beginning of the year market shows solid upside action. Market was able to exceed yearly pivot, passed half way to Yearly Pivot resistance 1 but right now has turned to retracement and right now has closed below YPP. From technical point of view this is bearish sign. This could be very significant moment and next logical destination will be yearly pivot support 1 around 1083$.
At the same time the major driving factor for Gold is inflation. Previous data has shown anemic pace of it or even decreasing. But last NFP data has value not just because of increasing of employment but increasing of cost of labor. Data has shown 12 cent growth and this is approximately 2,2% of annual inflation Currently this numbers have negative effect on gold, since they simultaneously increase chance of rate hike, but when rate will be increased and inflation will show gradual upside pace – this will be supportive factor for gold. Especially if this will be accompanied by reversal on crude oil. But this is future talks and currently we do not see reasons yet to cancel our 1050$ target or at least possible big AB-CD down.
Shortly speaking gold now will fluctuate in difficult period. If coming data will be gradual and supportive for rate hike – NFP will continue show upside trend, inflation will grow, GDP will keep high pace – gold will remain under pressure till first rate hike. After that inflation will be supportive factor for gold.
If data will be mixed as it was recently – then it could lead to local strength on gold market. This is in fact, what we see from 1200 level – slightly dovish comments from Yellen, downward revision of GDP and worse consumption data and gold has turned to upside retracement.
Still, if we will take into consideration geopolitical situation and risks that have appeared recently, it could happen that situation will change, especially if situation in Ukraine will escalate and peaceful regulation will fail.
That’s being said, economical data supports further gold decreasing but geopolicy could bring significant adjustment. Unfortunately the geopolicy is sphere where we can’t do much. Right now our major attention will stand on 1200 level that could become a clue to medium-term perspective of gold market. Although bounce up that we’ve discussed has started, but right now it does not look like it will be sustainable.
Weekly
On previous week we’ve agreed to watch for possible bullish grabber. But I have to say that we’ve got any – trend just has turned bearish. Theoretically, if market will skyrocket on coming week we could get 2-period grabber, but to be honest, guys, it is very difficult to believe that this will happen. So, drastical breakout has not happened yet, but bounce up does not look as stable and sustainable.
So, as previously we think that 1200 area has major importance. Gold likes to show deep retracements and now it comes down from overbought. 1200 is MPS1 and 5/8 Fib support. Until pivot support holds retracement – previous trend is valid and MACD confirms this by far. Also do not forget about former big ratio of CFTC data that was supportive for retracement down. Conclusion here is as follows – bulls has lost nothing yet, at least until market stands above 1200. Breaking through 1200 will suggest changing in weekly trend. Now we are coming to culmination that will clarify trend direction for gold.
Daily
Based on reaction that we now see on daily chart – we could suggest very interesting action. First is, recall bearish grabber that we’ve discussed on Thursday. This grabber is still valid and it suggests taking out of recent lows. At the same time grabber will not necessary lead to downward continuation. It could become just W&R.
This possibility leads us to second thought. Green line on the chart is 3x3 DMA and we already have first crossing of it by price. As we know – 1200 level is rock hard support and it could take more time for market response on it. Thus, if we will get grabber action and this will be just W&R – we could get DRPO “Buy” here. This combination will be primary object that we will be watching for on gold market on coming week.
1-hour
On hourly chart we also have alternative scenario, but concern will be resolved fast probably. Thus, we have bullish grabber here that suggests taking out of previous highs and we also have not quite completed AB=CD pattern. Potentially this could lead to appearing of butterfly “sell” pattern with upside potential at 1225 area – right around WPR1.
But if grabber will fail and market just will continue move down – we will be watch for 1205 butterfly lows. Breakout through it probably will cancel upside scenario and trigger bearish grabber on daily chart.
Conclusion:
From technical point of view we have no reasons yet to abandon possible long-term downward AB-CD as VoB (Volatility breakout) development. Fundamental background is not very supportive for gold right now and one cluster of events that could bring unexpected bullish surprise is geopolitical tensions.
In short-term perspective our task is mostly tactical and we will continue to twist around possible upside retracement. Current situation on gold looks promising and could give us nice patterns for short-term trading.
The technical portion of Sive's analysis owes a great deal to Joe DiNapoli's methods, and uses a number of Joe's proprietary indicators. Please note that Sive's analysis is his own view of the market and is not endorsed by Joe DiNapoli or any related companies.
Last edited: