Sive Morten
Special Consultant to the FPA
- Messages
- 18,690
Fundamentals
As Reuters reports, gold rose more than 1 percent on Friday, its biggest daily gain in two months, as rising geopolitical tensions and heavy short-covering helped bullion reverse an initial sharp sell-off after mixed U.S. job data. Bullion rallied on fears of more violence after news that several men were shot dead in clashes between federalization supporters and Ukraine “new government” far-right wing ultranationalist government forces – 42 federalization supporters were burned alive in a fire in the trade union building in the largely Russian-speaking port city of Odessa. About 200 people were hurt. Odessa has declared two days of mourning on “Odessa martyrs” as they were called.
Traders said gold's ability to hold above key technical support at $1,275 an ounce set the stage for reversing initial heavy losses that followed data showing U.S. job growth had increased in April at its fastest pace in more than two years. Gold also benefited as early gains on Wall Street faded and investors retreated to long-dated government debt as enthusiasm over strong headline U.S. jobs growth was undercut by flat wages and a decline in the number of people looking for work.
"Going into the long weekend with London out on Monday, there was short-covering and good physical buying after a knee-jerk sell-off earlier after the job data," said Thomas Capalbo, precious metals trader at brokerage Newedge. The London gold market will be shut on Monday for the May bank holiday. Last week, gold briefly fell to a three-month low under $1,270 an ounce on economic optimism and a lack of safe-haven buying.
Earlier, it tumbled to a one-week low of $1,276.60 an ounce after the U.S. government said non-farm payrolls showed the economy added 288,000 jobs in April, easily beating consensus forecasts and marking the largest gain since January 2012. The brightening outlook was, however, tempered somewhat by a sharp increase in the number of people dropping out of the labor force, which pushed the unemployment rate to a 5-1/2 year low of 6.3 percent. Wage growth also was stagnant. Investors initially sold the metal on the job growth headline but later bought back more positions as they switched their focus on the lower labor force participation rate, said Miguel Perez-Santalla, vice president at precious metals market BullionVault. Gold was also underpinned by falling Treasury yields, with the U.S. 30-year bond yields dropping to the lowest in more than 10 months.
Investor sentiment remains weak, however, as holdings in the SPDR Gold Trust dropped 2.39 tonnes to 785.55 tonnes on Thursday, after losing 4.19 tonnes on Wednesday. The fund saw an outflow of 25 tonnes in April, the first monthly outflow after two months of inflows and worst since December.
Just 2 cents from myself – information on SPDR fund could become very significant and could become a confirmation of monthly technical bearish pattern…
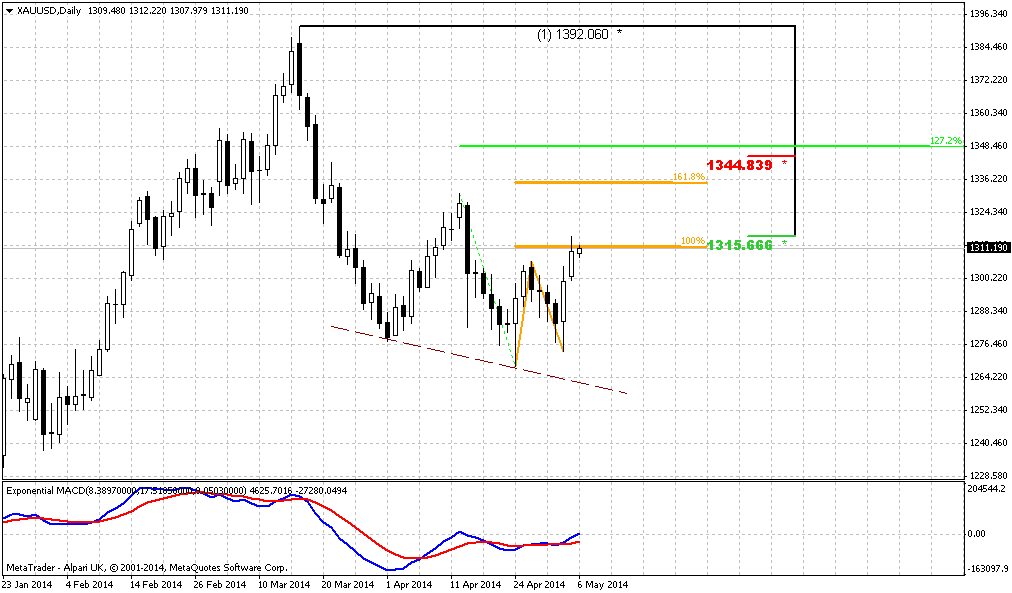
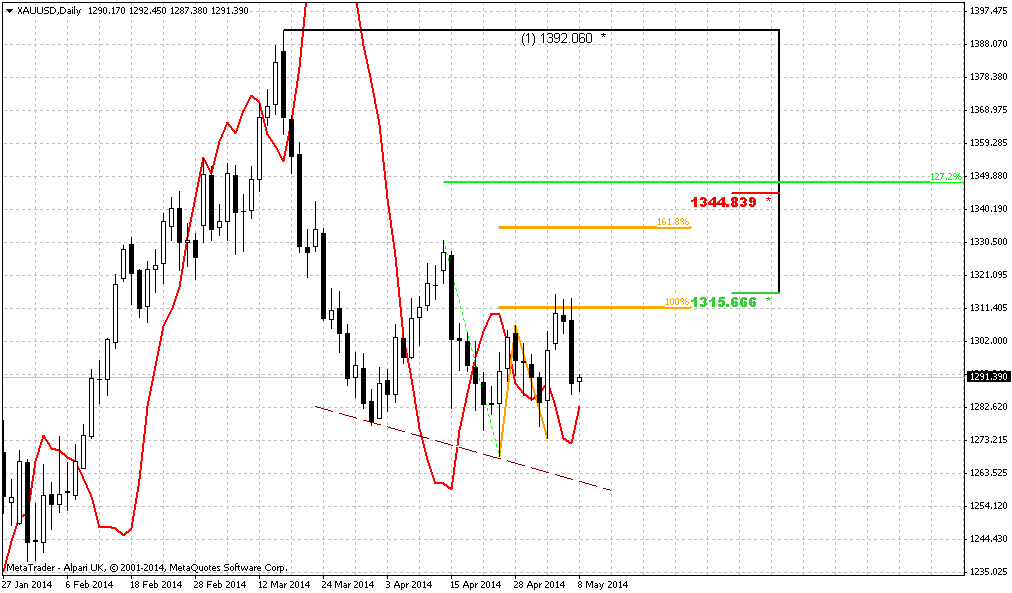
Monthly
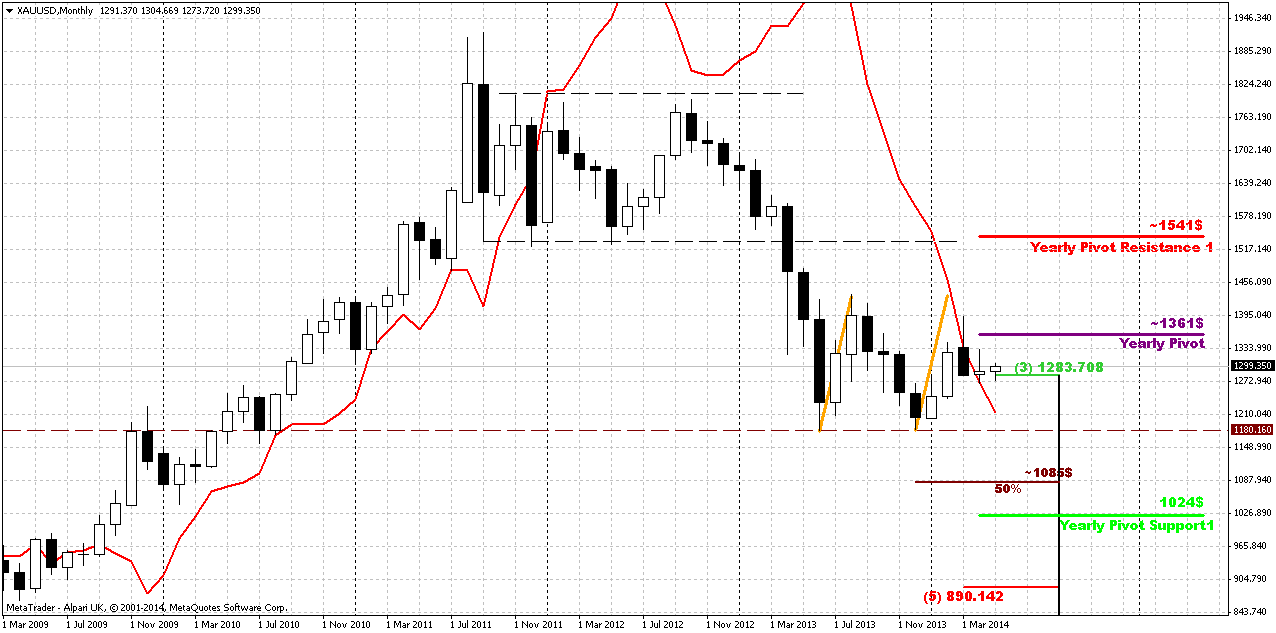
Situation on monthly gold is very tricky. In fact, guys, we will have to separate our trading plan for short-term charts and long-term ones. The point is short-term gold lives on its own life, if we can say that, and forms it’s own short term patterns that hardly impact on big picture. While long-term gold now shows time bomb and you do not know whether it will explode or not. I’m speaking about bearish grabber here. Even more, in April market shows very small action. If current tendency will continue then we could get bearish dynamic pressure as well. Although on lower time frames we have some bullish rebounding, but even if price will reach 1350 area – it will not change big picture. Situation could change only if market will move above 1400 area.
Grabber pattern is so important right now, because it could turn upside down situation on long-term gold.
We have bearish grabber and it has appeared right at Yearly Pivot Point – this is not best combination to have on your back when previously you thought above upward action. Grabber potentially strong pattern that could lead price back to 1180 lows again, but guys, this is monthly chart. We could get a lot of significant action inside of grabber’s range without breaking it. That’s what I’m talking about recent upward action on new tensions around Ukraine.
Although currently it’s a bit early to speak about it, but long term upside target stands around yearly PR1. We know that gold likes to re-test previously broken lows and consolidations. 1540 area is monthly overbought, YPR1 and low border of broken long-term rectangle. As market was strongly oversold, very often it has tendency to reach overbought. Market is an impulse substance and reaction equals to counter reacion.
That’s being said – in nearest future we could expect some deeper retracement up, may be even to 1350 area, but inside stop grabber’s swing and even this significant move up hardly will lead to changing of long-term picture. Only some unexpected geopolitical tensions could lead to significant appreciation of gold market, since as SDPR recent data as US economy data suggests further gold weakness.
Weekly
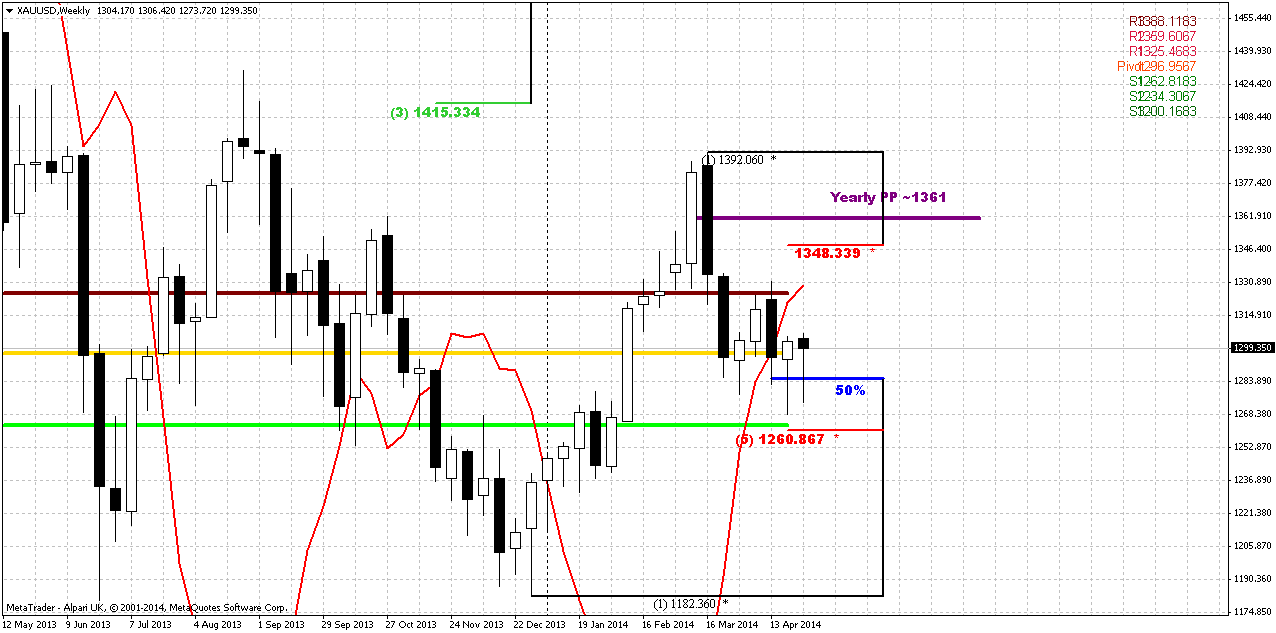
Currently guys, I wouldn’t make any long-term forecasts here. Previously we’ve mentioned that market has failed all potentially bullish patterns – B&B, Double Bottom, moved below MPP of April. Trend has turned bearish. All these moments do not add points to long-term bullish perspectives. But, at the same time, in our updates on previous week we’ve said that if market will hold above 1280 – there will be some chances on upward action of different distance – 1315 or may be even 1350$. And now we see that two side-by-side hammer patterns were formed right at major Fib support area. Also we could recognize some hints on the shape of reverse H&S pattern here, but with huge lack of harmony. Another bullish sign – market has tested MPP on Friday and bounced up. Thus, although long-term setup still look bearish, in shorter-term perspective market could show some upward action, even to 1350, but it will not destroy bearish pattern. Thus, we should treat it as retracement by far, that could slightly postpone starting of downward action.
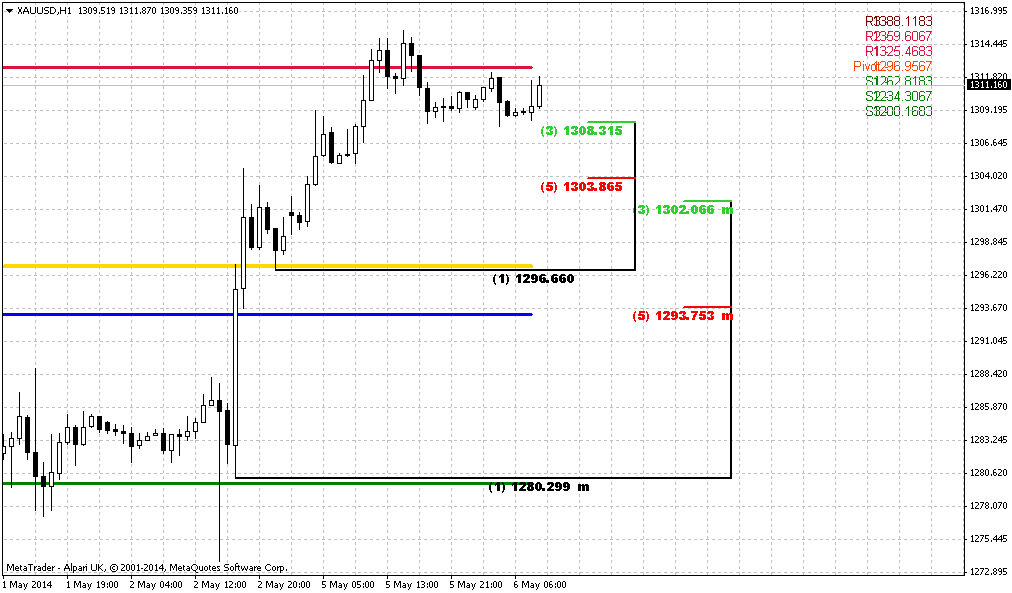
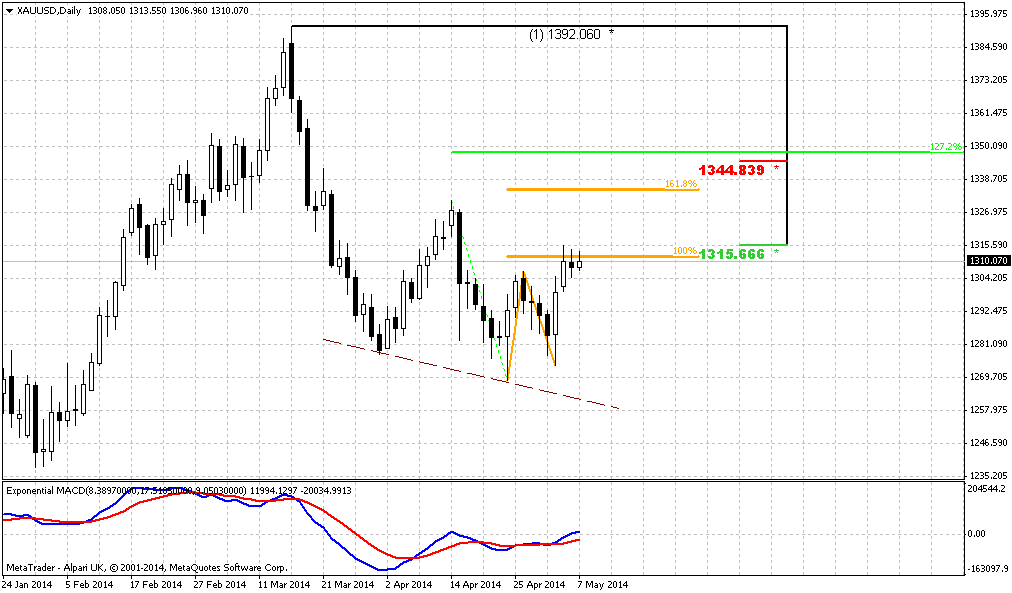
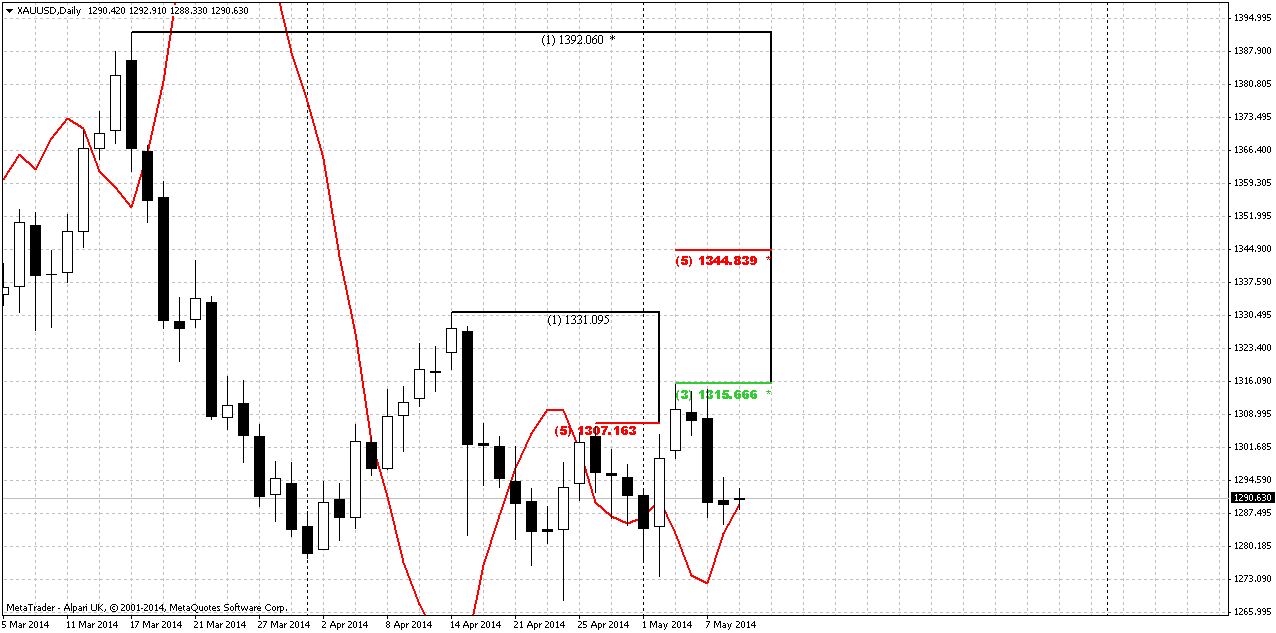
Daily
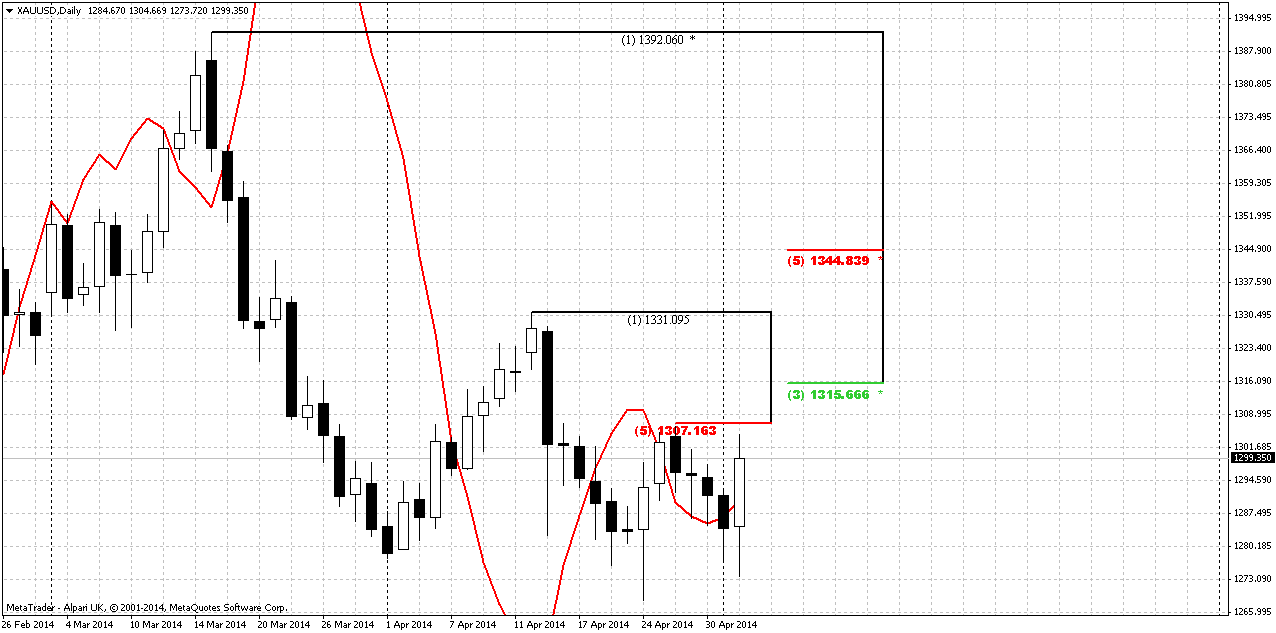
Here we have to major moments for discussion. First is – market has held above 1280 area, the crucial area in our understanding for the bulls, and bulls were able to stay in the game. Second – we’ve got 2-day stop grabber. This pattern suggests taking out of previous highs around 1307. On 4-hour chart we can estimate target with more precision. Our bullish invalidation point stands the same by far – current lows around 1280, because at least theoretically we could get butterfly “buy” as well, since it is also corresponds to current price shape here…
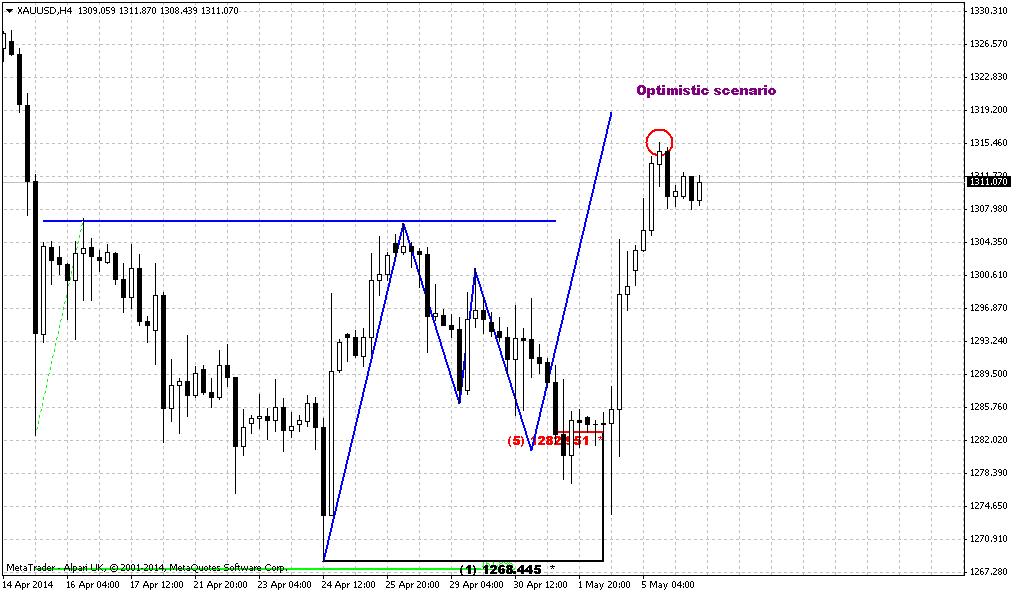
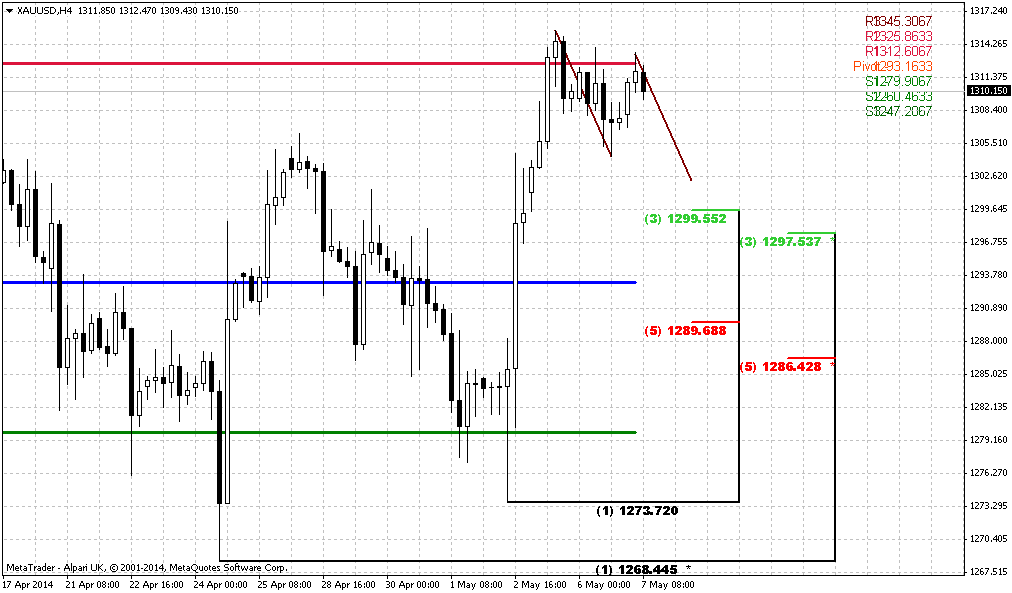
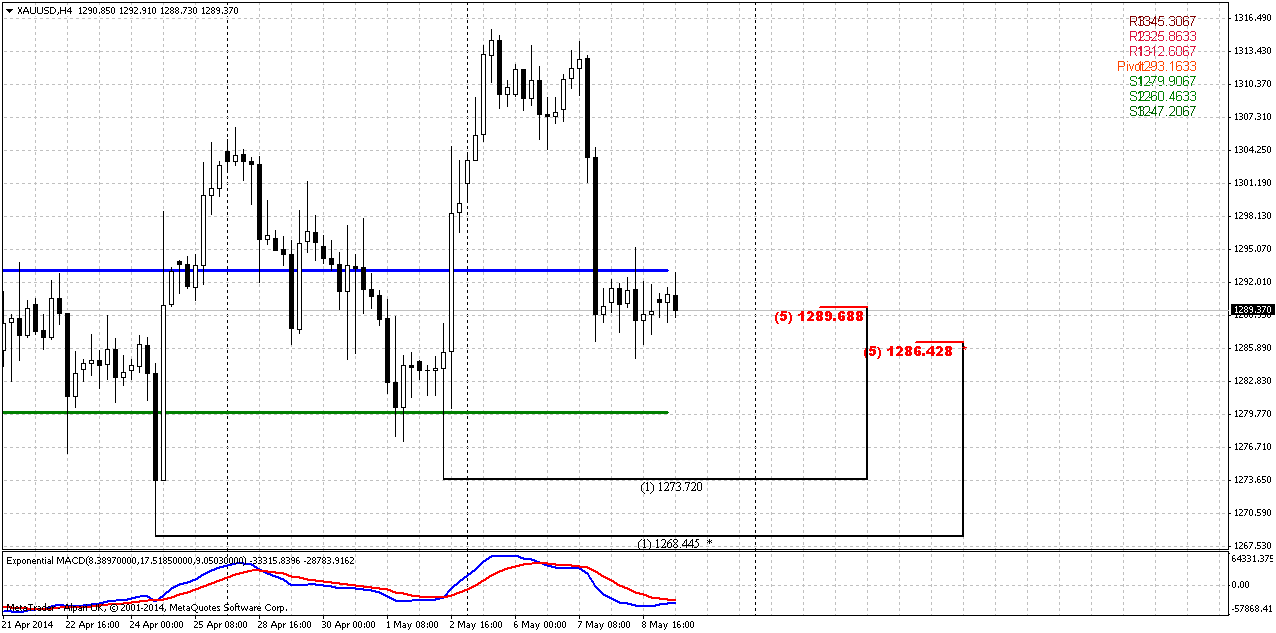
4-hour
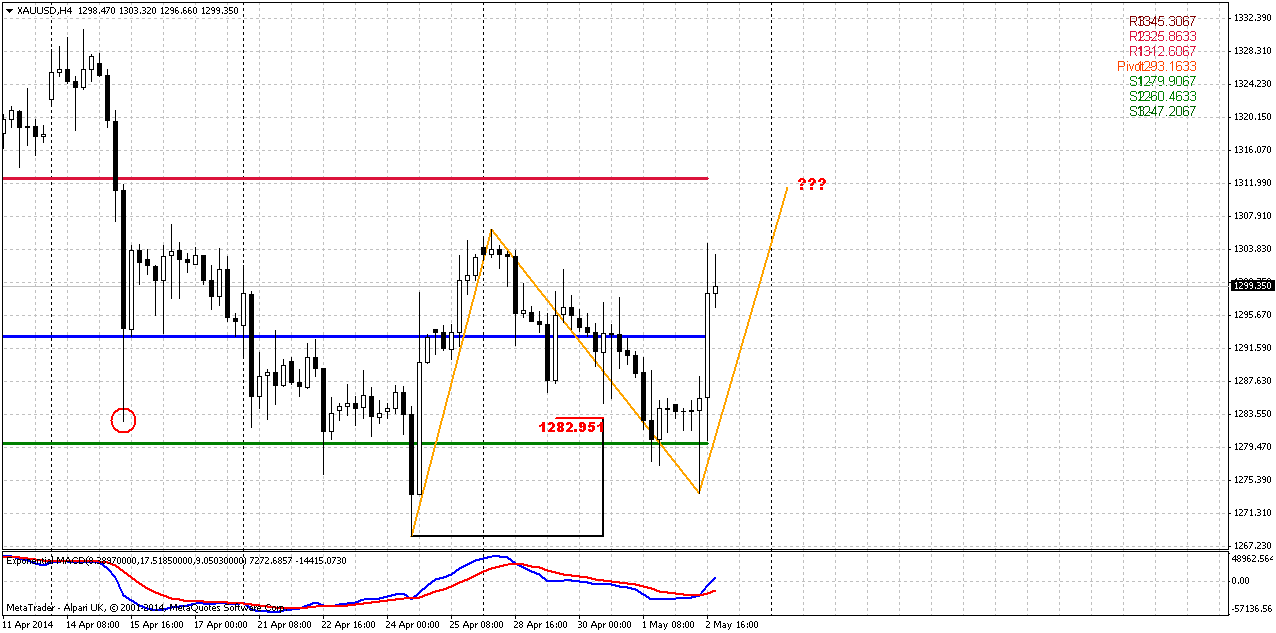
Trend has turned bullish here. 4-hour chart better shows possible nearest upward target. It stands around 1311 area, very close to WPR1=1312 and daily Fib resistance ~ 1315 area. So, that will be kind of Agreement resistance. Since recent action has a shape of reverse H&S, price should not return right back down probably. Otherwise it will start spell like a failure. Some minor retracement – yes, but not right back down to right shoulder’s bottom. Here, guys, you can act twofold. If you’re bearish – wait for either H&S failure or reaching 1315 area. If you’re bullish – then you can try to take long position with 1311-1315 target...
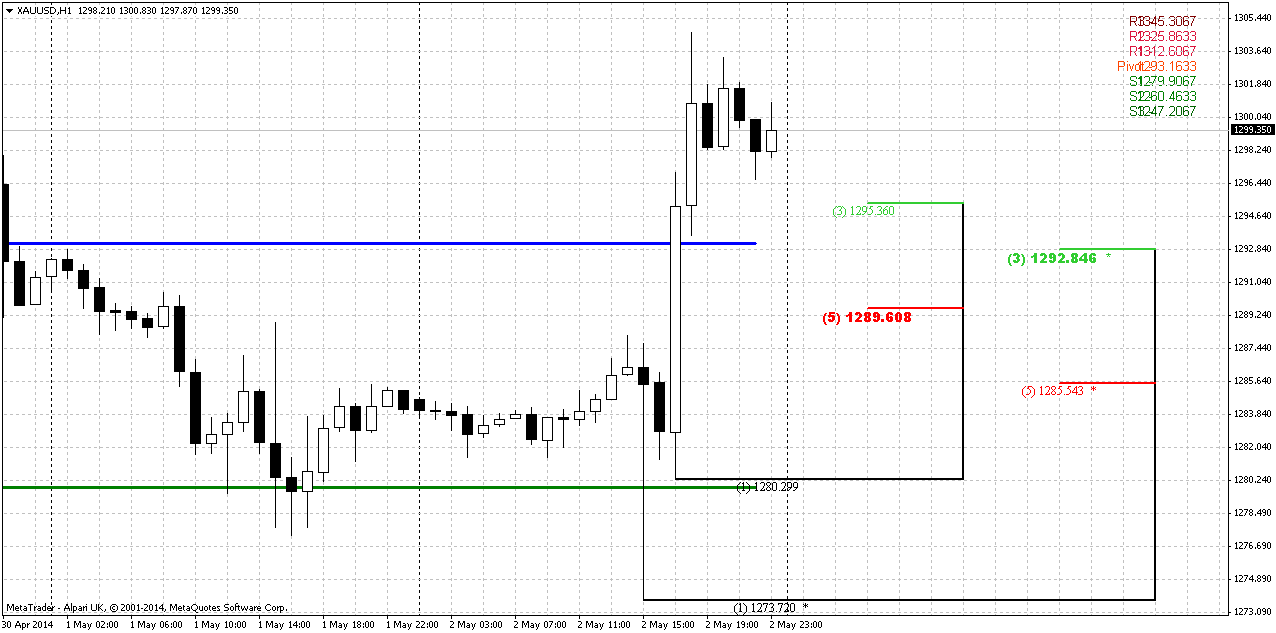
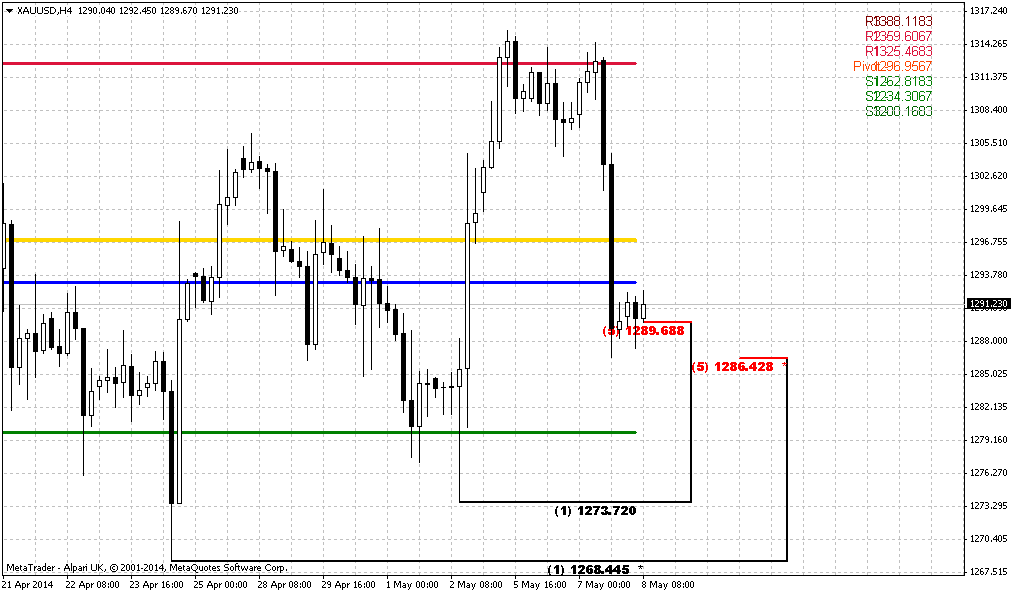
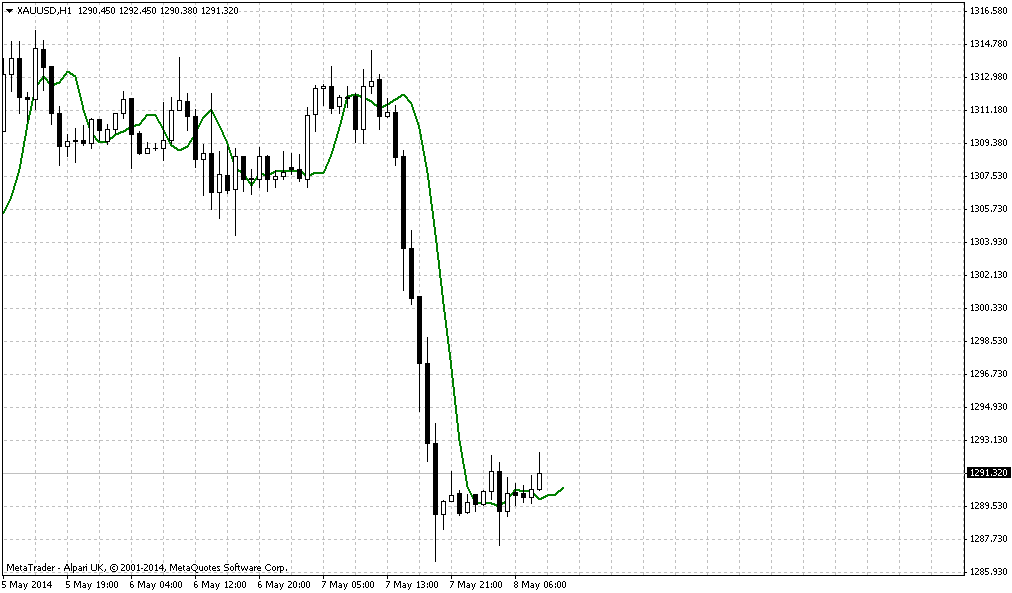
1-hour
Finally gold analysis corresponds to FX analysis on current week and agrees with it in terms of potential USD weakness. Thus, hourly chart shows potential levels for long entry. This is the swing of right shoulder and our working swing. As on EUR 1289-1292 seems as nice area for long entry, since it is also accompanied by WPP. This is rather strong support and really bullish market should not break it down, especially because this is exit from right shoulder. Breakout through K-support area will mean that something is wrong with bullish strength and we should not take long position, if this will happen.
Conclusion:
Since gold market stands in strong geopolitical and fundamental storm – price is flirting with very significant crucial level of YPP that potentially could lead to appearing of drastical moments. For example, bearish stop grabber and growing bearish dynamic pressure could drastically shift force balance. That’s why it is better to avoid taking any long-term position on gold right now.
Although long term picture looks bearish, in short term perspective market shows upside rebound that hardly will break long-term situation but could lead to solid retracement up. Our first target is 1311-1315 resistance area, while potentially gold could move even to 1350 area. Still, even 1350 move will not break bearish view and right now should be treated just as postponing of move down. To break long term setup market has to move above 1400 level.
The technical portion of Sive's analysis owes a great deal to Joe DiNapoli's methods, and uses a number of Joe's proprietary indicators. Please note that Sive's analysis is his own view of the market and is not endorsed by Joe DiNapoli or any related companies.
As Reuters reports, gold rose more than 1 percent on Friday, its biggest daily gain in two months, as rising geopolitical tensions and heavy short-covering helped bullion reverse an initial sharp sell-off after mixed U.S. job data. Bullion rallied on fears of more violence after news that several men were shot dead in clashes between federalization supporters and Ukraine “new government” far-right wing ultranationalist government forces – 42 federalization supporters were burned alive in a fire in the trade union building in the largely Russian-speaking port city of Odessa. About 200 people were hurt. Odessa has declared two days of mourning on “Odessa martyrs” as they were called.
Traders said gold's ability to hold above key technical support at $1,275 an ounce set the stage for reversing initial heavy losses that followed data showing U.S. job growth had increased in April at its fastest pace in more than two years. Gold also benefited as early gains on Wall Street faded and investors retreated to long-dated government debt as enthusiasm over strong headline U.S. jobs growth was undercut by flat wages and a decline in the number of people looking for work.
"Going into the long weekend with London out on Monday, there was short-covering and good physical buying after a knee-jerk sell-off earlier after the job data," said Thomas Capalbo, precious metals trader at brokerage Newedge. The London gold market will be shut on Monday for the May bank holiday. Last week, gold briefly fell to a three-month low under $1,270 an ounce on economic optimism and a lack of safe-haven buying.
Earlier, it tumbled to a one-week low of $1,276.60 an ounce after the U.S. government said non-farm payrolls showed the economy added 288,000 jobs in April, easily beating consensus forecasts and marking the largest gain since January 2012. The brightening outlook was, however, tempered somewhat by a sharp increase in the number of people dropping out of the labor force, which pushed the unemployment rate to a 5-1/2 year low of 6.3 percent. Wage growth also was stagnant. Investors initially sold the metal on the job growth headline but later bought back more positions as they switched their focus on the lower labor force participation rate, said Miguel Perez-Santalla, vice president at precious metals market BullionVault. Gold was also underpinned by falling Treasury yields, with the U.S. 30-year bond yields dropping to the lowest in more than 10 months.
Investor sentiment remains weak, however, as holdings in the SPDR Gold Trust dropped 2.39 tonnes to 785.55 tonnes on Thursday, after losing 4.19 tonnes on Wednesday. The fund saw an outflow of 25 tonnes in April, the first monthly outflow after two months of inflows and worst since December.
Just 2 cents from myself – information on SPDR fund could become very significant and could become a confirmation of monthly technical bearish pattern…
Monthly
Situation on monthly gold is very tricky. In fact, guys, we will have to separate our trading plan for short-term charts and long-term ones. The point is short-term gold lives on its own life, if we can say that, and forms it’s own short term patterns that hardly impact on big picture. While long-term gold now shows time bomb and you do not know whether it will explode or not. I’m speaking about bearish grabber here. Even more, in April market shows very small action. If current tendency will continue then we could get bearish dynamic pressure as well. Although on lower time frames we have some bullish rebounding, but even if price will reach 1350 area – it will not change big picture. Situation could change only if market will move above 1400 area.
Grabber pattern is so important right now, because it could turn upside down situation on long-term gold.
We have bearish grabber and it has appeared right at Yearly Pivot Point – this is not best combination to have on your back when previously you thought above upward action. Grabber potentially strong pattern that could lead price back to 1180 lows again, but guys, this is monthly chart. We could get a lot of significant action inside of grabber’s range without breaking it. That’s what I’m talking about recent upward action on new tensions around Ukraine.
Although currently it’s a bit early to speak about it, but long term upside target stands around yearly PR1. We know that gold likes to re-test previously broken lows and consolidations. 1540 area is monthly overbought, YPR1 and low border of broken long-term rectangle. As market was strongly oversold, very often it has tendency to reach overbought. Market is an impulse substance and reaction equals to counter reacion.
That’s being said – in nearest future we could expect some deeper retracement up, may be even to 1350 area, but inside stop grabber’s swing and even this significant move up hardly will lead to changing of long-term picture. Only some unexpected geopolitical tensions could lead to significant appreciation of gold market, since as SDPR recent data as US economy data suggests further gold weakness.
Weekly
Currently guys, I wouldn’t make any long-term forecasts here. Previously we’ve mentioned that market has failed all potentially bullish patterns – B&B, Double Bottom, moved below MPP of April. Trend has turned bearish. All these moments do not add points to long-term bullish perspectives. But, at the same time, in our updates on previous week we’ve said that if market will hold above 1280 – there will be some chances on upward action of different distance – 1315 or may be even 1350$. And now we see that two side-by-side hammer patterns were formed right at major Fib support area. Also we could recognize some hints on the shape of reverse H&S pattern here, but with huge lack of harmony. Another bullish sign – market has tested MPP on Friday and bounced up. Thus, although long-term setup still look bearish, in shorter-term perspective market could show some upward action, even to 1350, but it will not destroy bearish pattern. Thus, we should treat it as retracement by far, that could slightly postpone starting of downward action.
Daily
Here we have to major moments for discussion. First is – market has held above 1280 area, the crucial area in our understanding for the bulls, and bulls were able to stay in the game. Second – we’ve got 2-day stop grabber. This pattern suggests taking out of previous highs around 1307. On 4-hour chart we can estimate target with more precision. Our bullish invalidation point stands the same by far – current lows around 1280, because at least theoretically we could get butterfly “buy” as well, since it is also corresponds to current price shape here…
4-hour
Trend has turned bullish here. 4-hour chart better shows possible nearest upward target. It stands around 1311 area, very close to WPR1=1312 and daily Fib resistance ~ 1315 area. So, that will be kind of Agreement resistance. Since recent action has a shape of reverse H&S, price should not return right back down probably. Otherwise it will start spell like a failure. Some minor retracement – yes, but not right back down to right shoulder’s bottom. Here, guys, you can act twofold. If you’re bearish – wait for either H&S failure or reaching 1315 area. If you’re bullish – then you can try to take long position with 1311-1315 target...
1-hour
Finally gold analysis corresponds to FX analysis on current week and agrees with it in terms of potential USD weakness. Thus, hourly chart shows potential levels for long entry. This is the swing of right shoulder and our working swing. As on EUR 1289-1292 seems as nice area for long entry, since it is also accompanied by WPP. This is rather strong support and really bullish market should not break it down, especially because this is exit from right shoulder. Breakout through K-support area will mean that something is wrong with bullish strength and we should not take long position, if this will happen.
Conclusion:
Since gold market stands in strong geopolitical and fundamental storm – price is flirting with very significant crucial level of YPP that potentially could lead to appearing of drastical moments. For example, bearish stop grabber and growing bearish dynamic pressure could drastically shift force balance. That’s why it is better to avoid taking any long-term position on gold right now.
Although long term picture looks bearish, in short term perspective market shows upside rebound that hardly will break long-term situation but could lead to solid retracement up. Our first target is 1311-1315 resistance area, while potentially gold could move even to 1350 area. Still, even 1350 move will not break bearish view and right now should be treated just as postponing of move down. To break long term setup market has to move above 1400 level.
The technical portion of Sive's analysis owes a great deal to Joe DiNapoli's methods, and uses a number of Joe's proprietary indicators. Please note that Sive's analysis is his own view of the market and is not endorsed by Joe DiNapoli or any related companies.

")
