Sive Morten
Special Consultant to the FPA
- Messages
- 18,690
Fundamentals
As Reuters reports, gold dropped on Friday, notching its second consecutive weekly drop, with selling triggered by a sharp rise in the U.S. dollar and analysts' expectation that the Federal Reserve could raise interest rates next year. Platinum group metals also fell on news that some miners in top platinum producer South Africa are returning to work, offering hope that the country's longest and most costly strike could end soon. Heightened geopolitical tensions underpinned bullion prices after Russia's President Vladimir Putin flew to Crimea for parades marking the Soviet victory in World War Two, his first visit since annexing the peninsula from Ukraine.
Pressure on gold came from the euro's sharp decline off a 2-1/2 year high against the dollar extended for a second day, after European Central Bank chief Mario Draghi on Thursday threatened more monetary stimulus. The macro environment continued to weigh down on gold this week, as the ECB chief's comment led to a dollar rally, said Christopher Louney, precious metals analyst at Barclays Capital. "Temporary bouts of strength have driven it above the $1,300 an ounce level several times recently, but we continue to think the underlying fundamentals still point downwards," Louney said.
Spot gold was down 0.1 percent at $1,287.51 an ounce by 3:16 p.m. (19:16 GMT). Solid support at its 100-day moving average of $1,287 an ounce kept gold from falling further, dealers said. Gold was down 1 percent this week, after prices tumbled on Wednesday after Fed Chair Janet Yellen said a high degree of monetary accommodation was warranted given "considerable" slack in the U.S. labor market and low inflation. Yellen's comment did not alter a consensus that the Fed will start to raise interest rates around July 2015 after completely unwinding its stimulus later this year. In the physical market, gold premiums in India, the world's second-biggest bullion consumer, slipped this week as demand eased on expectations of a relaxation in import curbs.
South African platinum producer Lonmin Plc is preparing to restart operations next week after taking its latest wage offer directly to striking miners. In addition, the National Union of Mineworkers (NUM) said many of its workers were returning to Anglo American Platinum's Rustenburg operations that have been hit by a 15-week strike by the rival AMCU union.
Monthly
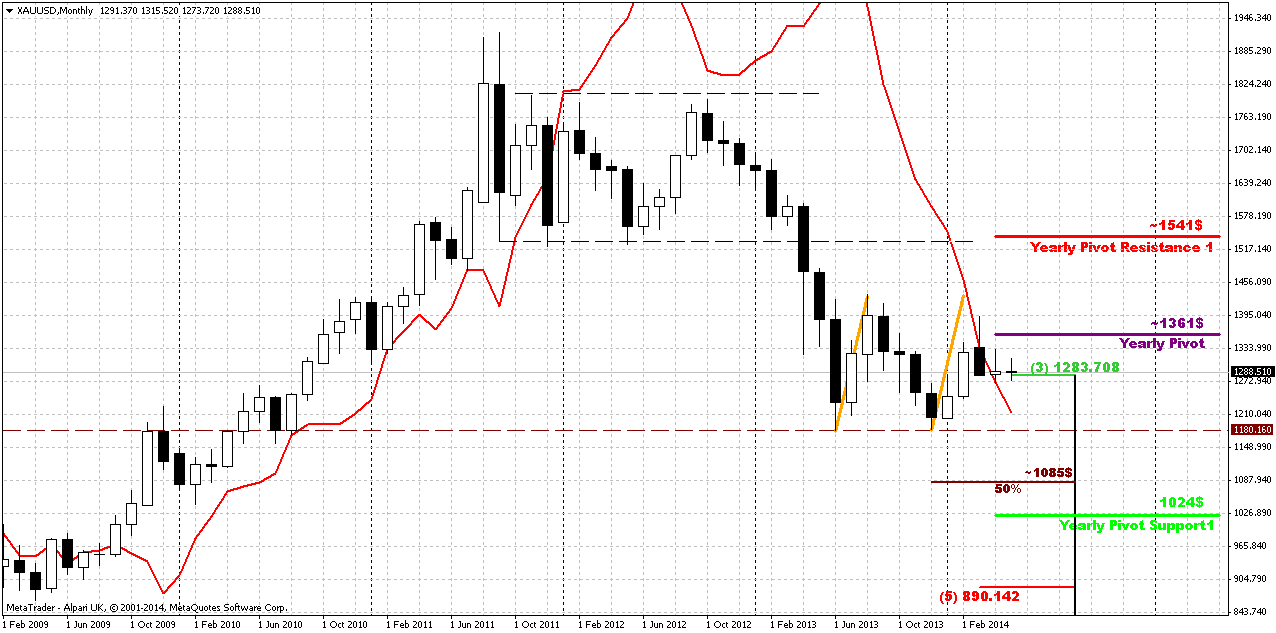
In recent couple of weeks we do not see any drastical action on gold. April range was very small and May one even narrower by far. Thus, all thoughts that we’ve discussed previously is still valid and I keep them intact.
Situation on monthly gold is very tricky. In fact, guys, we will have to separate our trading plan for short-term charts and long-term ones. The point is short-term gold lives on its own life, if we can say that, and forms it’s own short term patterns that hardly impact on big picture. While long-term gold now shows time bomb and you do not know whether it will explode or not. I’m speaking about bearish grabber here. Even more, in April market shows very small action. If current tendency will continue then we could get bearish dynamic pressure as well. Although on lower time frames we have some bullish rebounding, but even if price will reach 1350 area – it will not change big picture. Situation could change only if market will move above 1400 area.
Grabber pattern is so important right now, because it could turn upside down situation on long-term gold.
We have bearish grabber and it has appeared right at Yearly Pivot Point – this is not best combination to have on your back when previously you thought above upward action. Grabber potentially strong pattern that could lead price back to 1180 lows again, but guys, this is monthly chart. We could get a lot of significant action inside of grabber’s range without breaking it.
Although currently it’s a bit early to speak about it, but long term upside target stands around yearly PR1. We know that gold likes to re-test previously broken lows and consolidations. 1540 area is monthly overbought, YPR1 and low border of broken long-term rectangle. As market was strongly oversold, very often it has tendency to reach overbought. Market is an impulse substance and reaction equals to counter reacion.
That’s being said – in nearest future we could expect some deeper retracement up, may be even to 1350 area, but inside stop grabber’s swing and even this significant move up hardly will lead to changing of long-term picture. Currently, there are 3 major driving factors on gold - some unexpected geopolitical tensions, inflation and seasonal trend, i.e. spot demand. None of them show significant appreciation. Hence, it is very difficult to take bet on upward reversal on gold market by far.
Weekly
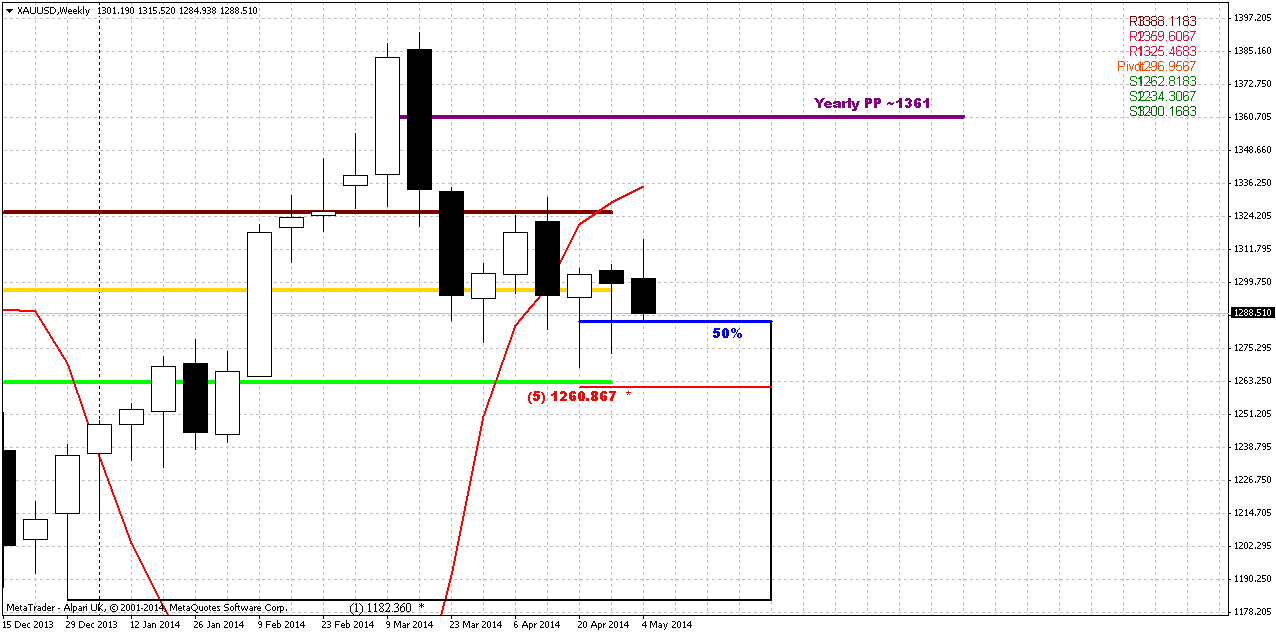
On weekly chart situation is very blur. As we’ve mentioned on previous week – market has not lost chances on upward bounce yet, since it still holds above 1280 area. At the same time, fundamentally we do not see any reasons for significant gold appreciation – inflation is anemic, seasonal trend is bearish and spot demand remains stable. Only geopolitical tensions could lead to gold’s growth, but usually it has limited impact on the market and hardly will lead to strong upward trend.
All that we see here is that market is building in energy since 6 weeks in a row price is coiling in tight area and now this is also MPP. It looks like sentiment is neutral and market still can’t finally choose the direction. Long term situation could change if market will move either above 1400 area or break down and pass through MPS1. Just one thing here seems to be interesting – this is possible bullish dynamic pressure. After solid move up MACD has turned bearish, while price action mostly stands sideways. Theoretically this could lead to strong upward action, but we should get some patterns on daily and 4-hour charts first that will confirm this.
Meantime, as situation on weekly chart stands unclear, we should focus on daily and intraday patterns and setup if we will find any.
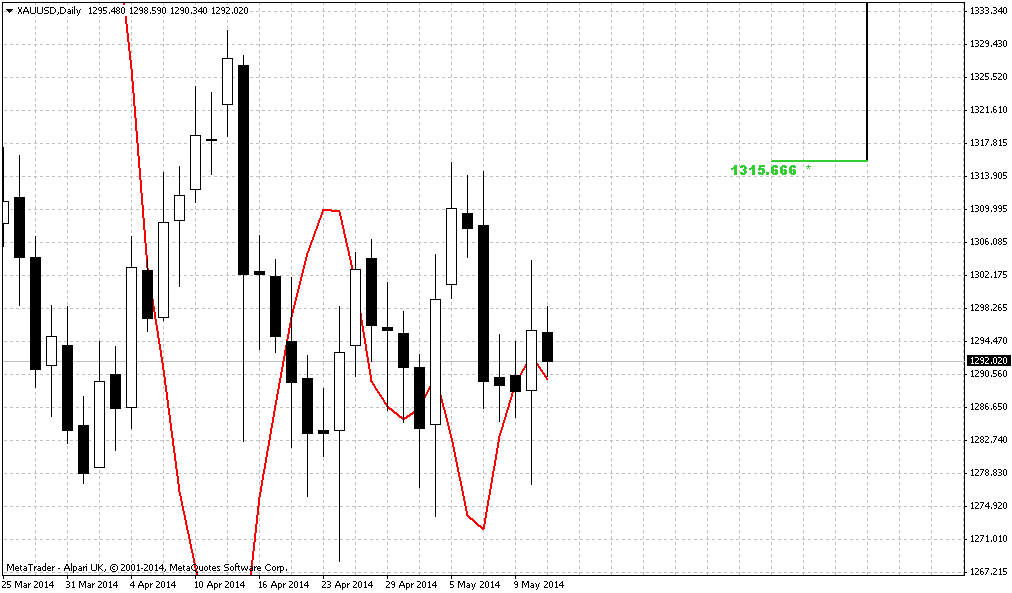
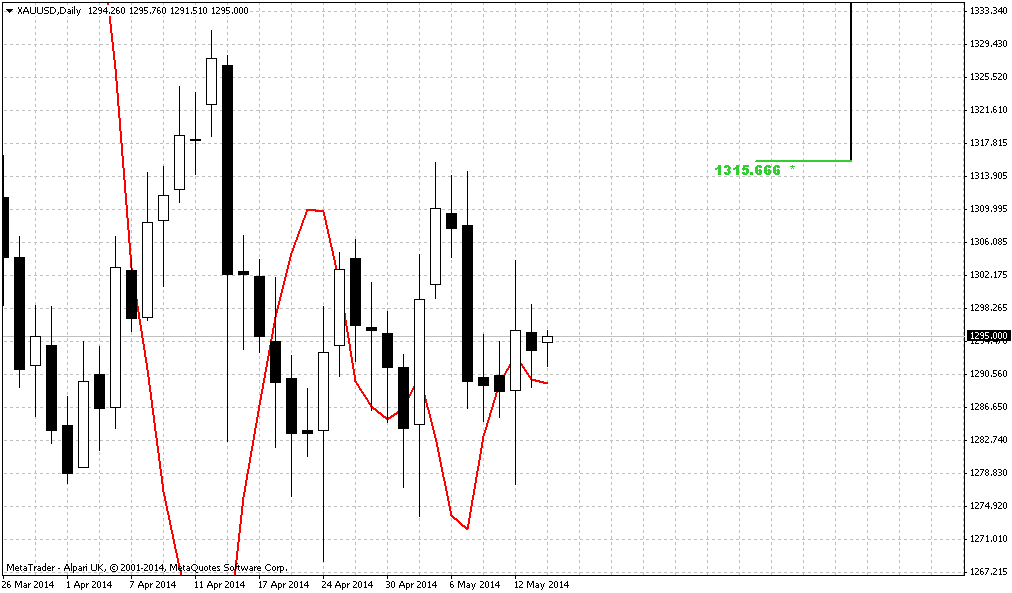
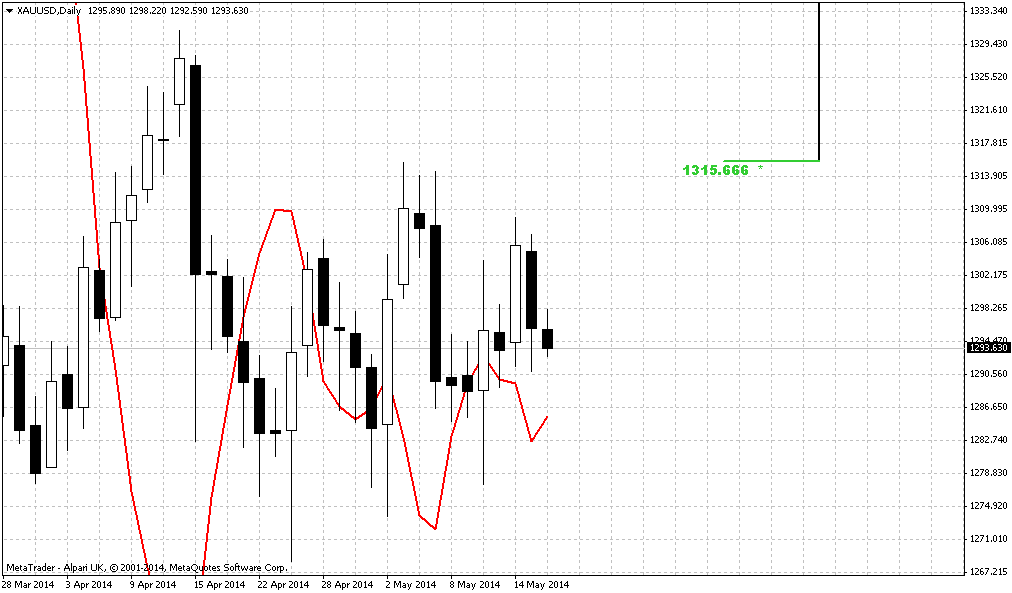
Daily
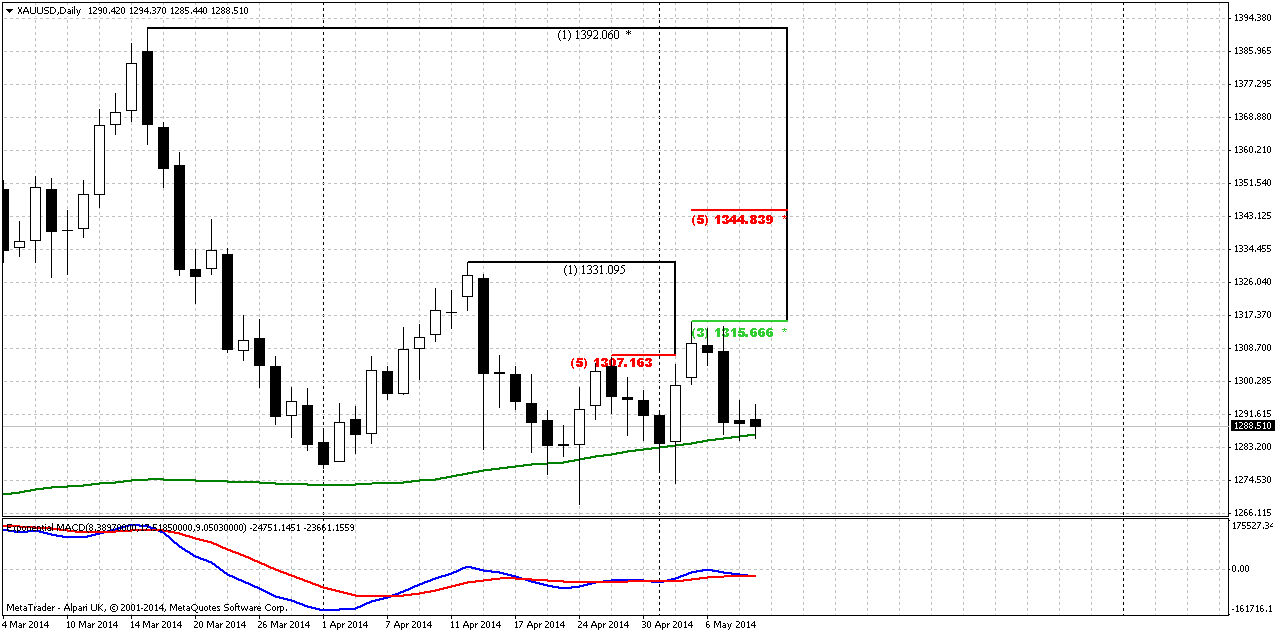
Here we didn’t get our stop grabber that we’ve intended to get – trend simply has shifted bearish. Although first upward action has started with nicely looking hidden bullish MACD Divergence, but right now we have no patterns here. On Friday gold has formed even smaller indecision candle that has become inside session. Action of recent 2-3 week does not add optimism on possible upward continuation – too deep retracements, no impulse action. It seems that market still could show another one small leg up, but by looking at current picture it is difficult to find reasons for suggestion of upward acceleration.
Also I’ve drawn 100-day MA that we’ve mentioned in fundamental part of our research – indeed it holds market recently.
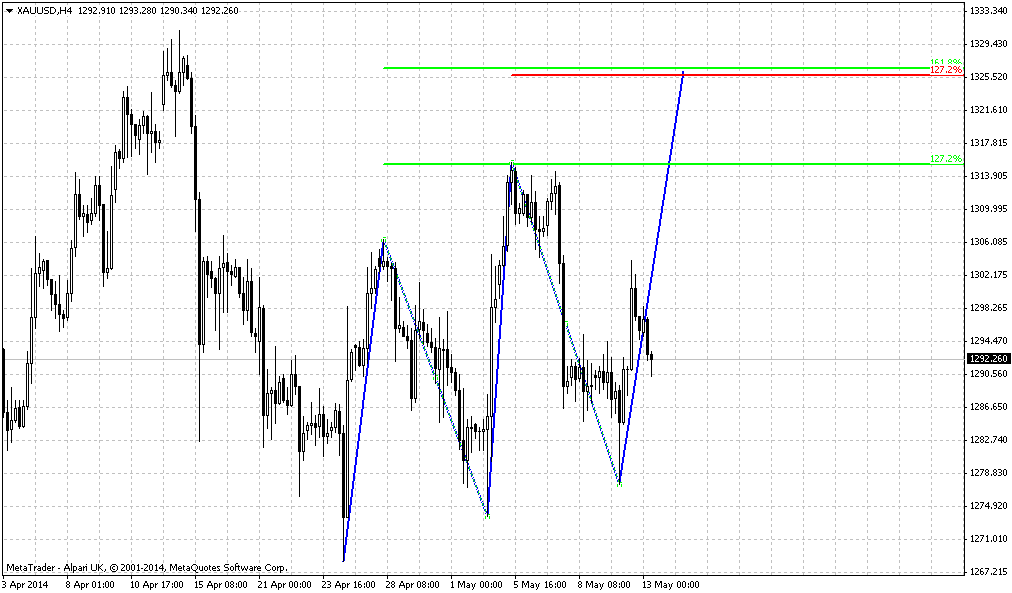
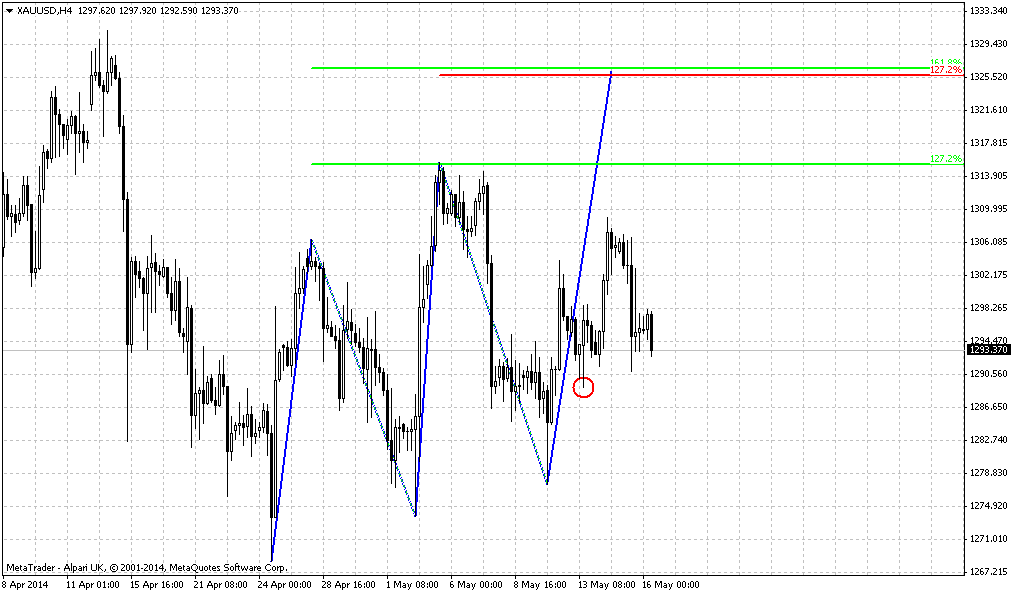
4-hour
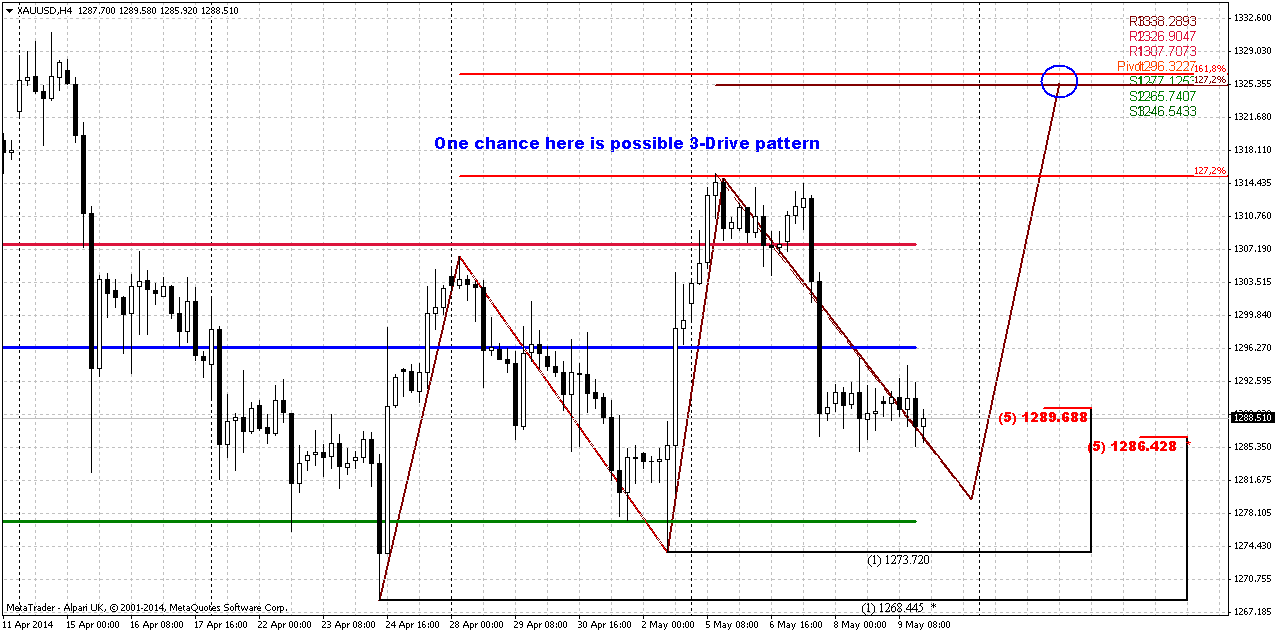
Since it’s all clear by far with long-term perspective – we need breakout either upward or downward, although downward now looks much closer and probable, nevertheless let’s take at short-term patterns. As we said any move below MPS1 and 1280 area will hold us from taking long position, so at least one direction is clear of us. But what to expect and what we could get if price will hold around current levels? One of the patterns that we could get is 3-Drive “sell” with 1325 target. To make it possible price probably should move slightly lower in the beginning of the week and this is very probable because here, on 4-hour chart we have 3 side by side bearish grabbers (not shown on the chart). And then we will see. If market will form around WPS1 some reversal pattern, say H&S or butterfly – that could become a starting point of moving to 1325.
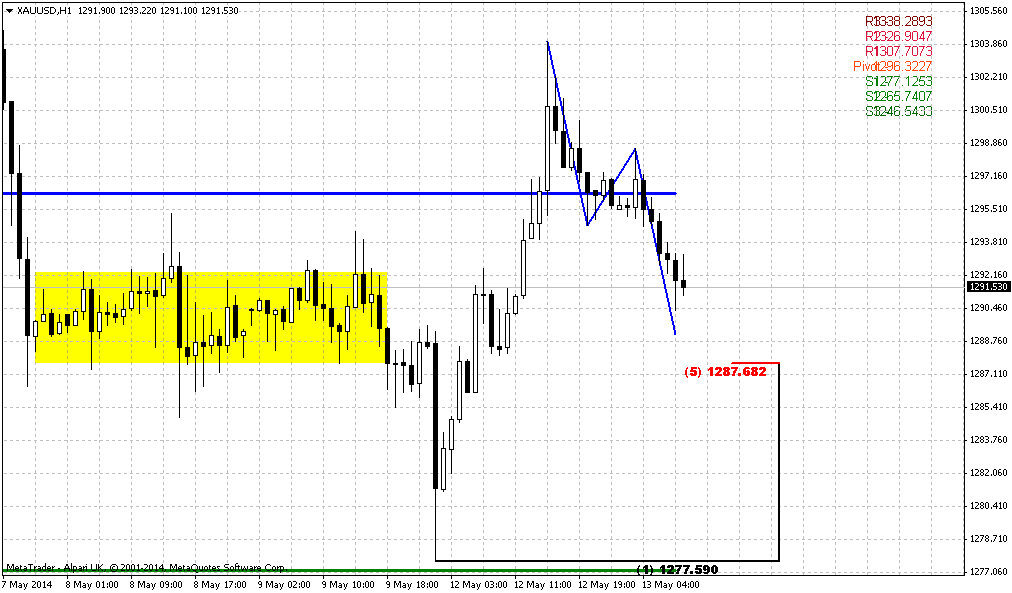
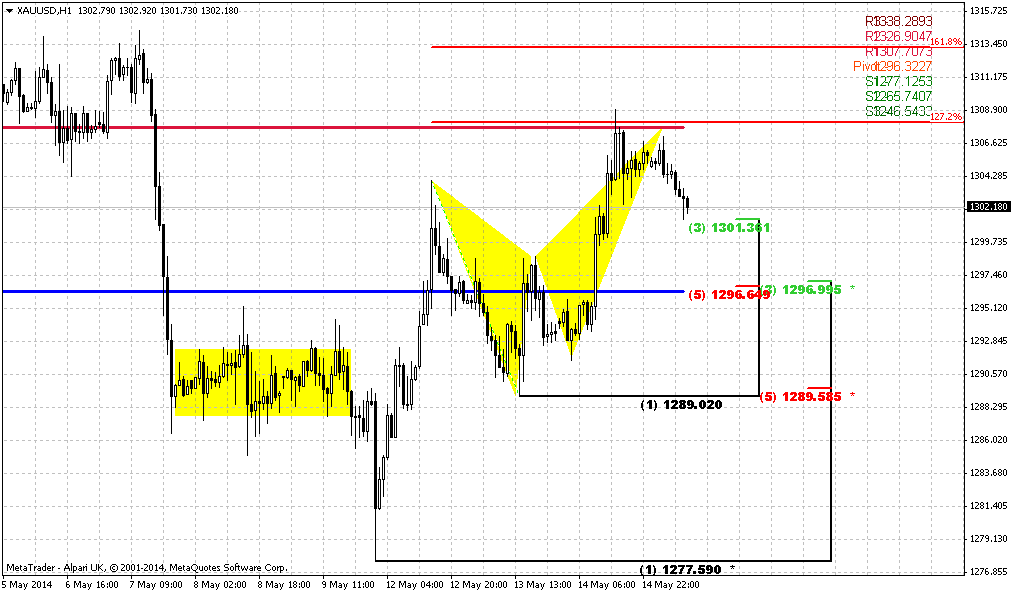
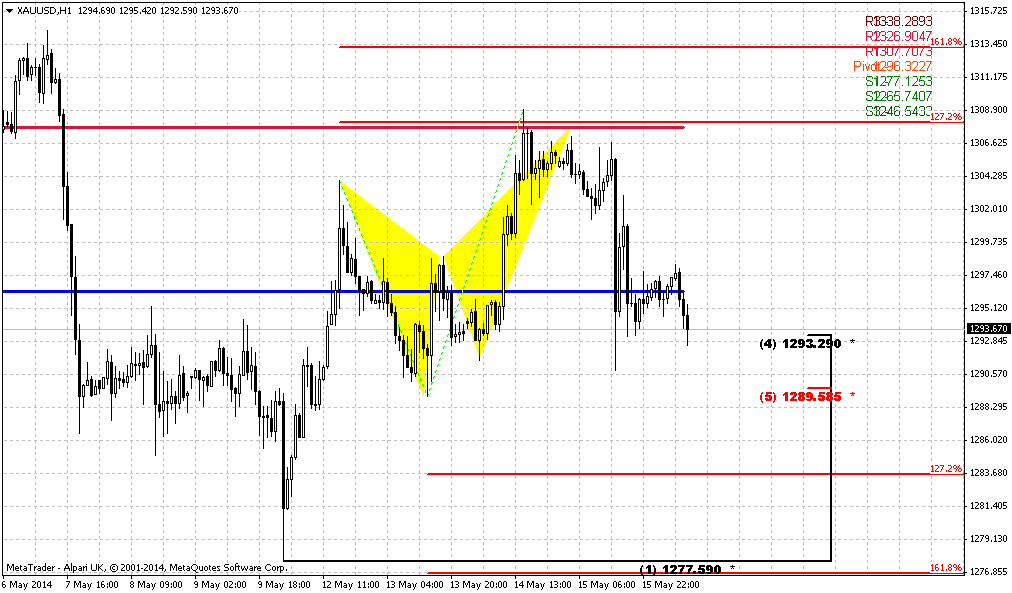
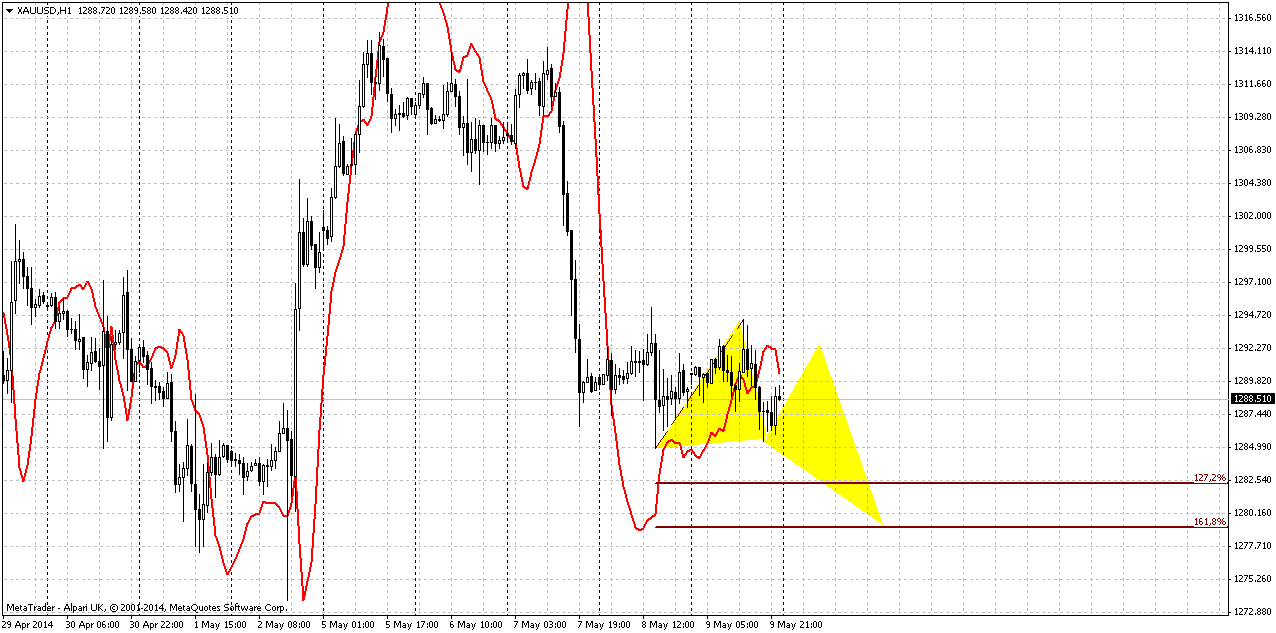
1-hour
For example, it could look like here... Anyway, first step of our trading plan for next week is watching for 1280 area for possible upward reversal patterns. If we will get any – this will increase chances on upward action and may be even on 1325$ 3-Drive “Sell”...
Conclusion:
Market has to breakout either 1400 or 1260 MPS1 to change long-term situation significantly. Until this will not happen – market has ability for wide fluctuations inside of these range without menace to break long-term sentiment.
In short-term perspective, our major attention will stand on 1280 area and WPS1. If market will hold above it and form any bullish reversal patterns there on Monday-Tuesday – this could lead to appearing of 3-Drive pattern and push price at least to 1325. If this will not happen – breakout through 1280 area and especially through MPS1 will open way to 1180 lows and trigger monthly bearish grabber probably.
The technical portion of Sive's analysis owes a great deal to Joe DiNapoli's methods, and uses a number of Joe's proprietary indicators. Please note that Sive's analysis is his own view of the market and is not endorsed by Joe DiNapoli or any related companies.
As Reuters reports, gold dropped on Friday, notching its second consecutive weekly drop, with selling triggered by a sharp rise in the U.S. dollar and analysts' expectation that the Federal Reserve could raise interest rates next year. Platinum group metals also fell on news that some miners in top platinum producer South Africa are returning to work, offering hope that the country's longest and most costly strike could end soon. Heightened geopolitical tensions underpinned bullion prices after Russia's President Vladimir Putin flew to Crimea for parades marking the Soviet victory in World War Two, his first visit since annexing the peninsula from Ukraine.
Pressure on gold came from the euro's sharp decline off a 2-1/2 year high against the dollar extended for a second day, after European Central Bank chief Mario Draghi on Thursday threatened more monetary stimulus. The macro environment continued to weigh down on gold this week, as the ECB chief's comment led to a dollar rally, said Christopher Louney, precious metals analyst at Barclays Capital. "Temporary bouts of strength have driven it above the $1,300 an ounce level several times recently, but we continue to think the underlying fundamentals still point downwards," Louney said.
Spot gold was down 0.1 percent at $1,287.51 an ounce by 3:16 p.m. (19:16 GMT). Solid support at its 100-day moving average of $1,287 an ounce kept gold from falling further, dealers said. Gold was down 1 percent this week, after prices tumbled on Wednesday after Fed Chair Janet Yellen said a high degree of monetary accommodation was warranted given "considerable" slack in the U.S. labor market and low inflation. Yellen's comment did not alter a consensus that the Fed will start to raise interest rates around July 2015 after completely unwinding its stimulus later this year. In the physical market, gold premiums in India, the world's second-biggest bullion consumer, slipped this week as demand eased on expectations of a relaxation in import curbs.
South African platinum producer Lonmin Plc is preparing to restart operations next week after taking its latest wage offer directly to striking miners. In addition, the National Union of Mineworkers (NUM) said many of its workers were returning to Anglo American Platinum's Rustenburg operations that have been hit by a 15-week strike by the rival AMCU union.
Monthly
In recent couple of weeks we do not see any drastical action on gold. April range was very small and May one even narrower by far. Thus, all thoughts that we’ve discussed previously is still valid and I keep them intact.
Situation on monthly gold is very tricky. In fact, guys, we will have to separate our trading plan for short-term charts and long-term ones. The point is short-term gold lives on its own life, if we can say that, and forms it’s own short term patterns that hardly impact on big picture. While long-term gold now shows time bomb and you do not know whether it will explode or not. I’m speaking about bearish grabber here. Even more, in April market shows very small action. If current tendency will continue then we could get bearish dynamic pressure as well. Although on lower time frames we have some bullish rebounding, but even if price will reach 1350 area – it will not change big picture. Situation could change only if market will move above 1400 area.
Grabber pattern is so important right now, because it could turn upside down situation on long-term gold.
We have bearish grabber and it has appeared right at Yearly Pivot Point – this is not best combination to have on your back when previously you thought above upward action. Grabber potentially strong pattern that could lead price back to 1180 lows again, but guys, this is monthly chart. We could get a lot of significant action inside of grabber’s range without breaking it.
Although currently it’s a bit early to speak about it, but long term upside target stands around yearly PR1. We know that gold likes to re-test previously broken lows and consolidations. 1540 area is monthly overbought, YPR1 and low border of broken long-term rectangle. As market was strongly oversold, very often it has tendency to reach overbought. Market is an impulse substance and reaction equals to counter reacion.
That’s being said – in nearest future we could expect some deeper retracement up, may be even to 1350 area, but inside stop grabber’s swing and even this significant move up hardly will lead to changing of long-term picture. Currently, there are 3 major driving factors on gold - some unexpected geopolitical tensions, inflation and seasonal trend, i.e. spot demand. None of them show significant appreciation. Hence, it is very difficult to take bet on upward reversal on gold market by far.
Weekly
On weekly chart situation is very blur. As we’ve mentioned on previous week – market has not lost chances on upward bounce yet, since it still holds above 1280 area. At the same time, fundamentally we do not see any reasons for significant gold appreciation – inflation is anemic, seasonal trend is bearish and spot demand remains stable. Only geopolitical tensions could lead to gold’s growth, but usually it has limited impact on the market and hardly will lead to strong upward trend.
All that we see here is that market is building in energy since 6 weeks in a row price is coiling in tight area and now this is also MPP. It looks like sentiment is neutral and market still can’t finally choose the direction. Long term situation could change if market will move either above 1400 area or break down and pass through MPS1. Just one thing here seems to be interesting – this is possible bullish dynamic pressure. After solid move up MACD has turned bearish, while price action mostly stands sideways. Theoretically this could lead to strong upward action, but we should get some patterns on daily and 4-hour charts first that will confirm this.
Meantime, as situation on weekly chart stands unclear, we should focus on daily and intraday patterns and setup if we will find any.
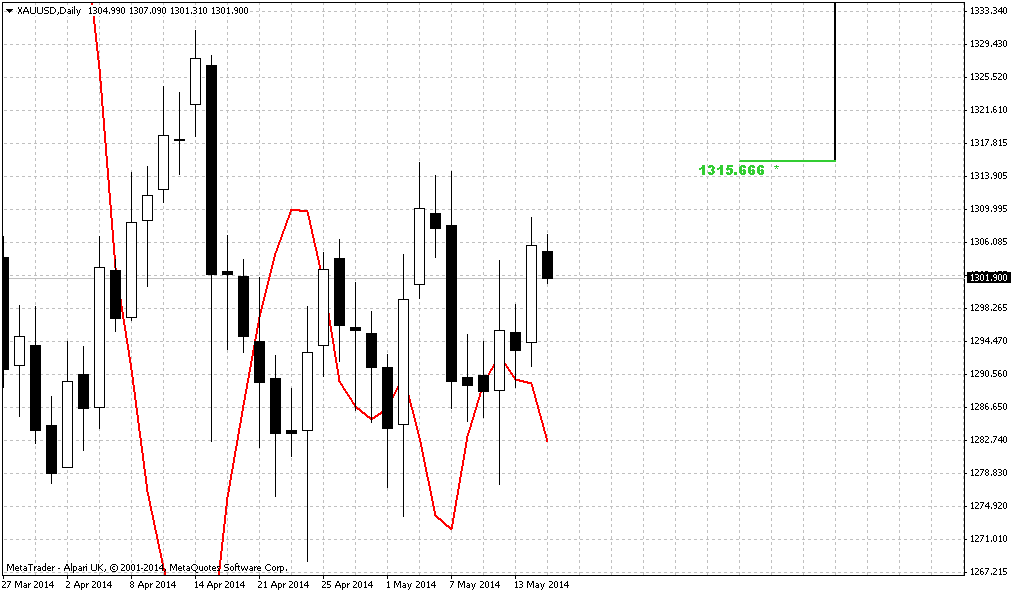
Daily
Here we didn’t get our stop grabber that we’ve intended to get – trend simply has shifted bearish. Although first upward action has started with nicely looking hidden bullish MACD Divergence, but right now we have no patterns here. On Friday gold has formed even smaller indecision candle that has become inside session. Action of recent 2-3 week does not add optimism on possible upward continuation – too deep retracements, no impulse action. It seems that market still could show another one small leg up, but by looking at current picture it is difficult to find reasons for suggestion of upward acceleration.
Also I’ve drawn 100-day MA that we’ve mentioned in fundamental part of our research – indeed it holds market recently.
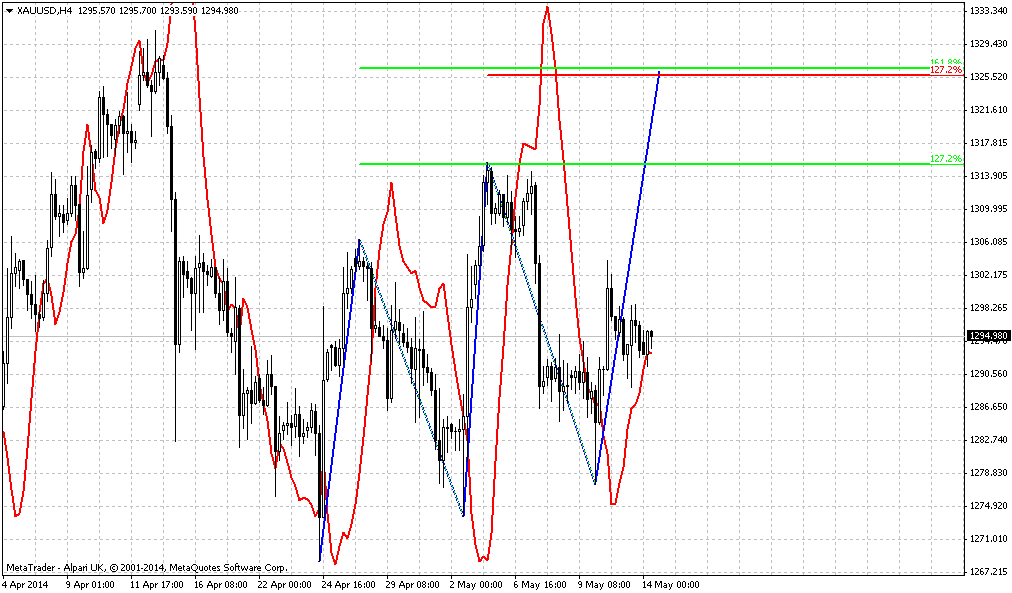
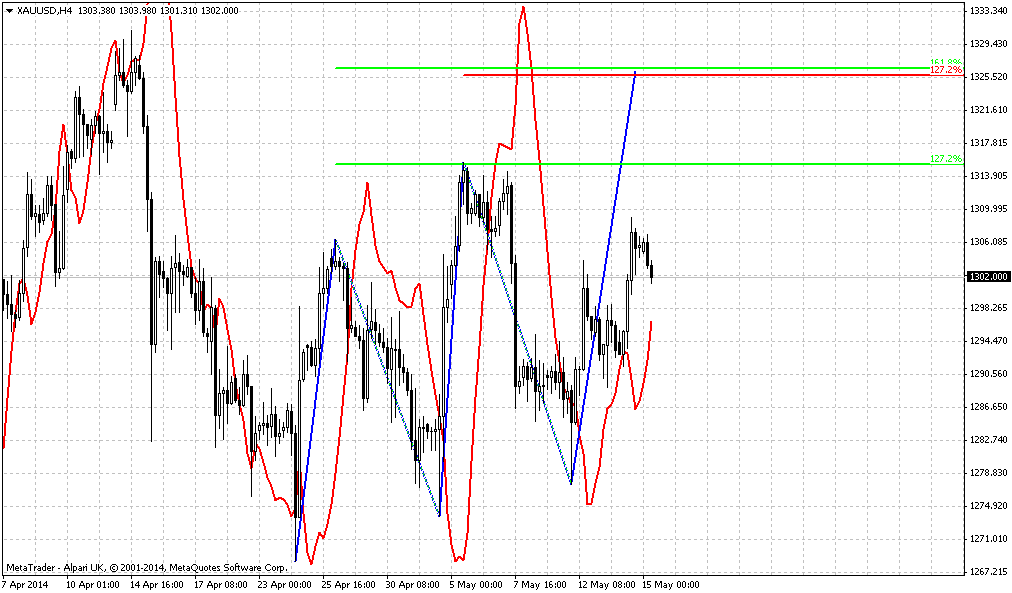
4-hour
Since it’s all clear by far with long-term perspective – we need breakout either upward or downward, although downward now looks much closer and probable, nevertheless let’s take at short-term patterns. As we said any move below MPS1 and 1280 area will hold us from taking long position, so at least one direction is clear of us. But what to expect and what we could get if price will hold around current levels? One of the patterns that we could get is 3-Drive “sell” with 1325 target. To make it possible price probably should move slightly lower in the beginning of the week and this is very probable because here, on 4-hour chart we have 3 side by side bearish grabbers (not shown on the chart). And then we will see. If market will form around WPS1 some reversal pattern, say H&S or butterfly – that could become a starting point of moving to 1325.
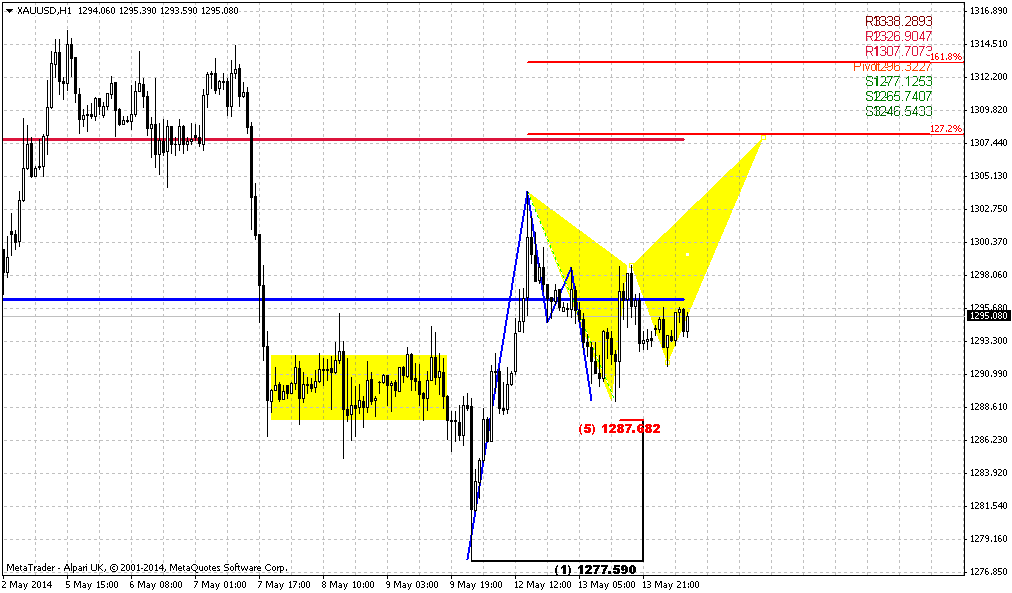
1-hour
For example, it could look like here... Anyway, first step of our trading plan for next week is watching for 1280 area for possible upward reversal patterns. If we will get any – this will increase chances on upward action and may be even on 1325$ 3-Drive “Sell”...
Conclusion:
Market has to breakout either 1400 or 1260 MPS1 to change long-term situation significantly. Until this will not happen – market has ability for wide fluctuations inside of these range without menace to break long-term sentiment.
In short-term perspective, our major attention will stand on 1280 area and WPS1. If market will hold above it and form any bullish reversal patterns there on Monday-Tuesday – this could lead to appearing of 3-Drive pattern and push price at least to 1325. If this will not happen – breakout through 1280 area and especially through MPS1 will open way to 1180 lows and trigger monthly bearish grabber probably.
The technical portion of Sive's analysis owes a great deal to Joe DiNapoli's methods, and uses a number of Joe's proprietary indicators. Please note that Sive's analysis is his own view of the market and is not endorsed by Joe DiNapoli or any related companies.