Sive Morten
Special Consultant to the FPA
- Messages
- 18,673
Fundamentals
Weekly Gold Tading Report prepared by Sive Morten exclusively for ForexPeaceArmy.com
Today we take a look on individual consumption of gold and situation that now stands in India on this subject – world largest consumer of gold. Here is an interesting Reuters’ article:
Fewer auspicious days later this year compelled Ramesh Phalke, an auto company employee in Maharashtra, to hold his daughter's wedding in May. This bride was lucky because many other weddings will likely be postponed - to the dismay of the country's jewellers.
Gold is an essential part of the bride's dowry in India and also a popular gift from family and guests at weddings. In fact, Kerala uses up to 400 grams of gold per wedding, or 80 tonnes each year - which is about 10 percent of the country's total consumption in 2014.
Weddings are one of the biggest drivers of gold purchases in the world's top consumer. But this year the contribution could be smaller as the Hindu calendar shows the number of auspicious dates for weddings will drop 40 percent in the second half from a year earlier.
"Jewellery demand could drop by 30 percent (year-on-year) in the second half due to fewer weddings," said Prithviraj Kothari, vice president of India Bullion & Jewellers' Association (IBJA).
He also expects demand in the second half to come in below first-half levels. The last time this happened was in 2013, according to World Gold Council (WGC) data.
As India meets most of its gold requirements through imports, dwindling local purchases during what should typically be the peak season will dent global prices of the metal, with a looming hike in U.S. interest rates and slower demand from No.2 consumer China further adding to the gloom.
Earlier this year, the WGC had forecast a revival in Indian demand to as much as 900 to 1,000 tonnes in 2015, citing robust economic growth. But an expected slowdown in jewellery sales and forecasts for below-normal monsoon rains that would crimp the spending power of rural buyers are now marring that optimism.
Daman Prakash Rathod, director with Chennai-based wholesaler MNC Bullion, expects jewellery sales in India to soften from mid-June onwards.
SIGNS OF WEAKNESS EMERGE
Signs of weakness in the local gold market have already emerged. Sellers are offering a discount of up to $2 per ounce to London prices to attract buyers, said Kishore Zaveri a gold jeweller based in the western Indian city of Ahmedabad.
But buyers could become even more scarce if erratic weather hits India, driving up food prices and leaving less disposable income with consumers, especially farmers.
Nearly two-thirds of India's need for gold comes from rural areas where jewellery is a traditional store of wealth for millions who have no access to the formal banking system.
Total Indian gold demand could drop to 700 tonnes this year, said IBJA's Kothari. Jewellery sales account for three-fourth of the total, which stood at 811.1 tonnes in 2014.
"In villages, for weddings people will swap old gold jewellery for new. Many people don't have money to buy new jewellery," Kothari said.
Recent CFTC data shows big jump in net long position on gold that could drastically change force balance on the market and our interpretation of recent action. Net long position has increased simultaneously with open interest. Data shows that not just speculative shorts were decreased for ~22 K, but longs position as well jumped for 25K. Hedgers also have increased shorts for 50K contracts and this also confirms an idea of sentiment changes on gold, since hedgers usually take position against the trend.
 Summary:
 Technicals
Monthly
Let see what impact recent upward action has made on monthly chart. Previously we’ve mentioned that gold stands rather flat on monthly chart within second month in a row. But between April standing and May standing is big difference. In May investors are coming to action, at least, CFTC data shows the signs of it, while in April CFTC was absolutely anemic and market was driven by technical and news flows. So, this lets us hope that we will see some acceleration soon. And it looks like this acceleration has started.
Whether recent jump has harmed any of our long-term patterns? Not yet. As bearish dynamic pressure as VOB pattern are still valid.
On long-term horizon we still have last big pattern in progress that is Volatility breakout (VOB). It suggests at least 0.618 AB-CD down. And this target is 1050$. At the same time we need 1130 breakout to start clearly speak on 1050 target.
But what action market should show to break huge bearish patterns on monthly? Dynamic pressure is a tendency of lower highs within bullish trend. Hence, to break it, market should show higher high. I’ve marked it with arrow. It means that market should take out 1308 top to break this pattern and make investors doubt on bearish perspectives of gold market in long term. That’s why action that we have on daily and intraday charts right now is not an action of monthly one yet. Early bell of changing situation could be moving above YPP.
Overall picture still remains mostly bearish. In the beginning of the year market showed solid upside action. Gold was able to exceed yearly pivot, passed half way to Yearly Pivot resistance 1 but right now has reversed down and closed below YPP. From technical point of view this is bearish sign. This could be very significant moment and next logical destination will be yearly pivot support 1 around 1083$.
Currently, despite positive shift in CFTC data, we couldn’t say yet that situation has changed drastically. We need to get few more weeks of net long position increasing, to get positive dynamic on SPDR storages to get confidence with upside action. Other words, we need to get some proves that recent changes is not occasion.
Still right now gold mostly is hostage of dollar value and US economical data (mostly inflation) in nearest perspective. Approximately the same was announced by Fed in forecast on inflation and had become a reason of dovish approach to rate hiking. Another concern right now is too strong dollar that becomes a problem per se for economy growth and kills inflation. Prices are fallen so no needs to hike rates. So, after positive CPI report investors will wait for June Fed meeting.
If we will take into consideration geopolitical situation and risks that have appeared recently, it could happen that situation will change, especially if situation in Ukraine will escalate and peaceful regulation will fail. Day by day we see worrying geopolitical news – Macedonia, Yemen to name some. Unfortunately the geopolicy is sphere where we can’t do much.
That’s being said, as gold has passed through 1200 and until it stands below 1308 top, our long-term next destination point is previous lows at 1130, but since gold is returning to 1130 for second time – this is temporal destination and we should prepare for further downward action. Current upside action currently we should treat as retracement, but it could be really significant on lower time frames.
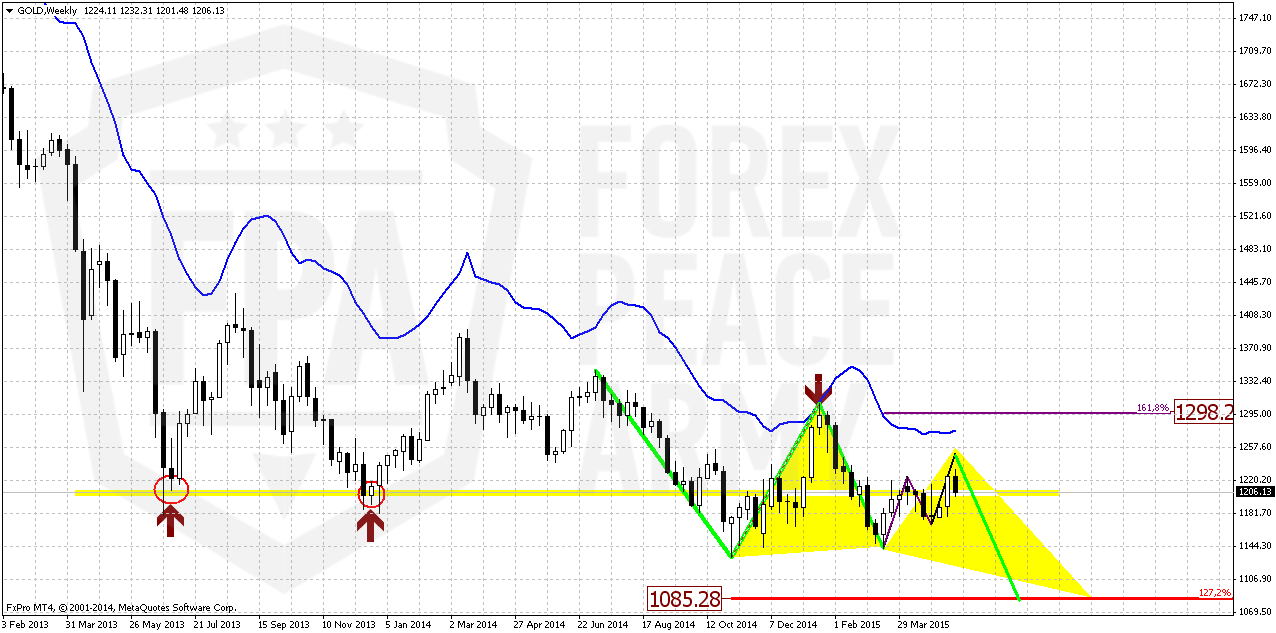
Weekly
Recent upward action has destroyed short-term bearish setup on gold market. During previous 3-4 weeks market has formed number of stop grabbers that suggested downward action to 1140 area. Right now trend on weekly chart has shifted bullish, grabbers were vanished, but is it really shift long-term view on weekly chart?
The fact that market has passed through long-term natural support/resitsance level (marked with circles) makes possible further upward continuation to upper end. But on a road to 1308 area – let’s assume most optimistic scenario, it will meet with solid bariers. First of all, currently gold is forming AB-CD pattern and first destination point will be around 1230-1250 level. There gold will complete AB-CD and hit weekly overbought.
Second interesting observation – if even gold will form 1.618 AB-CD up, it will remain below 1308. This will be second barier, and currently it is very difficult to say whether gold will be able to pass trhough them.
At the same time here we get the clue. We know that retracement will be just till 1298 area, hence any action above it will not be retracement any more. Thus, around this level we will understand whether long-term picture has changed or not.
Meantime, as you can see even 1.618 AB=CD will not destroy butterfly shape and keep valid long-term bearish scenario. That’s why current action is nice and probably tradable on lower charts but here as well as on monthly it does not change situation yet.
Still we’ve got useful AB-CD tool that points on next two targets – 1250 and 1298.
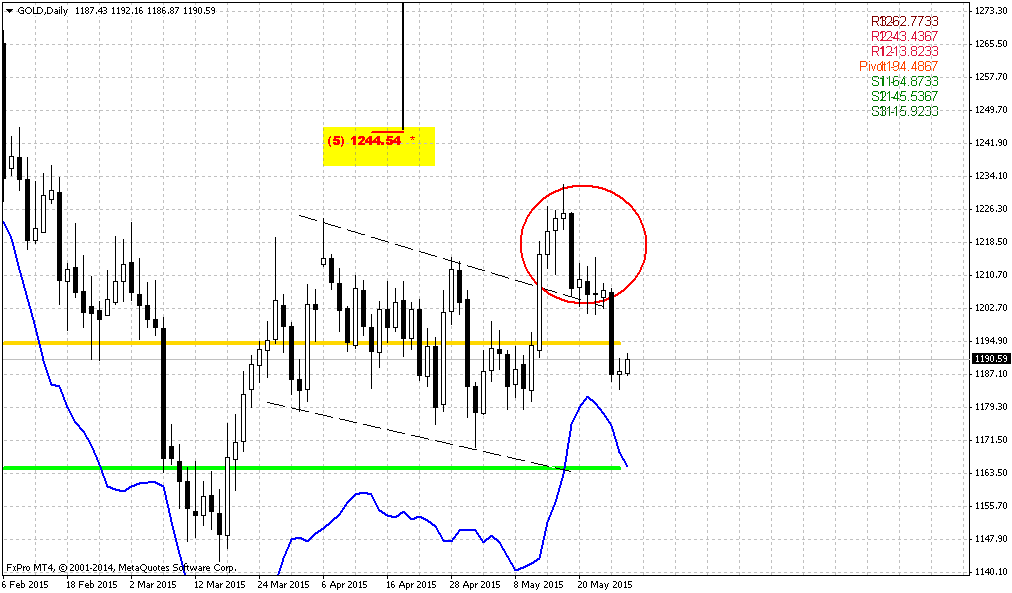
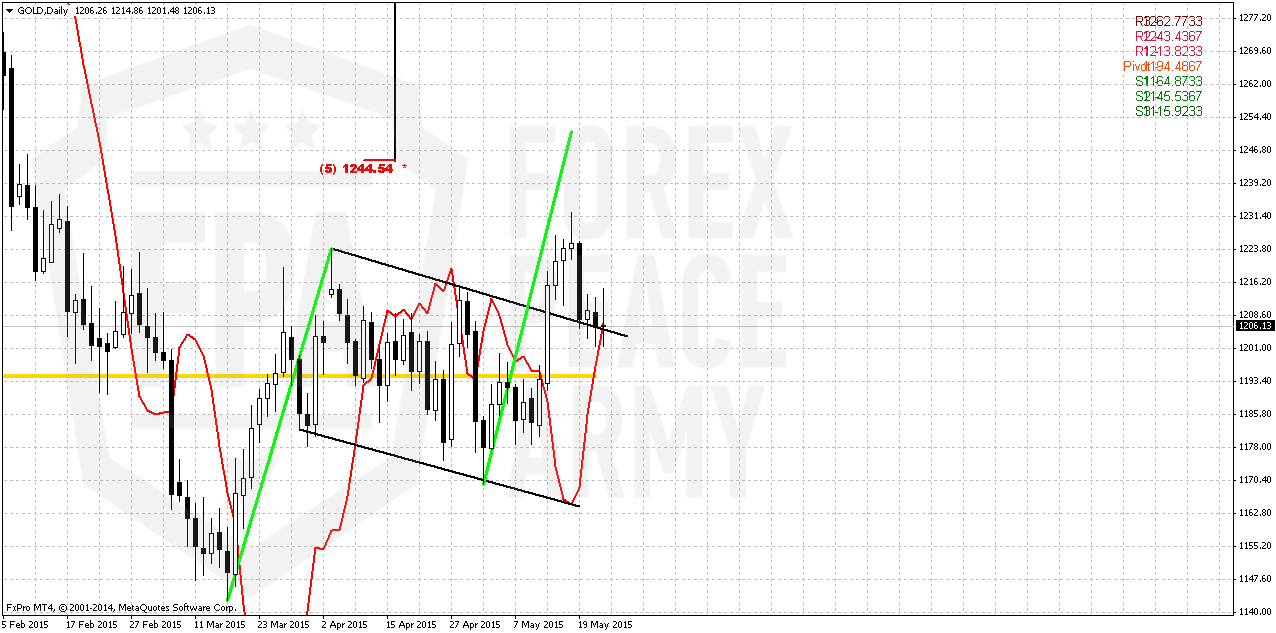
Daily
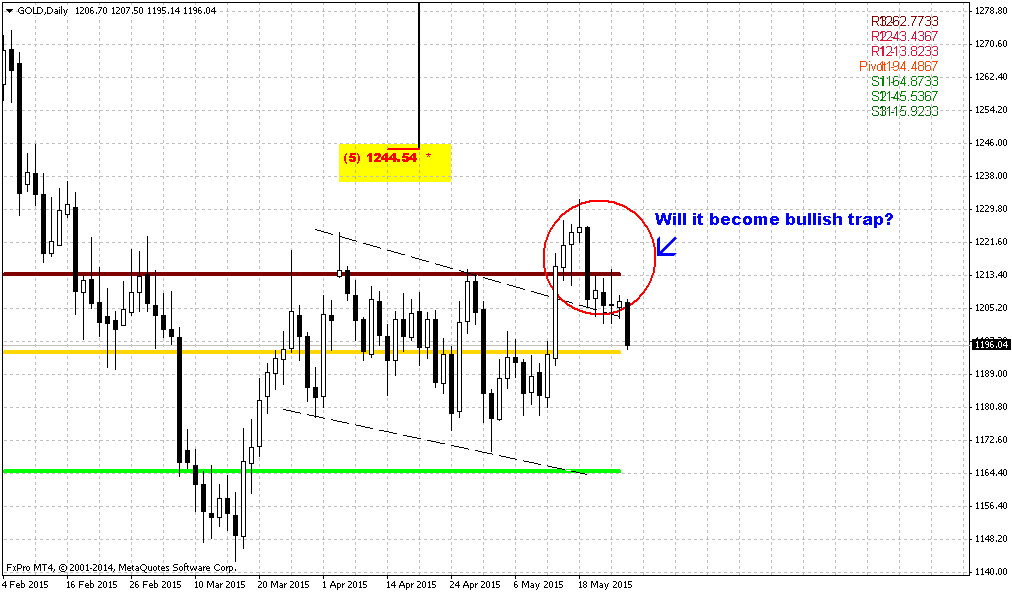
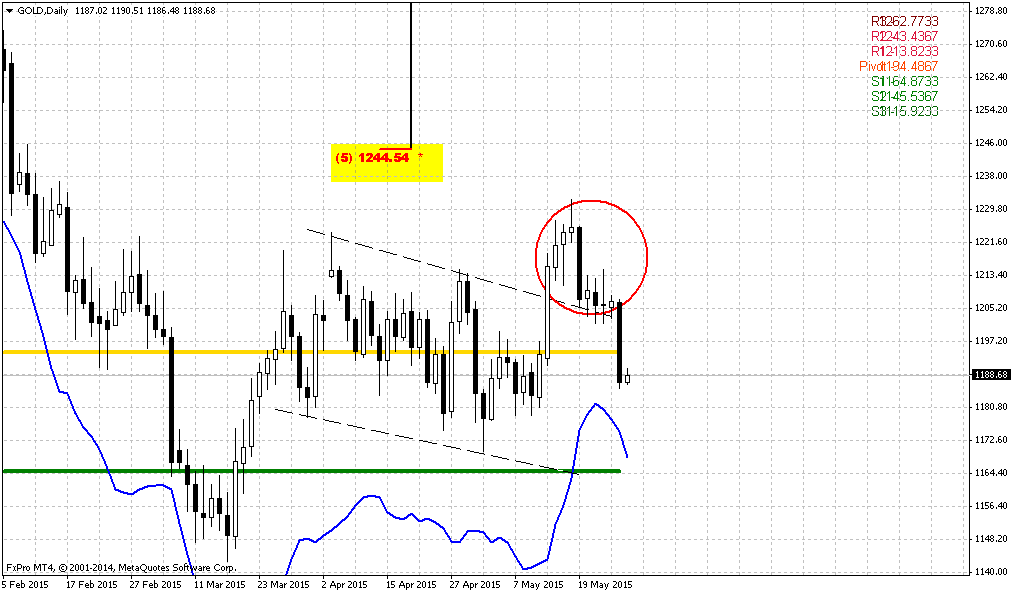
Daily chart is a continuation of weekly one and shows better upside AB-CD pattern. On previous week our major concern was around upside breakout of flag and it’s possible failure since market has met overbought. The major conclusion was – market probably will return back to upper border and if it is really bullish it should hold above it. Any moving back inside the flag will be bearish sign.
So, on daily we just have the same picture – market stands around upper border. We didn’t get bullish grabber that we’ve expected on Friday. Gold has formed doji instead and shows its indecision what to do next.
But at the same time we see positive dynamic in CFTC that significantly increases chances on upside action. May be market will not break through 1308, but it could complete upside AB-CD…
Anyway, we could make the same conclusion here. If you’re bearish – wait returning back inside of flag and then take short on upside retracement. If you’re bullish – aggressive tactics suggests taking long position right here. It will give you better entry point, tighter stop, but also greater chances of loss. Conservative tactics is to wait upside continuation and then enter on some deep. If we wouldn’t get CFTC changes – we definitely wouldn’t take longs here anyway. In fact we have done it on Friday in our comments…
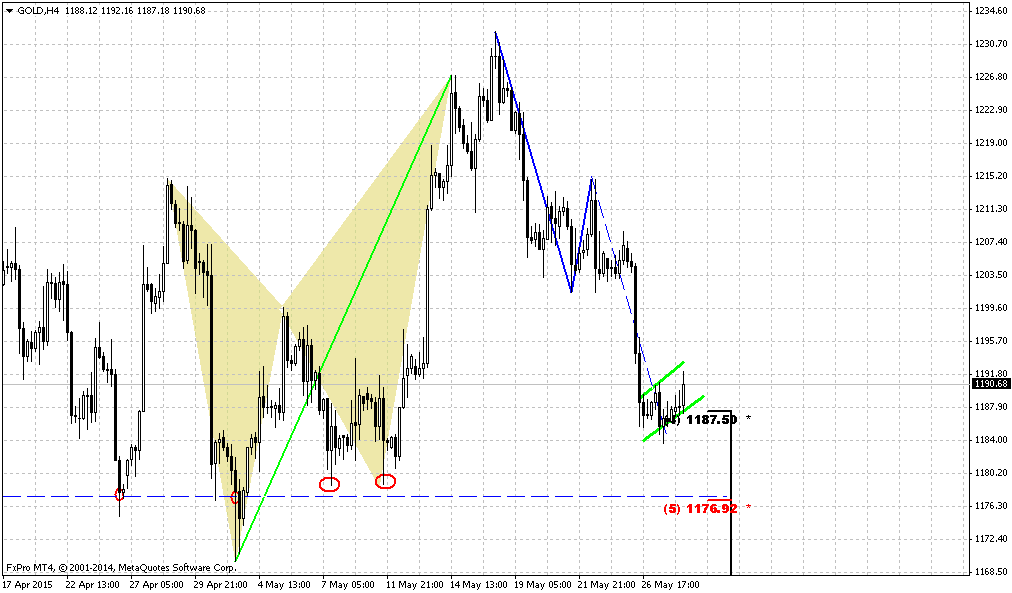
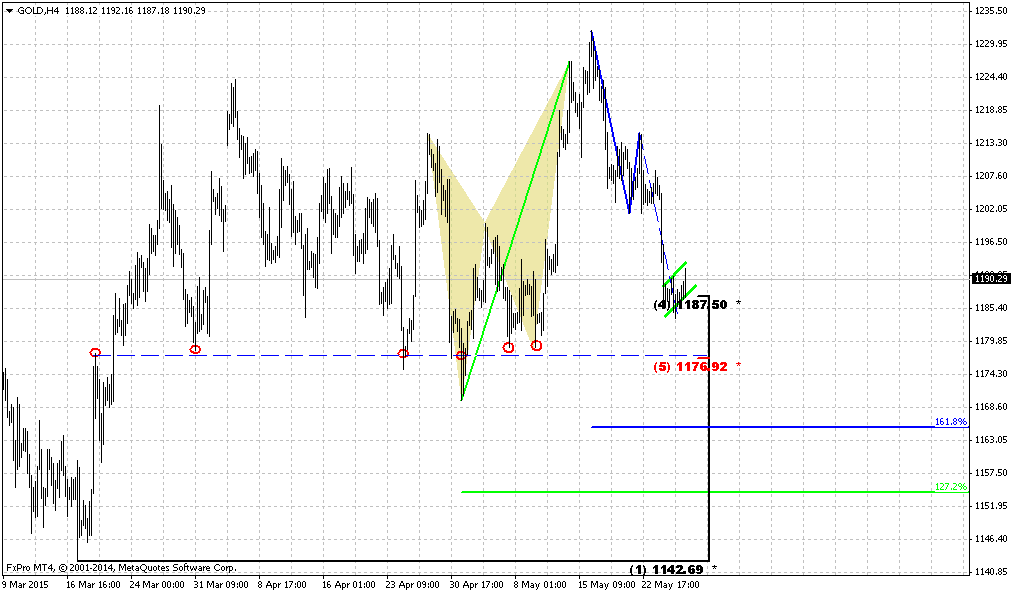
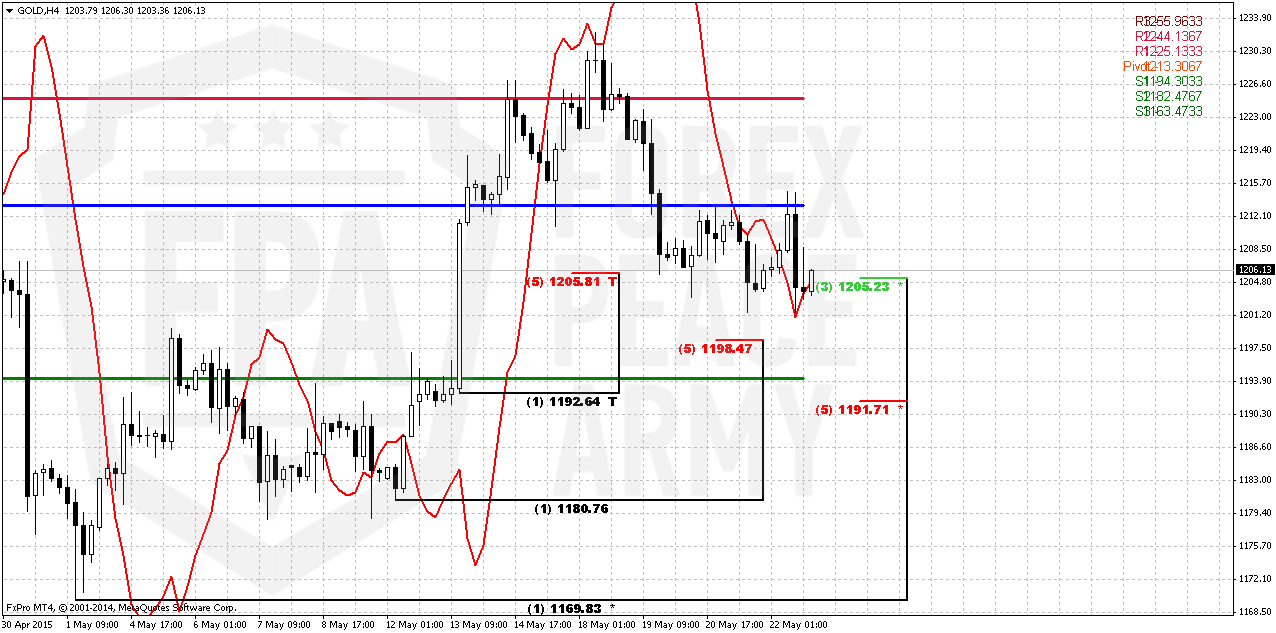
4-hour
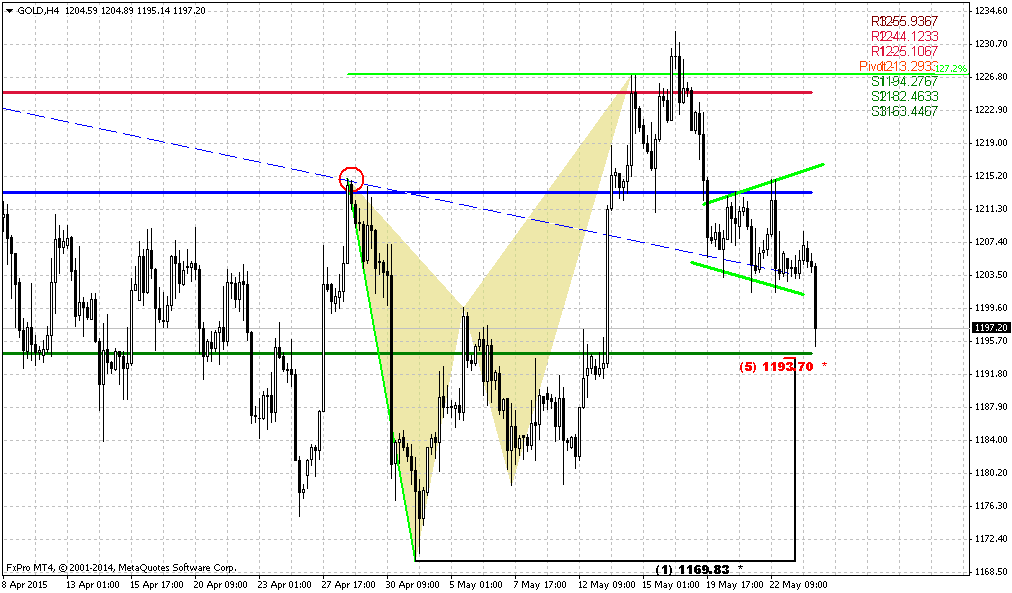
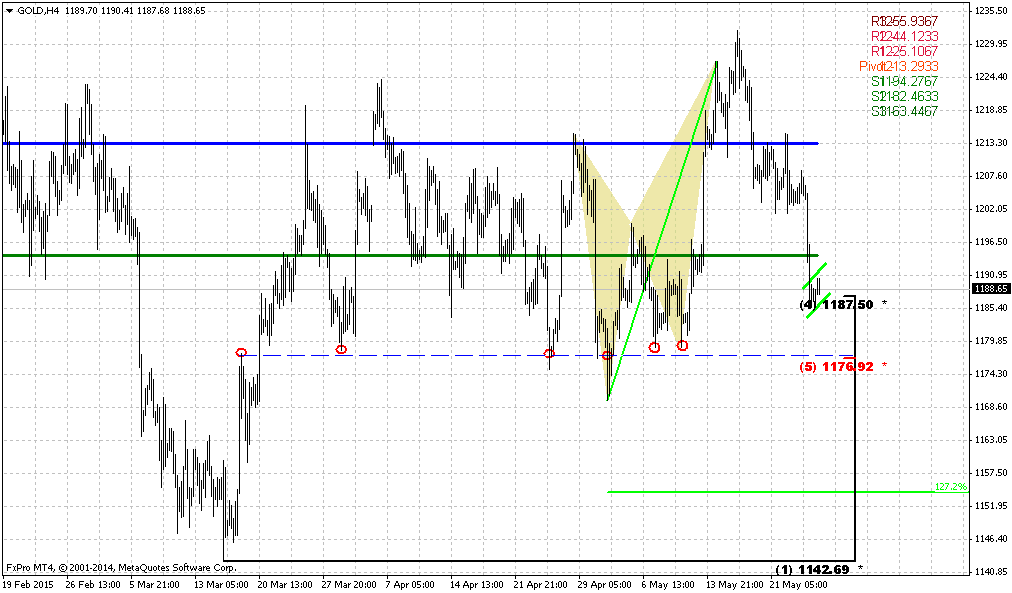
Reaction on CPI report was not as significant as, say, on EUR. Yes, drop has happened but market was able to stay above 1205 key level. Here we also see that this is not just the border of daily flag but also 4-hour K-support area and it still holds market. On Friday market also has formed some bullish grabbers. May be they are minor, but their target stands above WPP and moving above WPP could let market continue move up further from technical point of view.
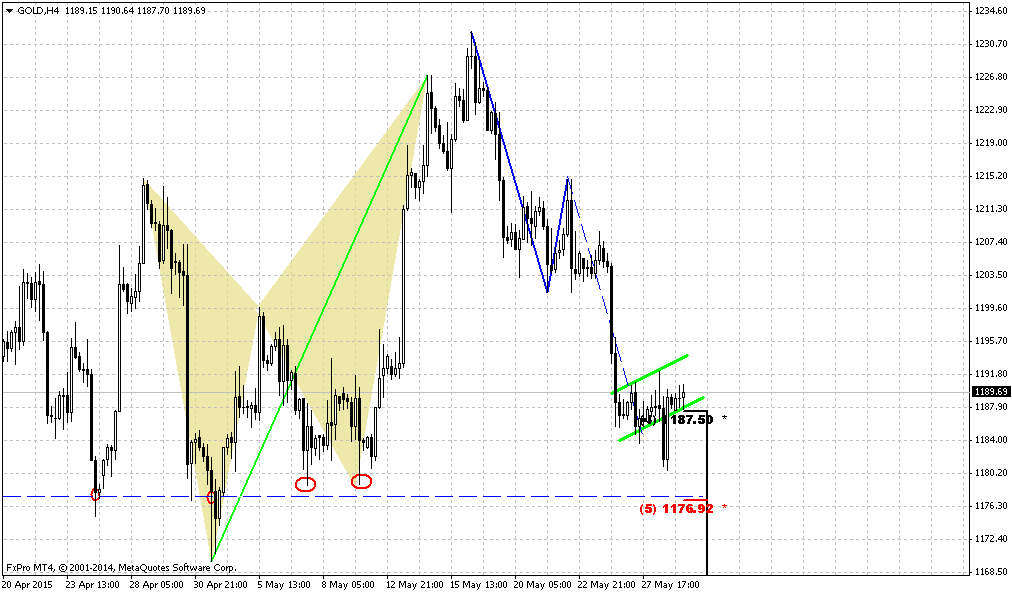
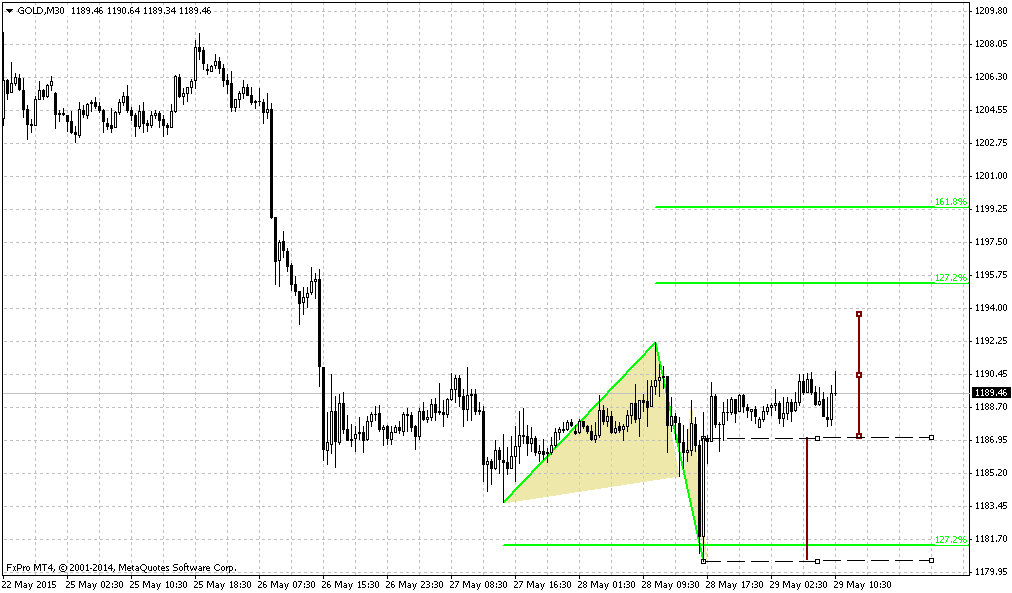
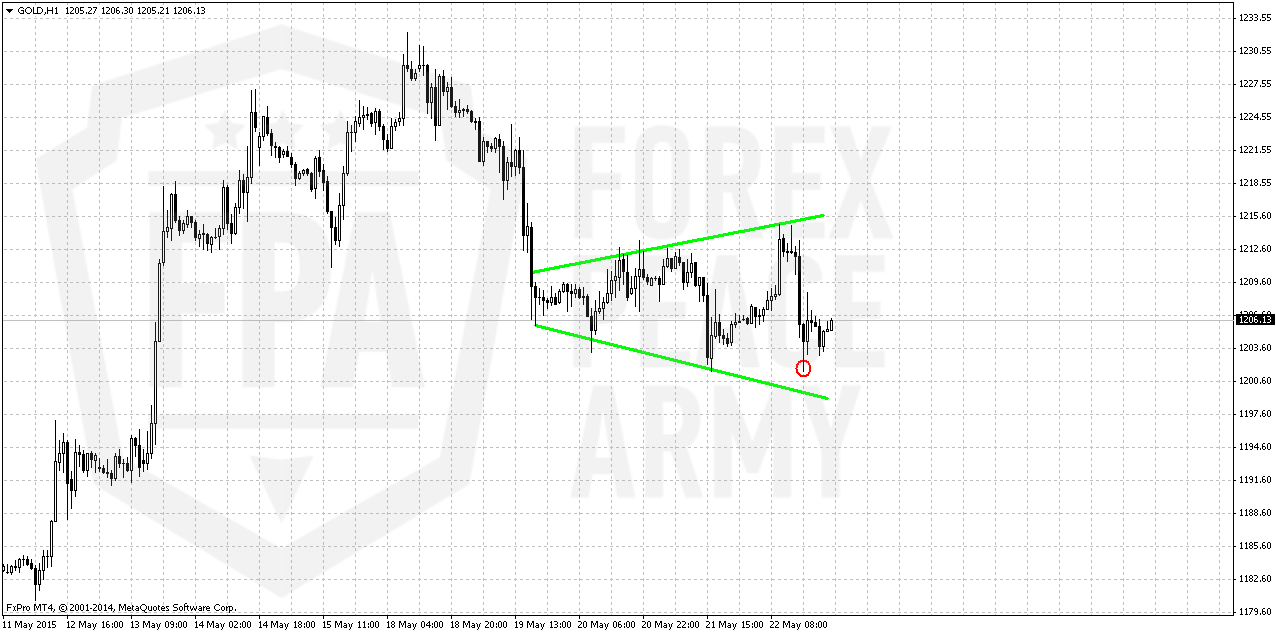
1-hour
Here we see that market is forming broadening bottom, aka megaphone or widening triangle. This pattern very often becomes reversal one, but not always. Usually we should take position when market shows breakout. But here we see important detail. Take a look – gold has not reached lower border of triangle even after CPI data was released. This looks bullish.
Conclusion:
Long-term picture remains bearish and major patterns stand mostly intact. CFTC finally starts to show some action but we need few weeks to be sure that this jump in CFTC is not occasion.
On short-term charts market gold stands at support. Although last week we didn’t dare to call for long entry, since we didn’t see any support from investors’ purchases, now situation starts to changes. In fact, chances of failure of long position here is solid, but at the same time this is best area for taking long from risk/reward point of view.
For those who want to take short position – you need opposite one event, i.e. downward breakout and collapse of bullish setup.
The technical portion of Sive's analysis owes a great deal to Joe DiNapoli's methods, and uses a number of Joe's proprietary indicators. Please note that Sive's analysis is his own view of the market and is not endorsed by Joe DiNapoli or any related companies.
Weekly Gold Tading Report prepared by Sive Morten exclusively for ForexPeaceArmy.com
Today we take a look on individual consumption of gold and situation that now stands in India on this subject – world largest consumer of gold. Here is an interesting Reuters’ article:
Fewer auspicious days later this year compelled Ramesh Phalke, an auto company employee in Maharashtra, to hold his daughter's wedding in May. This bride was lucky because many other weddings will likely be postponed - to the dismay of the country's jewellers.
Gold is an essential part of the bride's dowry in India and also a popular gift from family and guests at weddings. In fact, Kerala uses up to 400 grams of gold per wedding, or 80 tonnes each year - which is about 10 percent of the country's total consumption in 2014.
Weddings are one of the biggest drivers of gold purchases in the world's top consumer. But this year the contribution could be smaller as the Hindu calendar shows the number of auspicious dates for weddings will drop 40 percent in the second half from a year earlier.
"Jewellery demand could drop by 30 percent (year-on-year) in the second half due to fewer weddings," said Prithviraj Kothari, vice president of India Bullion & Jewellers' Association (IBJA).
He also expects demand in the second half to come in below first-half levels. The last time this happened was in 2013, according to World Gold Council (WGC) data.
As India meets most of its gold requirements through imports, dwindling local purchases during what should typically be the peak season will dent global prices of the metal, with a looming hike in U.S. interest rates and slower demand from No.2 consumer China further adding to the gloom.
Earlier this year, the WGC had forecast a revival in Indian demand to as much as 900 to 1,000 tonnes in 2015, citing robust economic growth. But an expected slowdown in jewellery sales and forecasts for below-normal monsoon rains that would crimp the spending power of rural buyers are now marring that optimism.
Daman Prakash Rathod, director with Chennai-based wholesaler MNC Bullion, expects jewellery sales in India to soften from mid-June onwards.
SIGNS OF WEAKNESS EMERGE
Signs of weakness in the local gold market have already emerged. Sellers are offering a discount of up to $2 per ounce to London prices to attract buyers, said Kishore Zaveri a gold jeweller based in the western Indian city of Ahmedabad.
But buyers could become even more scarce if erratic weather hits India, driving up food prices and leaving less disposable income with consumers, especially farmers.
Nearly two-thirds of India's need for gold comes from rural areas where jewellery is a traditional store of wealth for millions who have no access to the formal banking system.
Total Indian gold demand could drop to 700 tonnes this year, said IBJA's Kothari. Jewellery sales account for three-fourth of the total, which stood at 811.1 tonnes in 2014.
"In villages, for weddings people will swap old gold jewellery for new. Many people don't have money to buy new jewellery," Kothari said.
Recent CFTC data shows big jump in net long position on gold that could drastically change force balance on the market and our interpretation of recent action. Net long position has increased simultaneously with open interest. Data shows that not just speculative shorts were decreased for ~22 K, but longs position as well jumped for 25K. Hedgers also have increased shorts for 50K contracts and this also confirms an idea of sentiment changes on gold, since hedgers usually take position against the trend.
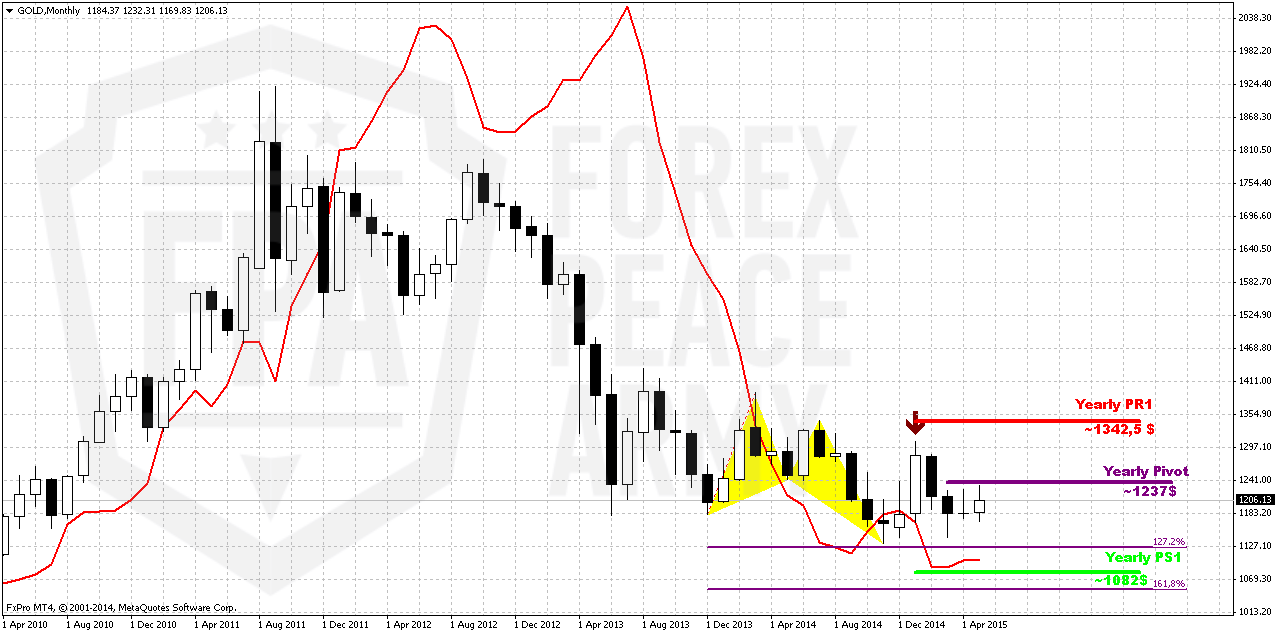
Monthly
Let see what impact recent upward action has made on monthly chart. Previously we’ve mentioned that gold stands rather flat on monthly chart within second month in a row. But between April standing and May standing is big difference. In May investors are coming to action, at least, CFTC data shows the signs of it, while in April CFTC was absolutely anemic and market was driven by technical and news flows. So, this lets us hope that we will see some acceleration soon. And it looks like this acceleration has started.
Whether recent jump has harmed any of our long-term patterns? Not yet. As bearish dynamic pressure as VOB pattern are still valid.
On long-term horizon we still have last big pattern in progress that is Volatility breakout (VOB). It suggests at least 0.618 AB-CD down. And this target is 1050$. At the same time we need 1130 breakout to start clearly speak on 1050 target.
But what action market should show to break huge bearish patterns on monthly? Dynamic pressure is a tendency of lower highs within bullish trend. Hence, to break it, market should show higher high. I’ve marked it with arrow. It means that market should take out 1308 top to break this pattern and make investors doubt on bearish perspectives of gold market in long term. That’s why action that we have on daily and intraday charts right now is not an action of monthly one yet. Early bell of changing situation could be moving above YPP.
Overall picture still remains mostly bearish. In the beginning of the year market showed solid upside action. Gold was able to exceed yearly pivot, passed half way to Yearly Pivot resistance 1 but right now has reversed down and closed below YPP. From technical point of view this is bearish sign. This could be very significant moment and next logical destination will be yearly pivot support 1 around 1083$.
Currently, despite positive shift in CFTC data, we couldn’t say yet that situation has changed drastically. We need to get few more weeks of net long position increasing, to get positive dynamic on SPDR storages to get confidence with upside action. Other words, we need to get some proves that recent changes is not occasion.
Still right now gold mostly is hostage of dollar value and US economical data (mostly inflation) in nearest perspective. Approximately the same was announced by Fed in forecast on inflation and had become a reason of dovish approach to rate hiking. Another concern right now is too strong dollar that becomes a problem per se for economy growth and kills inflation. Prices are fallen so no needs to hike rates. So, after positive CPI report investors will wait for June Fed meeting.
If we will take into consideration geopolitical situation and risks that have appeared recently, it could happen that situation will change, especially if situation in Ukraine will escalate and peaceful regulation will fail. Day by day we see worrying geopolitical news – Macedonia, Yemen to name some. Unfortunately the geopolicy is sphere where we can’t do much.
That’s being said, as gold has passed through 1200 and until it stands below 1308 top, our long-term next destination point is previous lows at 1130, but since gold is returning to 1130 for second time – this is temporal destination and we should prepare for further downward action. Current upside action currently we should treat as retracement, but it could be really significant on lower time frames.
Weekly
Recent upward action has destroyed short-term bearish setup on gold market. During previous 3-4 weeks market has formed number of stop grabbers that suggested downward action to 1140 area. Right now trend on weekly chart has shifted bullish, grabbers were vanished, but is it really shift long-term view on weekly chart?
The fact that market has passed through long-term natural support/resitsance level (marked with circles) makes possible further upward continuation to upper end. But on a road to 1308 area – let’s assume most optimistic scenario, it will meet with solid bariers. First of all, currently gold is forming AB-CD pattern and first destination point will be around 1230-1250 level. There gold will complete AB-CD and hit weekly overbought.
Second interesting observation – if even gold will form 1.618 AB-CD up, it will remain below 1308. This will be second barier, and currently it is very difficult to say whether gold will be able to pass trhough them.
At the same time here we get the clue. We know that retracement will be just till 1298 area, hence any action above it will not be retracement any more. Thus, around this level we will understand whether long-term picture has changed or not.
Meantime, as you can see even 1.618 AB=CD will not destroy butterfly shape and keep valid long-term bearish scenario. That’s why current action is nice and probably tradable on lower charts but here as well as on monthly it does not change situation yet.
Still we’ve got useful AB-CD tool that points on next two targets – 1250 and 1298.
Daily
Daily chart is a continuation of weekly one and shows better upside AB-CD pattern. On previous week our major concern was around upside breakout of flag and it’s possible failure since market has met overbought. The major conclusion was – market probably will return back to upper border and if it is really bullish it should hold above it. Any moving back inside the flag will be bearish sign.
So, on daily we just have the same picture – market stands around upper border. We didn’t get bullish grabber that we’ve expected on Friday. Gold has formed doji instead and shows its indecision what to do next.
But at the same time we see positive dynamic in CFTC that significantly increases chances on upside action. May be market will not break through 1308, but it could complete upside AB-CD…
Anyway, we could make the same conclusion here. If you’re bearish – wait returning back inside of flag and then take short on upside retracement. If you’re bullish – aggressive tactics suggests taking long position right here. It will give you better entry point, tighter stop, but also greater chances of loss. Conservative tactics is to wait upside continuation and then enter on some deep. If we wouldn’t get CFTC changes – we definitely wouldn’t take longs here anyway. In fact we have done it on Friday in our comments…
4-hour
Reaction on CPI report was not as significant as, say, on EUR. Yes, drop has happened but market was able to stay above 1205 key level. Here we also see that this is not just the border of daily flag but also 4-hour K-support area and it still holds market. On Friday market also has formed some bullish grabbers. May be they are minor, but their target stands above WPP and moving above WPP could let market continue move up further from technical point of view.
1-hour
Here we see that market is forming broadening bottom, aka megaphone or widening triangle. This pattern very often becomes reversal one, but not always. Usually we should take position when market shows breakout. But here we see important detail. Take a look – gold has not reached lower border of triangle even after CPI data was released. This looks bullish.
Conclusion:
Long-term picture remains bearish and major patterns stand mostly intact. CFTC finally starts to show some action but we need few weeks to be sure that this jump in CFTC is not occasion.
On short-term charts market gold stands at support. Although last week we didn’t dare to call for long entry, since we didn’t see any support from investors’ purchases, now situation starts to changes. In fact, chances of failure of long position here is solid, but at the same time this is best area for taking long from risk/reward point of view.
For those who want to take short position – you need opposite one event, i.e. downward breakout and collapse of bullish setup.
The technical portion of Sive's analysis owes a great deal to Joe DiNapoli's methods, and uses a number of Joe's proprietary indicators. Please note that Sive's analysis is his own view of the market and is not endorsed by Joe DiNapoli or any related companies.