Sive Morten
Special Consultant to the FPA
- Messages
- 18,695
Fundamentals
Weekly Gold Tading Report prepared by Sive Morten exclusively for ForexPeaceArmy.com
As Reuters reports Gold and silver sank to their lowest since 2010 on Friday as the dollar surged against the yen and other major currencies after the Bank of Japan shocked global financial markets by expanding its massive stimulus spending.
Spot gold broke below $1,180 an ounce, a level bullion had held twice during its last two major sell-offs in June and December last year. It also briefly held the mark earlier this month until Friday's drop.
The yen plunged to a near seven-year low against the U.S. dollar on Friday, putting it on track for its worst day in 18 months, after the Bank of Japan shocked financial markets with an aggressive easing of its monetary policy.
The main reason for gold's fall is the strength in the dollar after the BOJ's desperate efforts to weaken the yen," said Jeffrey Sica, president and chief investment officer at Sica Wealth Management, which oversees $1 billion in client assets.
"Gold could fall further in the short term as the dollar could rise more in the short term, but gold should eventually benefit as a hedge against the uncertainties and economic turmoil brought by central-bank actions," Sica said.
The metal breached important support levels at $1,200 and $1,180, where stop losses - automatic sale orders - were placed and was on track for a 4.8 percent drop this week, the biggest weekly decline since June 2013.
Gold and silver were already facing some heat after the U.S. Federal Reserve earlier in the week largely dismissed financial market volatility as factors that might undercut progress toward its unemployment and inflation goals.
Reflecting bearish investment sentiment, holdings in the SPDR Gold Trust , the world's largest gold-backed exchange-traded fund, fell 0.16 percent to 741.20 tonnes on Thursday, a six-year low.
Still, retail demand remained healthy. U.S. gold coin sales jumped 22 percent in October to their highest since January.
Commercial Longs
 Commercial Shorts
 Open interest
 Source: CFTC, Reuters
CFTC Report shows not drastical changes yet, since plunge has happened mostly 30-31 of October while data was released on 28th of October. We need to see what will happen on next week, whether CFTC data supports recent drop or not.
Monthly
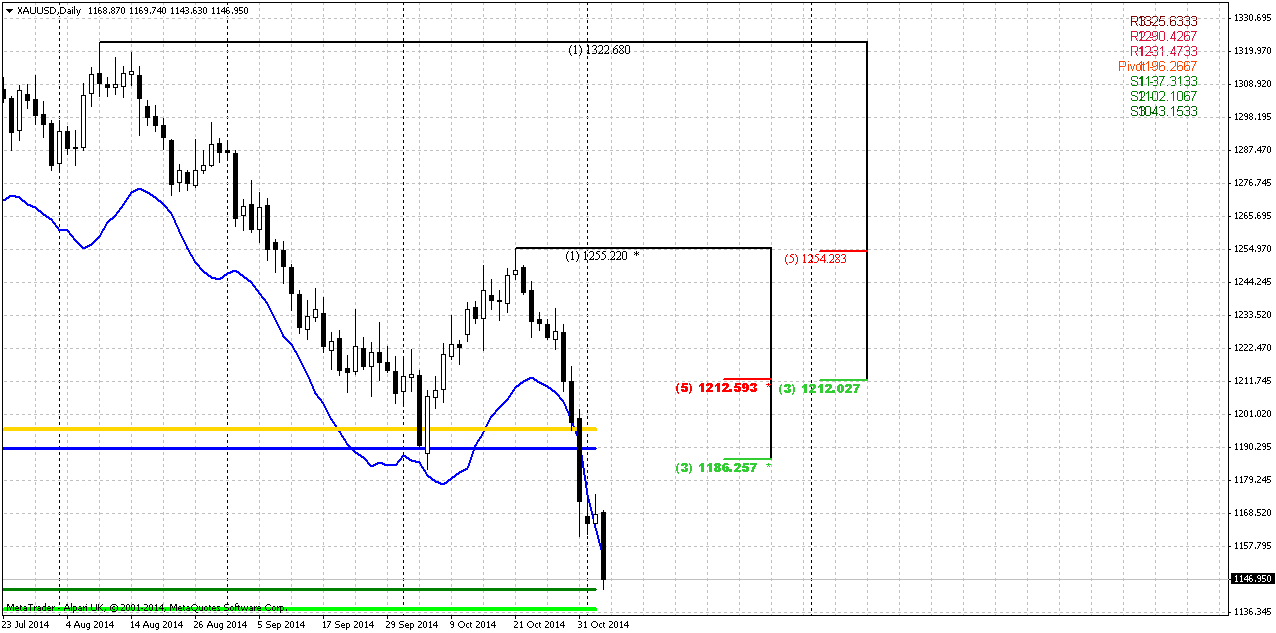
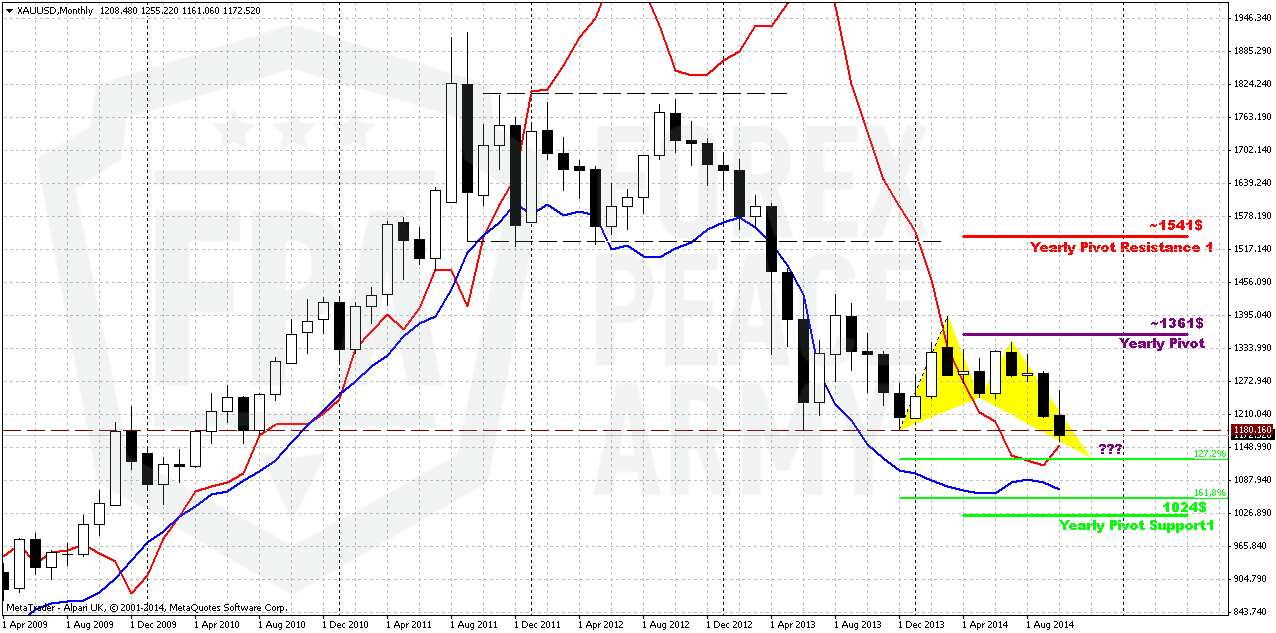
It is a bit surprising but recent miserable plunge down has no solid impact on monthly chart. Monthly picture has not changed significantly and recent action just gives us more confidence with our analysis. The one thing that still has changed – monthly grabber has reached its minimum target and cleared 1180 lows.
As we’ve said on previous week on long term gold we have, let’s call it two big clusters on of analysis. First cluster is “certainty”. It tells that we have two patterns in progress. Frist one is monthly bearish stop grabber, that was completed. Second one is Volatility breakout (VOB) that suggests at least 0.618 AB-CD down. And this target is 1050$. Butterfly pattern that we see on monthly chart is not very important and just shows how this downward action could happen. 1.618 extension of Butterfly coincides with VOB 0.618 AB-CD target.
Second cluster is “uncertainty”. This pack of information rises questions. Whether market will clear 1180, how far market could move below 1180 – 1100, 1050? On first question we’ve got the answer on Friday and here our bet was correct. Market indeed has pssed through 1180. But simultaneously we’ve got another very important information – this breakout does not look like W&R and this is important.
Fundamentally economy data is not really bad, right now is confirmed by US companies earning reports, weak physical demand and anemic inflation – all these moments prevent gold appreciation. Fall of crude oil prices also is supporting factor for economy in long term, because household and industry will get signficant economy on energy expenses, especially on coming winter. Also we have to say that active part seasonal bullish trend will finish in December. Currently it should be mostly active, but right now we see that Asian physical demand is not enough to push market higher, when instituational investors stand flat and do not put money in gold.
Technically during recent rally market was not able to re-test Yearly Pivot. In the beginning of the year market has tested YPP and failed, then continued move down. During recent attempt to move higher – has not even reached YPP again.
But right now the time has come to second question – whether market will break this level and how deep it will fall. Currently we only can try to get hints here and there. Although some traders point on growing individual demand on gold and hope that this could trigger rally on gold. We would say that individual demand is just a part of global annual demand and this demand mostly planned and expected. If even as it was reported has grown for 20%, this is nothing compares to money of institutional investors with big part in futures market. It is not annual well known demand ~5-6K tonnes drives market, it is futures positions. Just imagine how big they are 75 K contracts in net long position. This is 75 K* 100 Oz per contract = 7,5 Mln Oz. ~ 2,3K tonnes. This is 50% of annual demand. But this is just net position. Open interest is 10 times greater. Thus, 20% increase in individual demand just dissolves in huge institutional volumes. Thus, to understand what will happen and how far gold could fall we need keep a close eye on CFTC data because it will warn us about possible changing.
Another factor that could impact on gold market is possible gold buying from SNB. We’ve said about it on previous week:
Swiss gold referendum's support falls short of majority: poll | Reuters
October has closed below 1180 lows, we clearly see here bearish pressure and butterfly holds perfect. This points that right now odds stand in favor of downward continuation in long-term perspective. Gold has not shown any W&R and this is bearish sign.
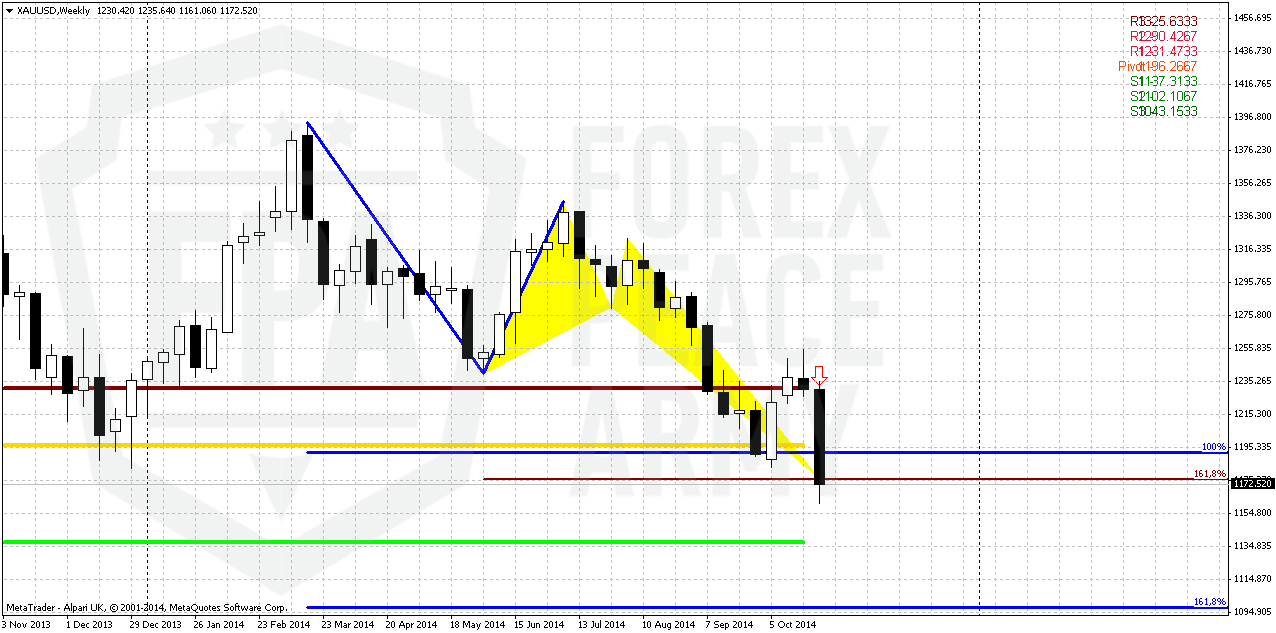
Weekly
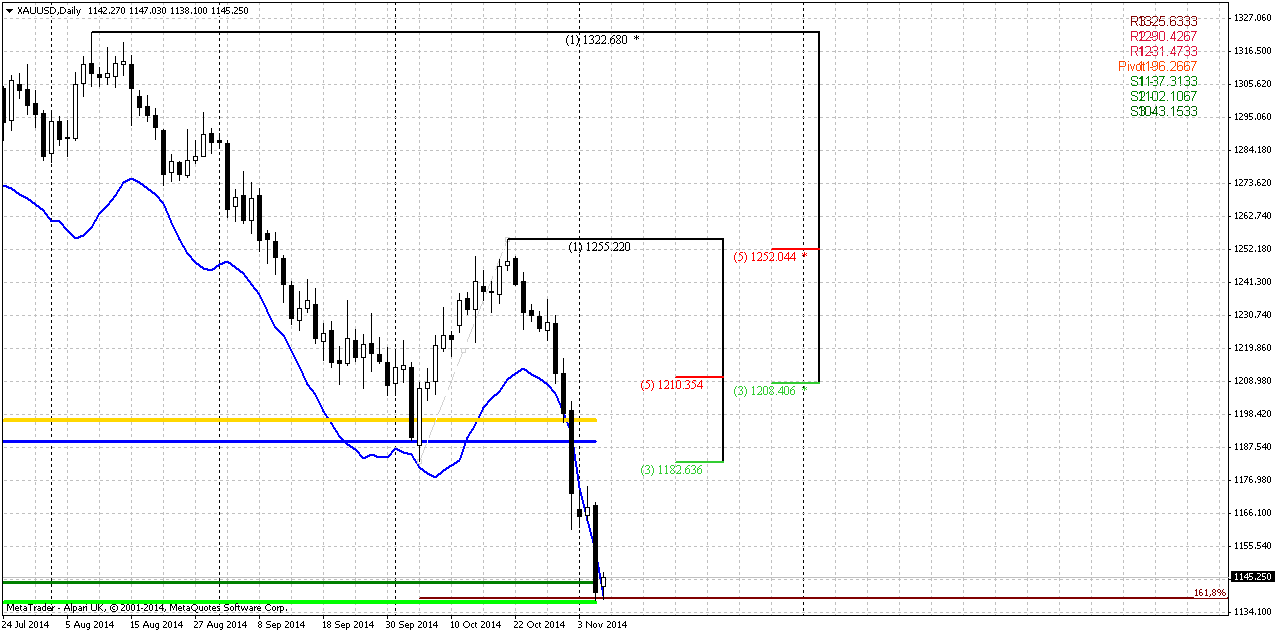
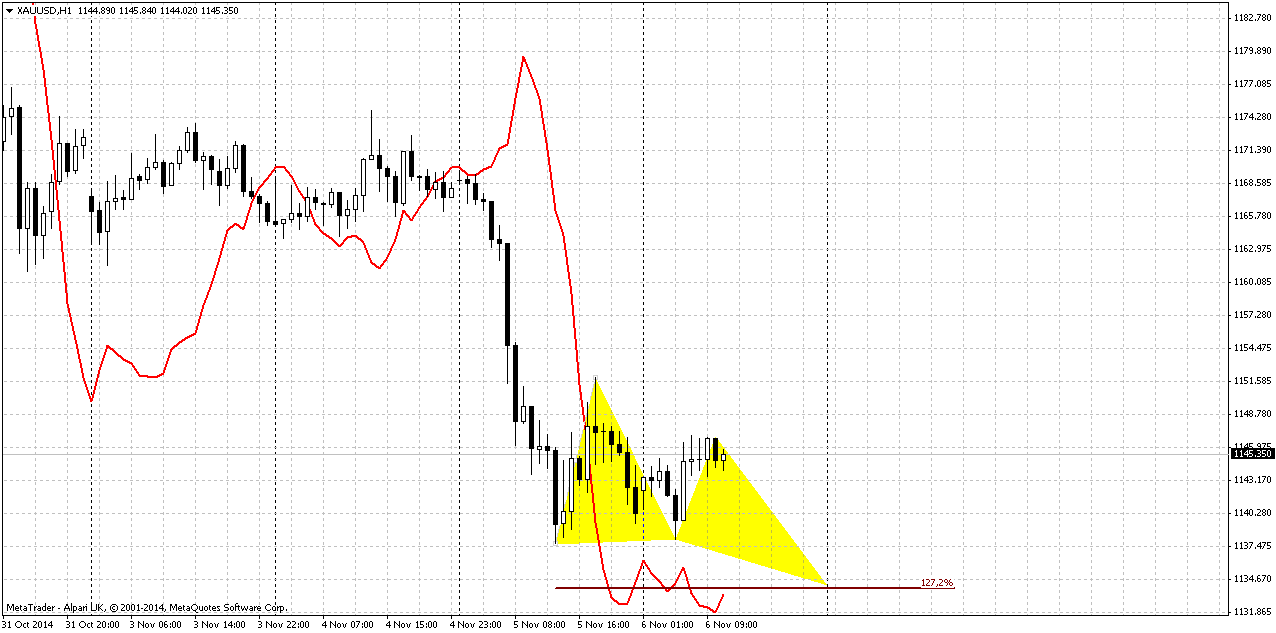
On weekly chart we have rather tricky picture. Trend here is bearish, market is not at oversold. Action down was held by 1155 major 5/8 monthly Fib support. That’s why market has stopped there. Below market we have one after another important targets. 1155 – Fib level, 1137 – MPS1, 1125 – monthly 1.27 butterfly pattern and finally 1100 – 1.618 AB-CD. How price action will develop here?
First of all take a look at recent action. Retracement up was shy, just to re-test 1240 lows and complete bullish ingulfing cent-to-cent, not more. Then we’ve got miserable plunge down. This drop has happened right to 1.618 butterfly point and this is bearish sign that increases chances on downward continuation and butterfly failure. Most probably we will get downward continuation, but it will be gradual probably and a bit choppy since we have a lot of important targets in very tight range. So, volatilty could grow and more retracements could appear. This also seems probable because market is strongly oversold on daily chart. And it will be difficult to pass through all these targets under pressure of daily oversold. If, of cause, there will be no panic sell-off.
Thus, in the beginning of the week market probably will fluctuate in 1155-1180 range. Oversold and monthly Fib level will support gold market, while bearish sentiment hardly will let it to grow significantly. Besides, weekly AB=CD does not suggest any other deep retracement, since reaction on reaching 1.0 extension already has happened. As recent drop is continuation to next AB-CD target normal price action does not suggest appearing of deep retracements between targets.
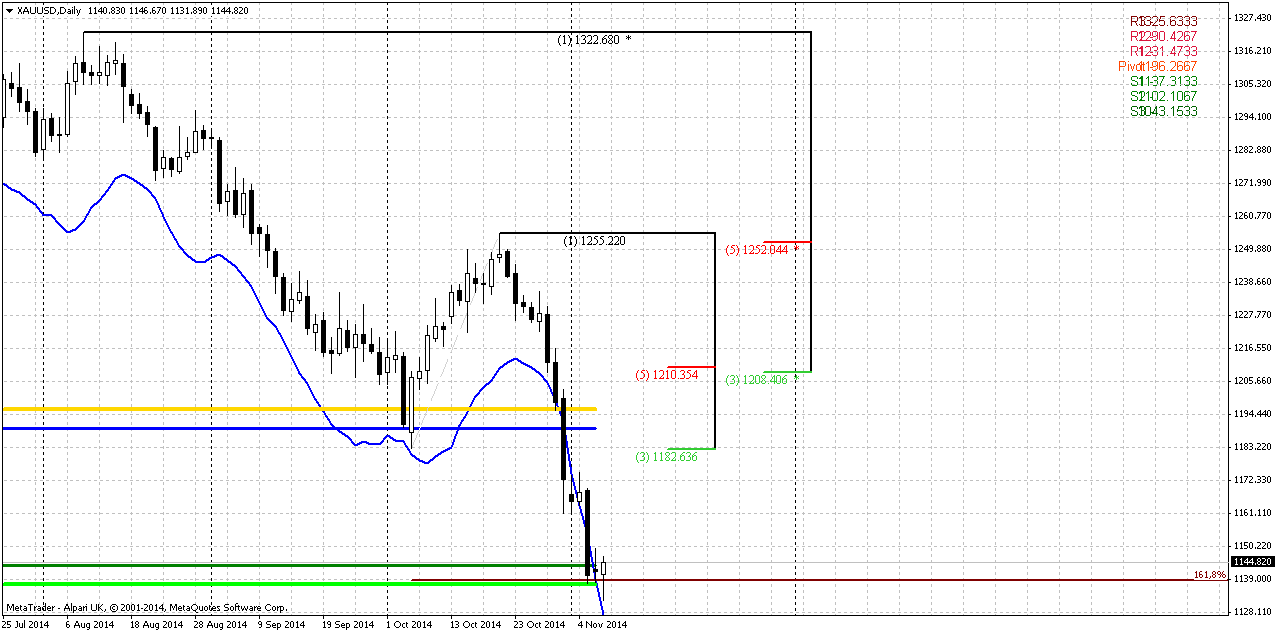
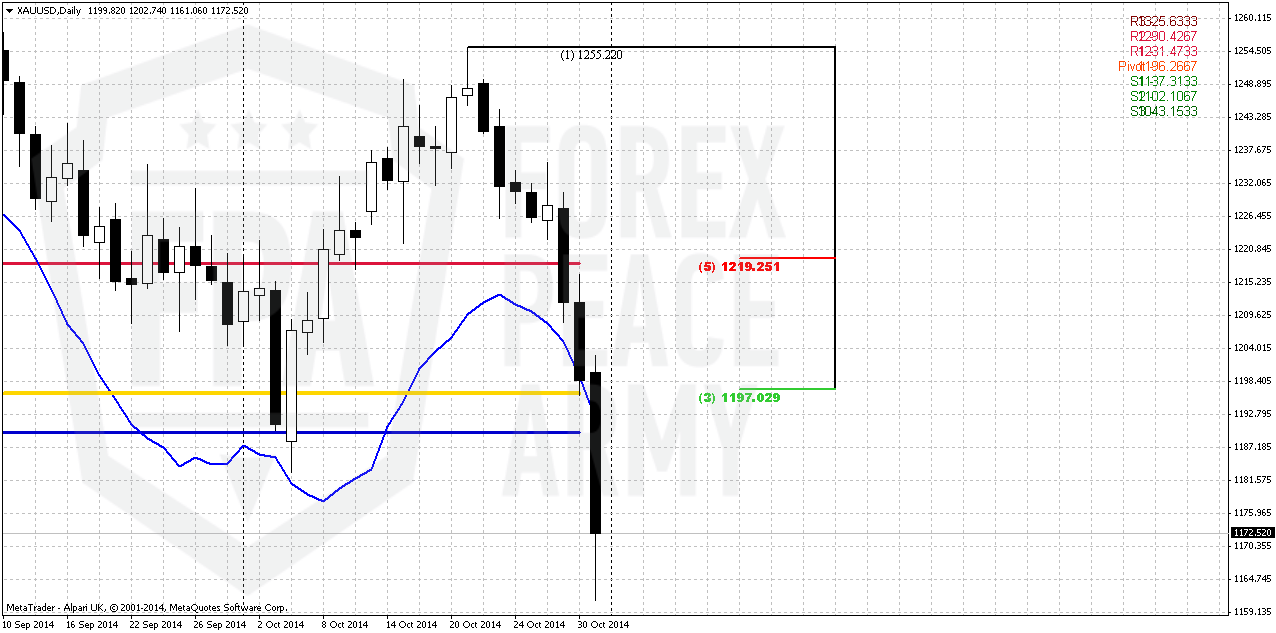
Daily
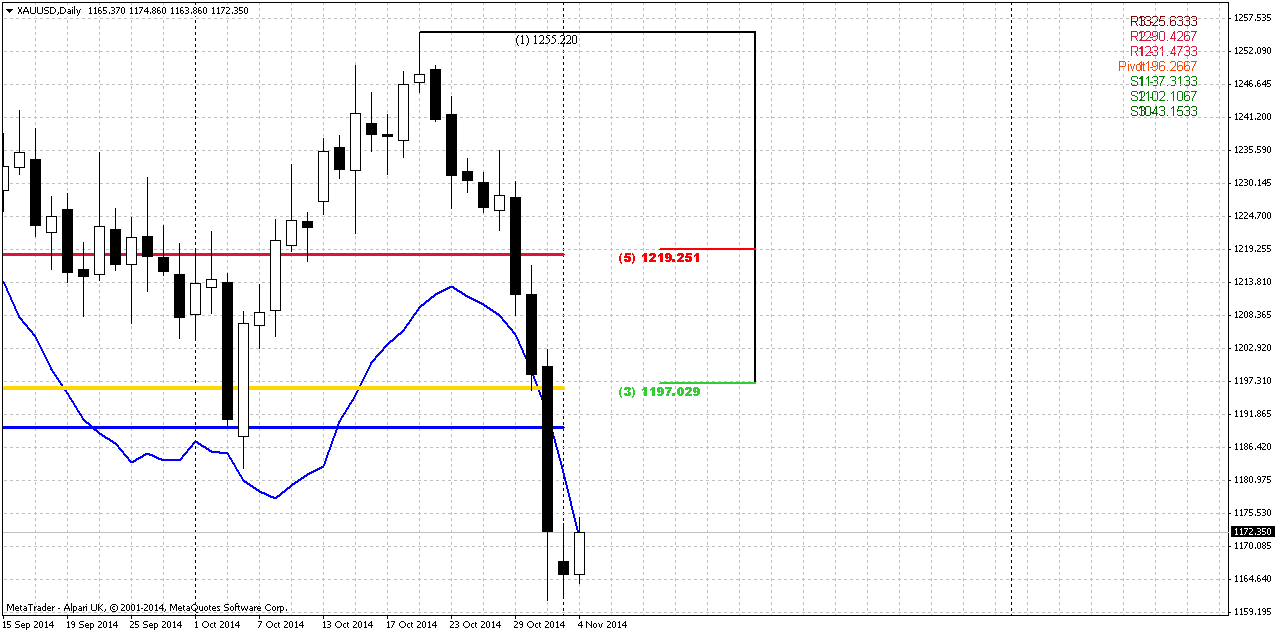
Daily picture clearly tells that it is not time to take short positions. Market now stands at strong Fib support level and at daily oversold. This combination probably will trigger upside correction and nearest most probable target is 1200 area. It includes MPP, WPP and Fib level. Besides, market could re-test broken lows. Here is we have just two possible ways. First one is to wait for intraday reversal pattern and take scalp long position with 1200 target. Second - do nothing and wait chance for short entry. This is mostly suitable for positional traders.
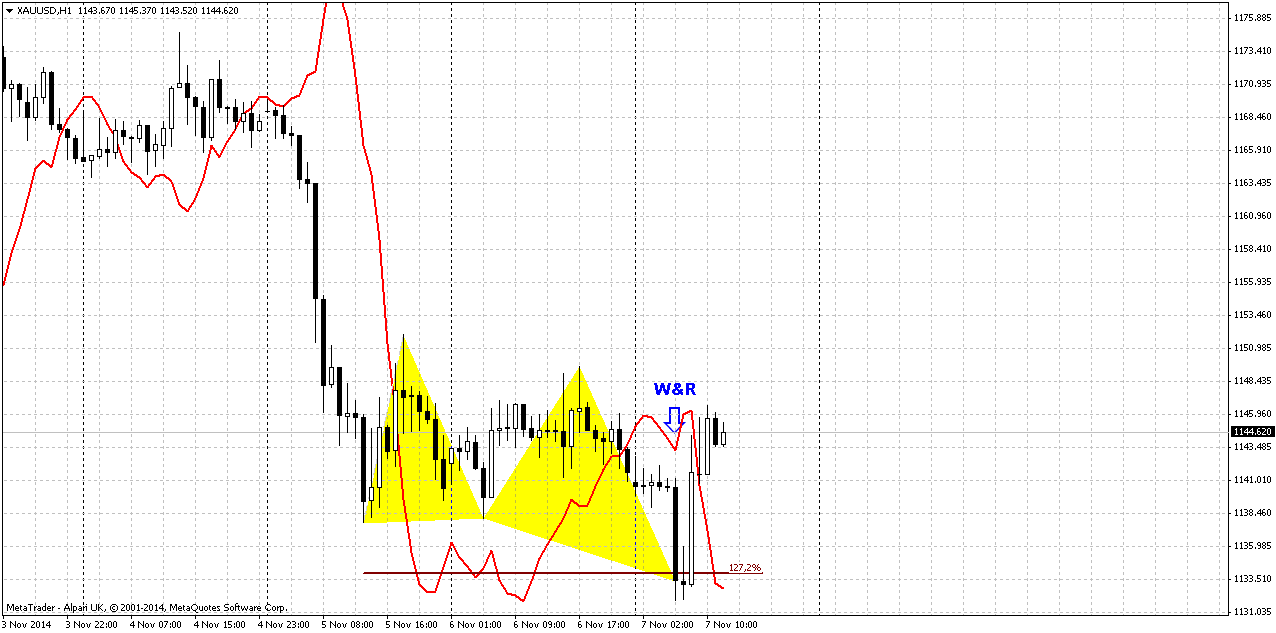
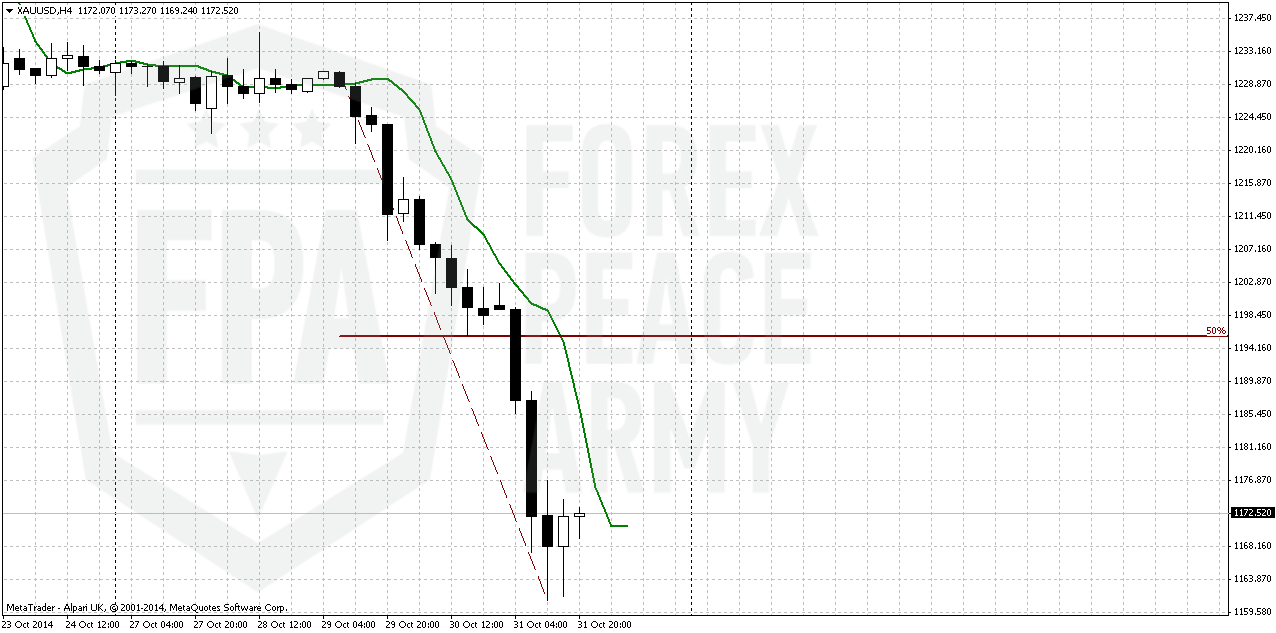
4-hour
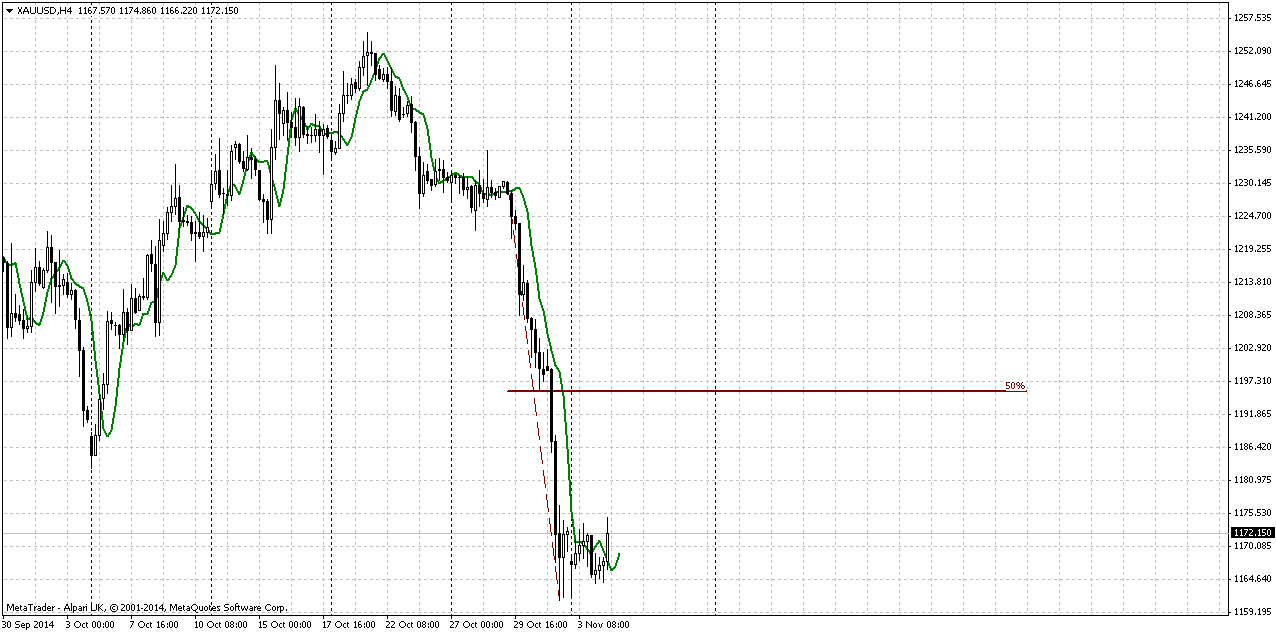
On intraday charts we do not have any scalp bullish patterns yet. But on 4-hour chart thrust looks perfect and seems suitable for possible DiNapoli DRPO “Buy” pattern. Target of this pattern is 50% resistance of its thrust down and it stands in the same 1200 area. May be on Monday we will get something on hourly chart either, say butterfly “buy”. But right now nothing have been formed yet.
Conclusion:
Gold market has accomplished our “must” target and washed out 1180$ lows. Now we have last strategical question – how deep market could drop. To answer on this question market needs time. The driving factor for gold is money of institutional investors. Despite what Asian traders tell about physical demand on holidays and festivals – this is not sufficient power to hold market. Now investors will re-assess situation on gold market and we need to understand what decision they will take. The only source of information that we have here is CFTC report and SPDR fund data. This is clue to solution. No changes in data – market will continue to creep lower.
In short-term market has reached solid monthly 1155 Fib support and strongly oversold on daily chart. In such conditions this will be tough task to continue move down. That’s why upside retracement seems reasonable in beginning of the week. Most probable target of short-term rally is 1200 area – broken lows, WPP, MPP and daily Fib level.
The technical portion of Sive's analysis owes a great deal to Joe DiNapoli's methods, and uses a number of Joe's proprietary indicators. Please note that Sive's analysis is his own view of the market and is not endorsed by Joe DiNapoli or any related companies.
Weekly Gold Tading Report prepared by Sive Morten exclusively for ForexPeaceArmy.com
As Reuters reports Gold and silver sank to their lowest since 2010 on Friday as the dollar surged against the yen and other major currencies after the Bank of Japan shocked global financial markets by expanding its massive stimulus spending.
Spot gold broke below $1,180 an ounce, a level bullion had held twice during its last two major sell-offs in June and December last year. It also briefly held the mark earlier this month until Friday's drop.
The yen plunged to a near seven-year low against the U.S. dollar on Friday, putting it on track for its worst day in 18 months, after the Bank of Japan shocked financial markets with an aggressive easing of its monetary policy.
The main reason for gold's fall is the strength in the dollar after the BOJ's desperate efforts to weaken the yen," said Jeffrey Sica, president and chief investment officer at Sica Wealth Management, which oversees $1 billion in client assets.
"Gold could fall further in the short term as the dollar could rise more in the short term, but gold should eventually benefit as a hedge against the uncertainties and economic turmoil brought by central-bank actions," Sica said.
The metal breached important support levels at $1,200 and $1,180, where stop losses - automatic sale orders - were placed and was on track for a 4.8 percent drop this week, the biggest weekly decline since June 2013.
Gold and silver were already facing some heat after the U.S. Federal Reserve earlier in the week largely dismissed financial market volatility as factors that might undercut progress toward its unemployment and inflation goals.
Reflecting bearish investment sentiment, holdings in the SPDR Gold Trust , the world's largest gold-backed exchange-traded fund, fell 0.16 percent to 741.20 tonnes on Thursday, a six-year low.
Still, retail demand remained healthy. U.S. gold coin sales jumped 22 percent in October to their highest since January.
Commercial Longs
CFTC Report shows not drastical changes yet, since plunge has happened mostly 30-31 of October while data was released on 28th of October. We need to see what will happen on next week, whether CFTC data supports recent drop or not.
Monthly
It is a bit surprising but recent miserable plunge down has no solid impact on monthly chart. Monthly picture has not changed significantly and recent action just gives us more confidence with our analysis. The one thing that still has changed – monthly grabber has reached its minimum target and cleared 1180 lows.
As we’ve said on previous week on long term gold we have, let’s call it two big clusters on of analysis. First cluster is “certainty”. It tells that we have two patterns in progress. Frist one is monthly bearish stop grabber, that was completed. Second one is Volatility breakout (VOB) that suggests at least 0.618 AB-CD down. And this target is 1050$. Butterfly pattern that we see on monthly chart is not very important and just shows how this downward action could happen. 1.618 extension of Butterfly coincides with VOB 0.618 AB-CD target.
Second cluster is “uncertainty”. This pack of information rises questions. Whether market will clear 1180, how far market could move below 1180 – 1100, 1050? On first question we’ve got the answer on Friday and here our bet was correct. Market indeed has pssed through 1180. But simultaneously we’ve got another very important information – this breakout does not look like W&R and this is important.
Fundamentally economy data is not really bad, right now is confirmed by US companies earning reports, weak physical demand and anemic inflation – all these moments prevent gold appreciation. Fall of crude oil prices also is supporting factor for economy in long term, because household and industry will get signficant economy on energy expenses, especially on coming winter. Also we have to say that active part seasonal bullish trend will finish in December. Currently it should be mostly active, but right now we see that Asian physical demand is not enough to push market higher, when instituational investors stand flat and do not put money in gold.
Technically during recent rally market was not able to re-test Yearly Pivot. In the beginning of the year market has tested YPP and failed, then continued move down. During recent attempt to move higher – has not even reached YPP again.
But right now the time has come to second question – whether market will break this level and how deep it will fall. Currently we only can try to get hints here and there. Although some traders point on growing individual demand on gold and hope that this could trigger rally on gold. We would say that individual demand is just a part of global annual demand and this demand mostly planned and expected. If even as it was reported has grown for 20%, this is nothing compares to money of institutional investors with big part in futures market. It is not annual well known demand ~5-6K tonnes drives market, it is futures positions. Just imagine how big they are 75 K contracts in net long position. This is 75 K* 100 Oz per contract = 7,5 Mln Oz. ~ 2,3K tonnes. This is 50% of annual demand. But this is just net position. Open interest is 10 times greater. Thus, 20% increase in individual demand just dissolves in huge institutional volumes. Thus, to understand what will happen and how far gold could fall we need keep a close eye on CFTC data because it will warn us about possible changing.
Another factor that could impact on gold market is possible gold buying from SNB. We’ve said about it on previous week:
Swiss gold referendum's support falls short of majority: poll | Reuters
October has closed below 1180 lows, we clearly see here bearish pressure and butterfly holds perfect. This points that right now odds stand in favor of downward continuation in long-term perspective. Gold has not shown any W&R and this is bearish sign.
Weekly
On weekly chart we have rather tricky picture. Trend here is bearish, market is not at oversold. Action down was held by 1155 major 5/8 monthly Fib support. That’s why market has stopped there. Below market we have one after another important targets. 1155 – Fib level, 1137 – MPS1, 1125 – monthly 1.27 butterfly pattern and finally 1100 – 1.618 AB-CD. How price action will develop here?
First of all take a look at recent action. Retracement up was shy, just to re-test 1240 lows and complete bullish ingulfing cent-to-cent, not more. Then we’ve got miserable plunge down. This drop has happened right to 1.618 butterfly point and this is bearish sign that increases chances on downward continuation and butterfly failure. Most probably we will get downward continuation, but it will be gradual probably and a bit choppy since we have a lot of important targets in very tight range. So, volatilty could grow and more retracements could appear. This also seems probable because market is strongly oversold on daily chart. And it will be difficult to pass through all these targets under pressure of daily oversold. If, of cause, there will be no panic sell-off.
Thus, in the beginning of the week market probably will fluctuate in 1155-1180 range. Oversold and monthly Fib level will support gold market, while bearish sentiment hardly will let it to grow significantly. Besides, weekly AB=CD does not suggest any other deep retracement, since reaction on reaching 1.0 extension already has happened. As recent drop is continuation to next AB-CD target normal price action does not suggest appearing of deep retracements between targets.
Daily
Daily picture clearly tells that it is not time to take short positions. Market now stands at strong Fib support level and at daily oversold. This combination probably will trigger upside correction and nearest most probable target is 1200 area. It includes MPP, WPP and Fib level. Besides, market could re-test broken lows. Here is we have just two possible ways. First one is to wait for intraday reversal pattern and take scalp long position with 1200 target. Second - do nothing and wait chance for short entry. This is mostly suitable for positional traders.
4-hour
On intraday charts we do not have any scalp bullish patterns yet. But on 4-hour chart thrust looks perfect and seems suitable for possible DiNapoli DRPO “Buy” pattern. Target of this pattern is 50% resistance of its thrust down and it stands in the same 1200 area. May be on Monday we will get something on hourly chart either, say butterfly “buy”. But right now nothing have been formed yet.
Conclusion:
Gold market has accomplished our “must” target and washed out 1180$ lows. Now we have last strategical question – how deep market could drop. To answer on this question market needs time. The driving factor for gold is money of institutional investors. Despite what Asian traders tell about physical demand on holidays and festivals – this is not sufficient power to hold market. Now investors will re-assess situation on gold market and we need to understand what decision they will take. The only source of information that we have here is CFTC report and SPDR fund data. This is clue to solution. No changes in data – market will continue to creep lower.
In short-term market has reached solid monthly 1155 Fib support and strongly oversold on daily chart. In such conditions this will be tough task to continue move down. That’s why upside retracement seems reasonable in beginning of the week. Most probable target of short-term rally is 1200 area – broken lows, WPP, MPP and daily Fib level.
The technical portion of Sive's analysis owes a great deal to Joe DiNapoli's methods, and uses a number of Joe's proprietary indicators. Please note that Sive's analysis is his own view of the market and is not endorsed by Joe DiNapoli or any related companies.