Sive Morten
Special Consultant to the FPA
- Messages
- 18,673
Fundamentals
By Reuters news gold fell 1.5 percent on Friday to its lowest in three months as unusually large sale orders in New York futures and signs a deal might be near to avert a potential U.S. debt default prompted jittery investors to flee the bullion market. The precious metal, generally viewed as a safe-haven investment, fell $30 an ounce in just minutes in early U.S. trading, sparking sell-offs in crude oil and copper. Friday's drop was reminiscent of a huge sell order that sent gold prices 3 percent lower on Oct. 1. U.S. gold futures trading was momentarily halted at 8:42 a.m. EDT (1242 GMT) by CME Group's Stop Logic mechanism to prevent excessive price movements. In the three minutes around the ten-second trading pause, gold prices slid almost $30, or about 2 percent, with an unusually heavy turnover at nearly 20,000 contracts - about one-fifth of the market's volume at the time.
Bullion's drop stands in sharp contrast with higher U.S. equities and a lower dollar as other investors were encouraged by the first signs of progress by U.S. lawmakers to end the standoff in Washington. On Friday, President Barack Obama and congressional Republican leaders moved to end their fiscal impasse but struggled to strike a deal on the details for a short-term reopening of the federal government and an increase in the U.S. debt limit.
"If there is a temporary stop-gap measure to avert a disaster of U.S. default, it will lead to the gold market going even lower," said to Reuters Jeffrey Sica, chief investment officer of Sica Wealth, which manages over $1 billion of client assets. Gold's sudden price tumble was a result of hedge funds and institutional investors flooding the gold futures market with sell orders, traders said.
Gold's losses were triggered by a break below key support between $1,273-1,278, which represents the low from Aug. 7, Oct. 2, and the neckline of a head-and-shoulder continuation pattern, said Jonathan Krinsky, chief technical market analyst at institutional trading firm Miller Tabak. Technical charts now suggest gold to fall to an area between $1,110 and $1,120, below June's three-year low at $1,180, Krinsky said.
As a gauge of investor interest, the gold holdings of SPDR Gold Trust <GLD>, the world's largest gold-backed ETF, dropped 0.2 percent, or 1.80 tonnes, to 896.38 tonnes on Thursday. That marked a four-year low.
Uncertainty over talks to lift the U.S. debt ceiling in 2011 was a main driver for gold to hit record highs at above $1,920 an ounce. This year, sentiment towards bullion is much less positive, holding the metal in narrow ranges as markets largely expect the debt limit to be raised, analysts said.
As you understand, guys, on this week we also do not have CFTC report due shut down.
Monthly
Major concern on monthly chart is about possible pattern. What current move up will be – either still AB=CD up or downward continuation? Currently it is very difficult to make any forecasts, at least on monthly chart. As you know our previous analysis (recall volatility breakout - VOB) suggests upward retracement. As market has significantly hit oversold we’ve suggested that retracement up should be solid, may be not right to overbought, but still significant. Take a look at previous bounces out from oversold – everytime retracement was significant. Thus, we’ve made an assumption of possible deeper upward retracement that could take a shape of AB=CD. Couple weeks ago this move has looked nice, but now we see fast move down. It could mean that second leg of move down (as we’ve suggested by previous analysis) has started. Situation will resolve right around previous lows. If market will pass through it, then, obviously we will not see any AB=CD up.
So, as a conclusion on monthly chart we can say, that we have reasons to suggest some more upward action due strong oversold and some other moments. But current move down rather fast and it could happen that now we see not a BC leg in upward AB-CD, but downward continuation by VOB.
Weekly
Here we probably could say that gold stands at the edge. Retracement to MPS1 and 5/8 Fib support is normal, because in fact we have first swing up after long-term bear trend. We’ve discussed it previously – as bearish momentum was solid, market just can’t ignore it and have to respect. This respect appears as deep downward retracement. Besides, gold likes to show 5/8 retracements.
But if price will pass down through MPS1 – that will be really something and almost 100% trend will shift bearish in this case. As market has approached to MACDP – we will be watch for bullish stop grabber on next week, since this is very comfortable level – crossing of MACDP and support area.
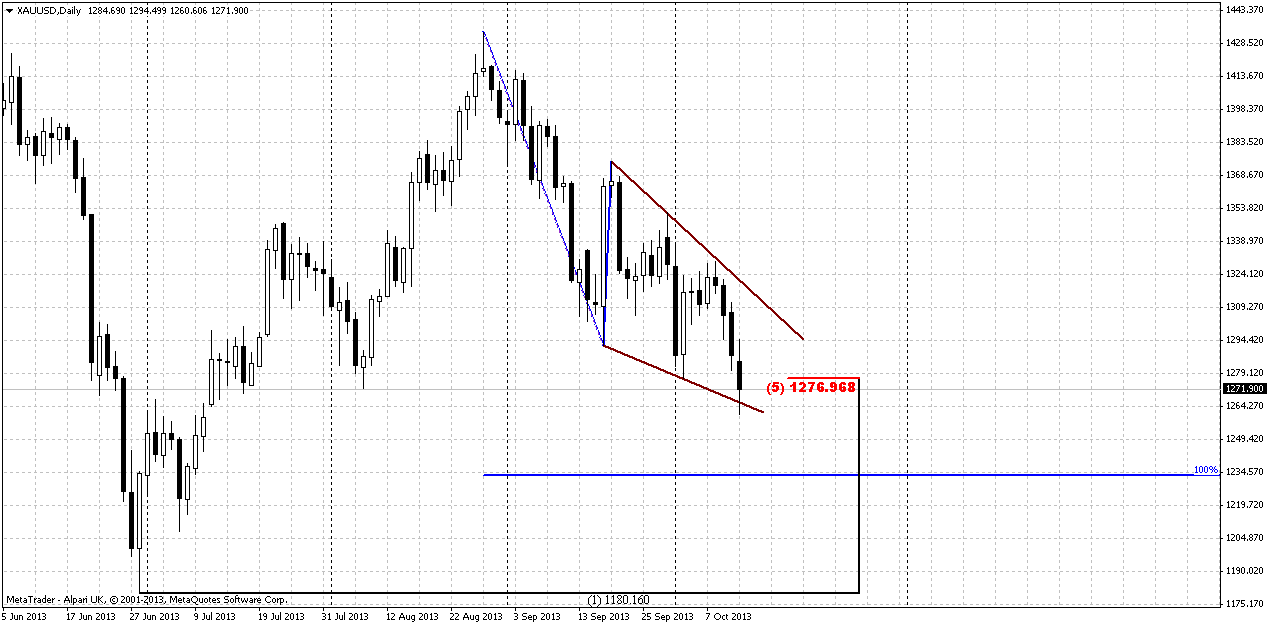
Daily
Here situation is also demand some hint. Trend has turned bearish here, and market, in fact, has done well, since on Thursday we’ve talked about possible bearish dynamic pressure that was forming here. Now it has reached minimum destination – previous swing low and renewed it.
At the same time market is forming falling wedge that theoretically is exhausting pattern and it could happen and mostly it forms in favor of possible upward action. Combining this way of thoughts with weekly analysis, we could get rather clear and promising picture – reversal up from major 5/8 support+MPS1 with weekly bullish stop grabber and triggering by falling wedge on daily chart. As anything could happen on coming week, this is a scenario that, at least, is worthy of our attention.
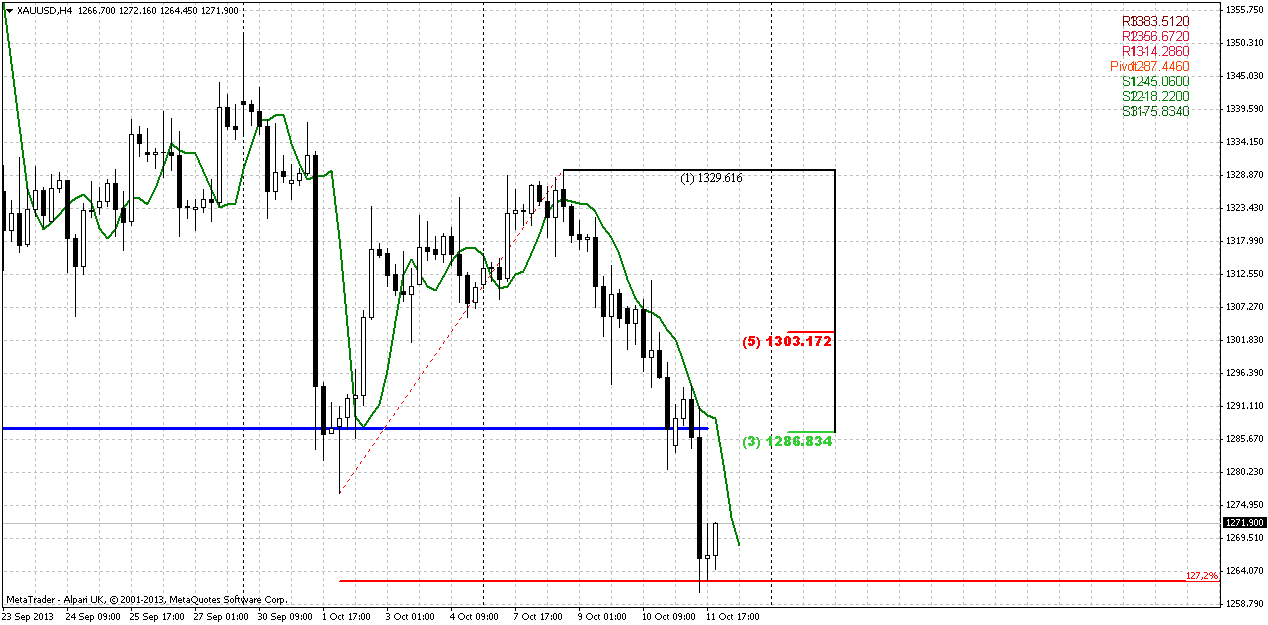
4-hour
Here we have short-term setup, that either could become a part of higher-time frame setup or could not. For example, upward action could start by DRPO “Buy” on 4-hour chart. Or, we could see B&B “Sell” for instance and market will continue move down. Anyway, this will become second setup that could be traded separately. We can try to trade B&B or DRPO whatever it will be and later to see will it have any link to higher time frame. Current thrust looks nice and suitable for DiNapoli directional pattern.
Conclusion:
Currently market stands at some edge and further action will clarify – whether we have to be ready for deeper move down, or retracement up will continue. Because now, market stands at level of 5/8 support that in general acceptable and still could treated as retracement, especially on gold and especially after solid move down. Market now is forming something that looks like falling wedge on daily chart and this action in general seems logical and could become a possible triggering pattern of upward move.
On intraday charts we have nice thrust that is suitable for DiNapoli directional and who knows, if we will get any, it could become a starting point of higher time frame setups.
The technical portion of Sive's analysis owes a great deal to Joe DiNapoli's methods, and uses a number of Joe's proprietary indicators. Please note that Sive's analysis is his own view of the market and is not endorsed by Joe DiNapoli or any related companies.
By Reuters news gold fell 1.5 percent on Friday to its lowest in three months as unusually large sale orders in New York futures and signs a deal might be near to avert a potential U.S. debt default prompted jittery investors to flee the bullion market. The precious metal, generally viewed as a safe-haven investment, fell $30 an ounce in just minutes in early U.S. trading, sparking sell-offs in crude oil and copper. Friday's drop was reminiscent of a huge sell order that sent gold prices 3 percent lower on Oct. 1. U.S. gold futures trading was momentarily halted at 8:42 a.m. EDT (1242 GMT) by CME Group's Stop Logic mechanism to prevent excessive price movements. In the three minutes around the ten-second trading pause, gold prices slid almost $30, or about 2 percent, with an unusually heavy turnover at nearly 20,000 contracts - about one-fifth of the market's volume at the time.
Bullion's drop stands in sharp contrast with higher U.S. equities and a lower dollar as other investors were encouraged by the first signs of progress by U.S. lawmakers to end the standoff in Washington. On Friday, President Barack Obama and congressional Republican leaders moved to end their fiscal impasse but struggled to strike a deal on the details for a short-term reopening of the federal government and an increase in the U.S. debt limit.
"If there is a temporary stop-gap measure to avert a disaster of U.S. default, it will lead to the gold market going even lower," said to Reuters Jeffrey Sica, chief investment officer of Sica Wealth, which manages over $1 billion of client assets. Gold's sudden price tumble was a result of hedge funds and institutional investors flooding the gold futures market with sell orders, traders said.
Gold's losses were triggered by a break below key support between $1,273-1,278, which represents the low from Aug. 7, Oct. 2, and the neckline of a head-and-shoulder continuation pattern, said Jonathan Krinsky, chief technical market analyst at institutional trading firm Miller Tabak. Technical charts now suggest gold to fall to an area between $1,110 and $1,120, below June's three-year low at $1,180, Krinsky said.
As a gauge of investor interest, the gold holdings of SPDR Gold Trust <GLD>, the world's largest gold-backed ETF, dropped 0.2 percent, or 1.80 tonnes, to 896.38 tonnes on Thursday. That marked a four-year low.
Uncertainty over talks to lift the U.S. debt ceiling in 2011 was a main driver for gold to hit record highs at above $1,920 an ounce. This year, sentiment towards bullion is much less positive, holding the metal in narrow ranges as markets largely expect the debt limit to be raised, analysts said.
As you understand, guys, on this week we also do not have CFTC report due shut down.
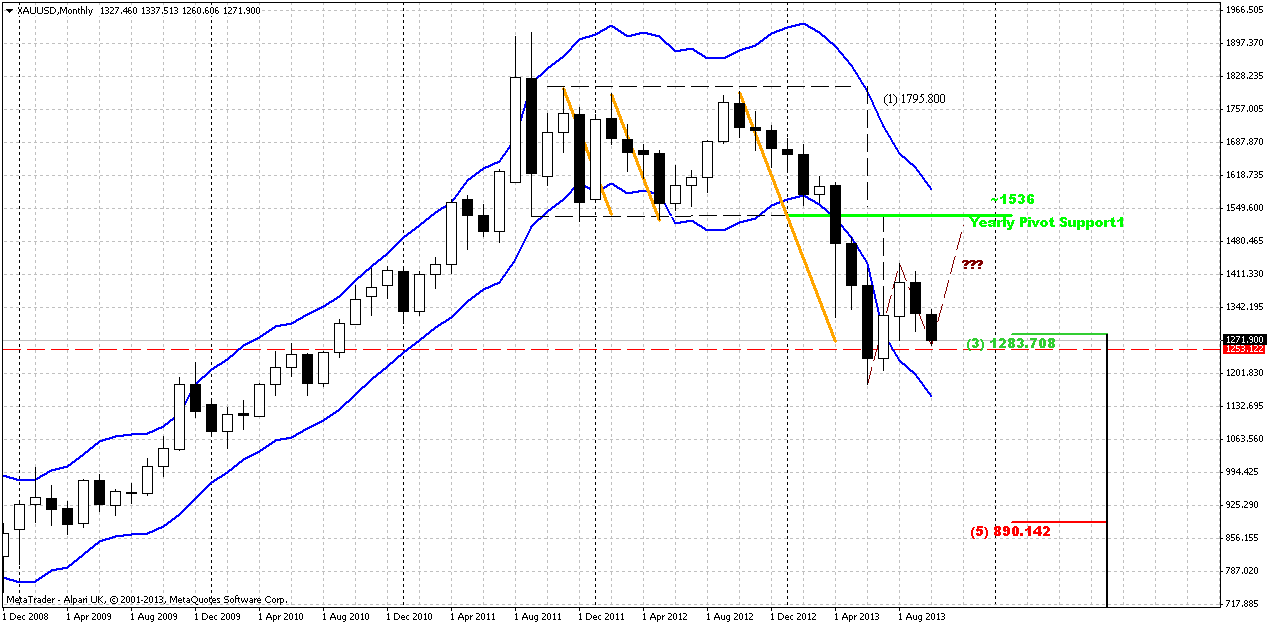
Monthly
Major concern on monthly chart is about possible pattern. What current move up will be – either still AB=CD up or downward continuation? Currently it is very difficult to make any forecasts, at least on monthly chart. As you know our previous analysis (recall volatility breakout - VOB) suggests upward retracement. As market has significantly hit oversold we’ve suggested that retracement up should be solid, may be not right to overbought, but still significant. Take a look at previous bounces out from oversold – everytime retracement was significant. Thus, we’ve made an assumption of possible deeper upward retracement that could take a shape of AB=CD. Couple weeks ago this move has looked nice, but now we see fast move down. It could mean that second leg of move down (as we’ve suggested by previous analysis) has started. Situation will resolve right around previous lows. If market will pass through it, then, obviously we will not see any AB=CD up.
So, as a conclusion on monthly chart we can say, that we have reasons to suggest some more upward action due strong oversold and some other moments. But current move down rather fast and it could happen that now we see not a BC leg in upward AB-CD, but downward continuation by VOB.
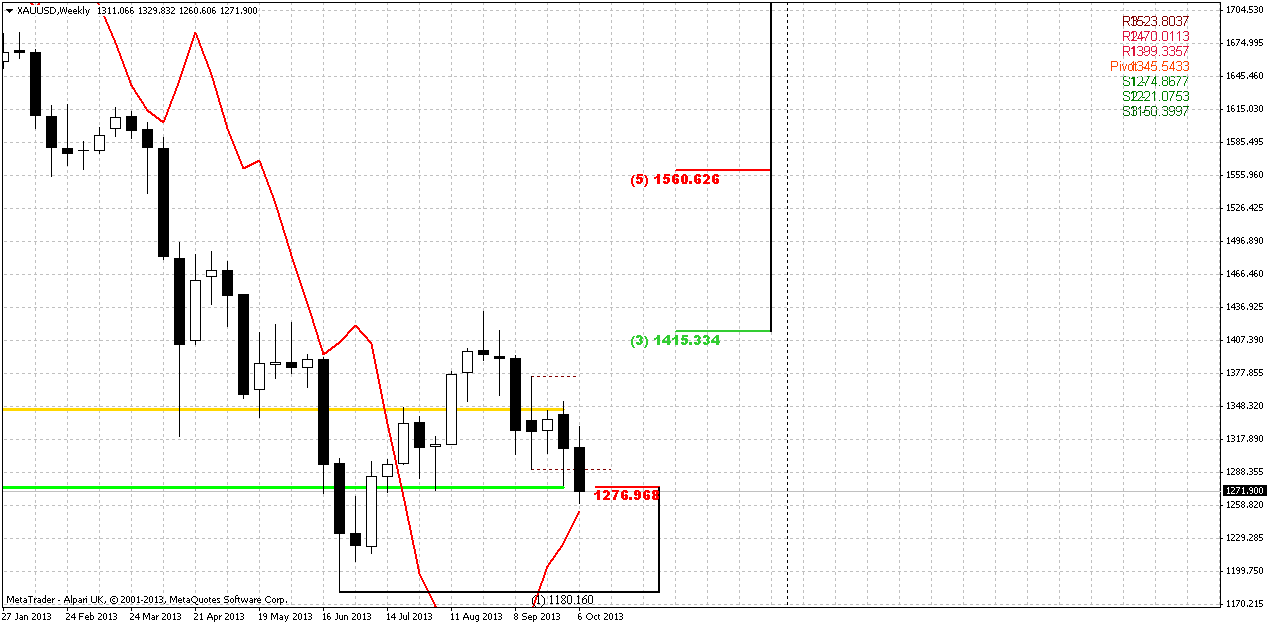
Weekly
Here we probably could say that gold stands at the edge. Retracement to MPS1 and 5/8 Fib support is normal, because in fact we have first swing up after long-term bear trend. We’ve discussed it previously – as bearish momentum was solid, market just can’t ignore it and have to respect. This respect appears as deep downward retracement. Besides, gold likes to show 5/8 retracements.
But if price will pass down through MPS1 – that will be really something and almost 100% trend will shift bearish in this case. As market has approached to MACDP – we will be watch for bullish stop grabber on next week, since this is very comfortable level – crossing of MACDP and support area.
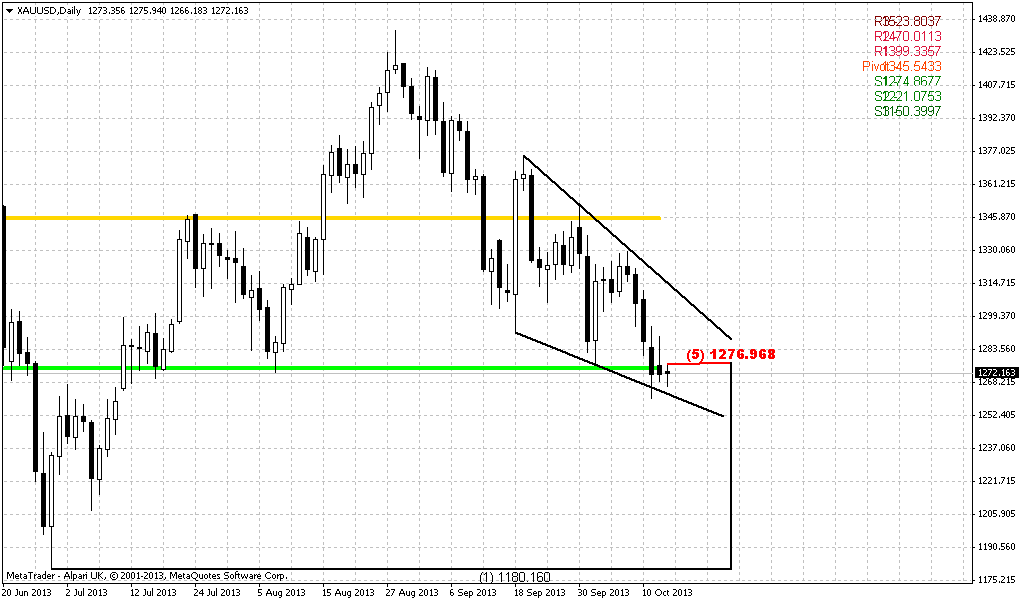
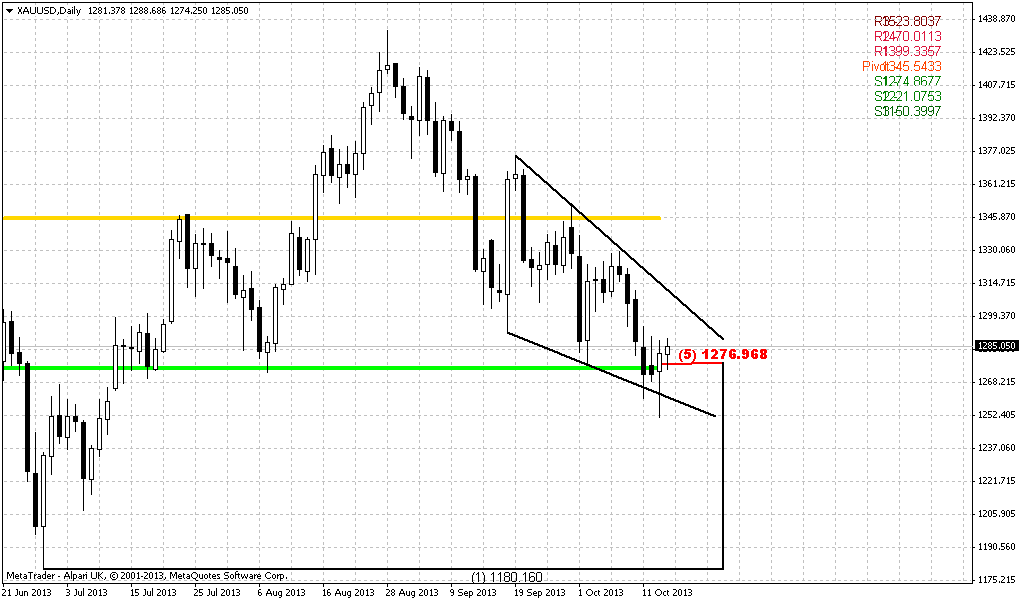
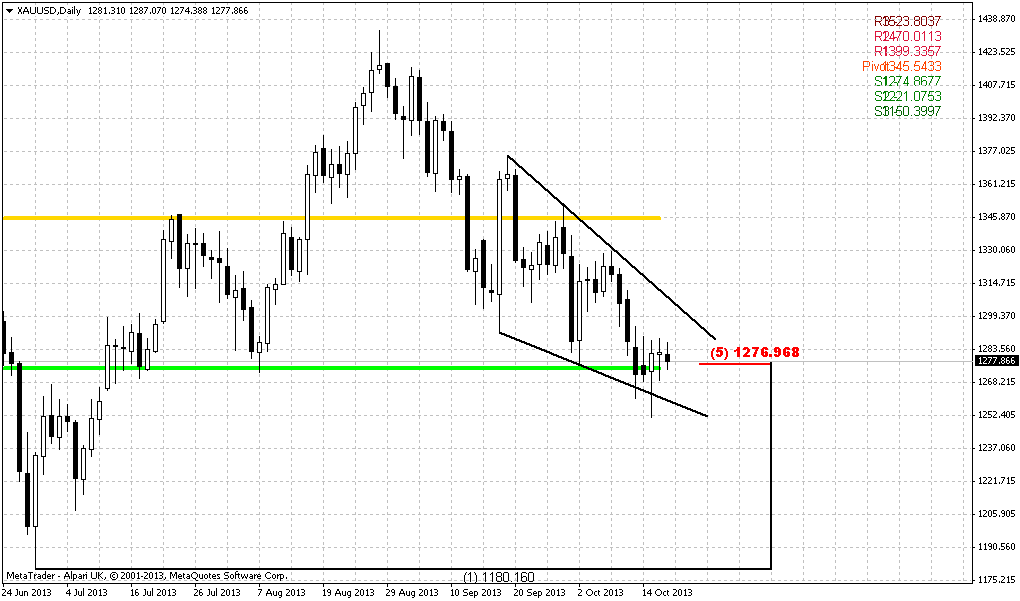
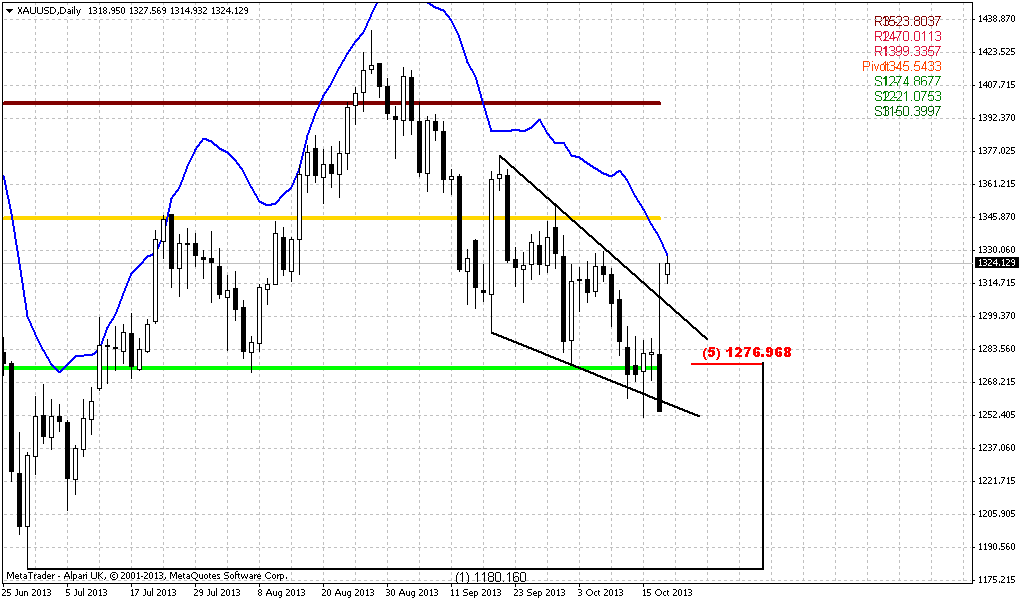
Daily
Here situation is also demand some hint. Trend has turned bearish here, and market, in fact, has done well, since on Thursday we’ve talked about possible bearish dynamic pressure that was forming here. Now it has reached minimum destination – previous swing low and renewed it.
At the same time market is forming falling wedge that theoretically is exhausting pattern and it could happen and mostly it forms in favor of possible upward action. Combining this way of thoughts with weekly analysis, we could get rather clear and promising picture – reversal up from major 5/8 support+MPS1 with weekly bullish stop grabber and triggering by falling wedge on daily chart. As anything could happen on coming week, this is a scenario that, at least, is worthy of our attention.
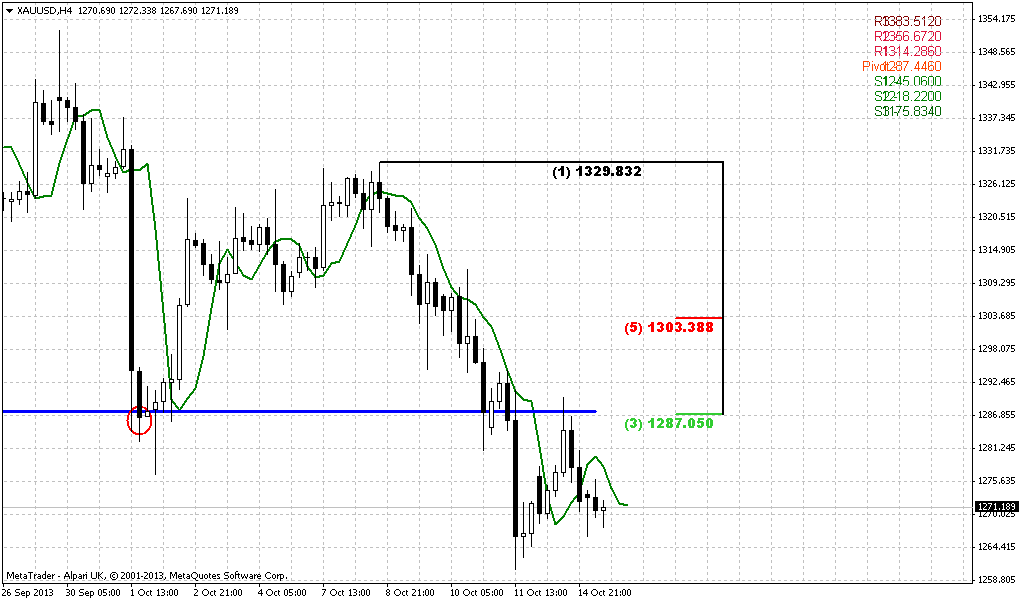
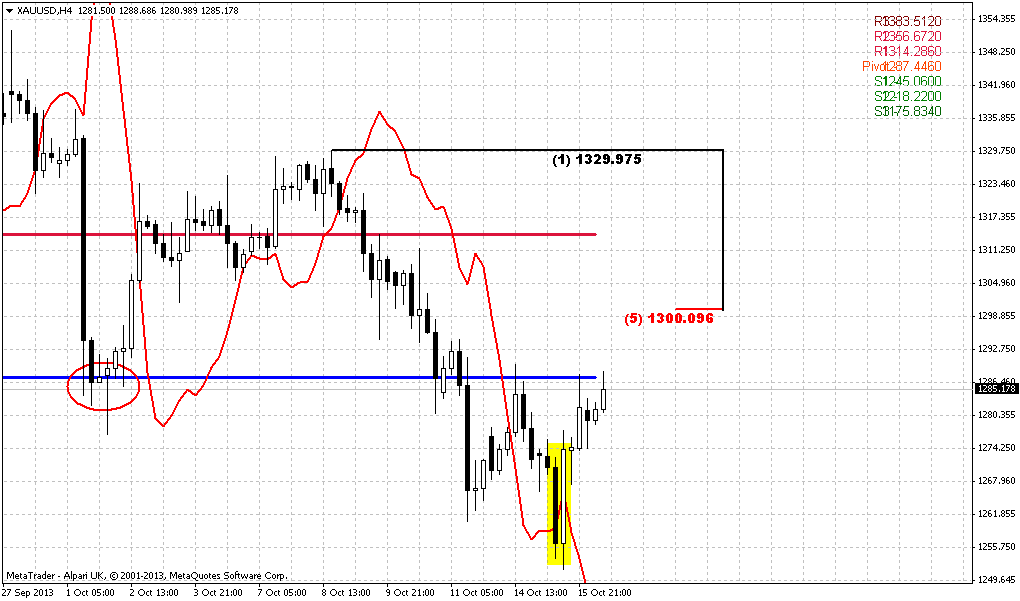
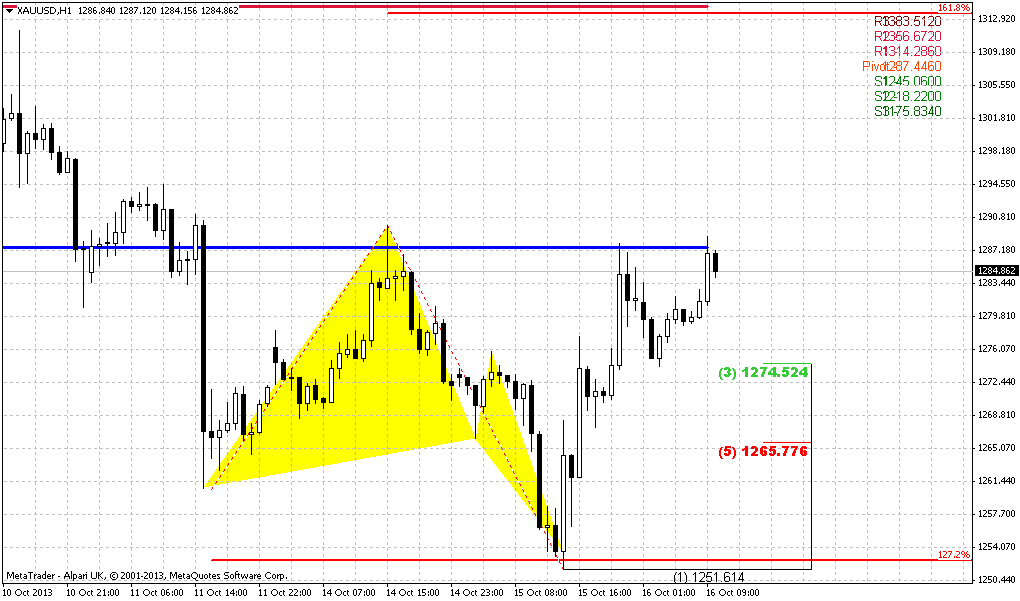
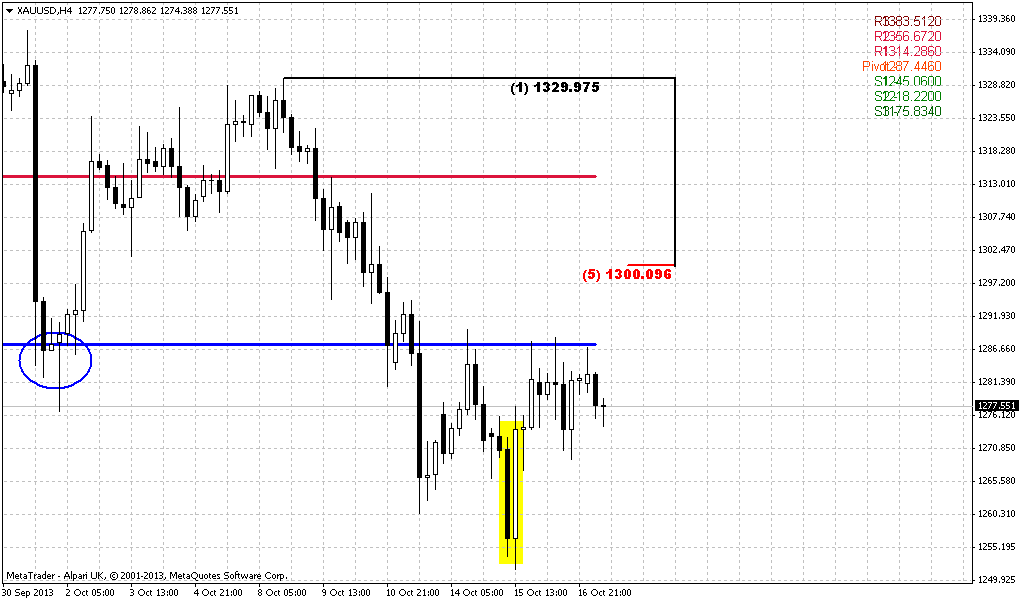
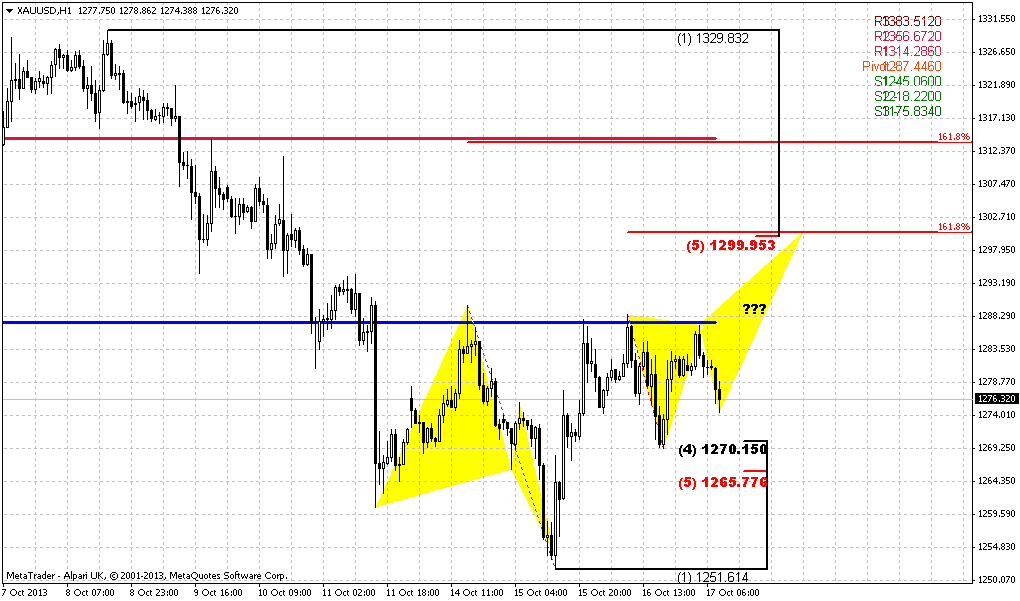
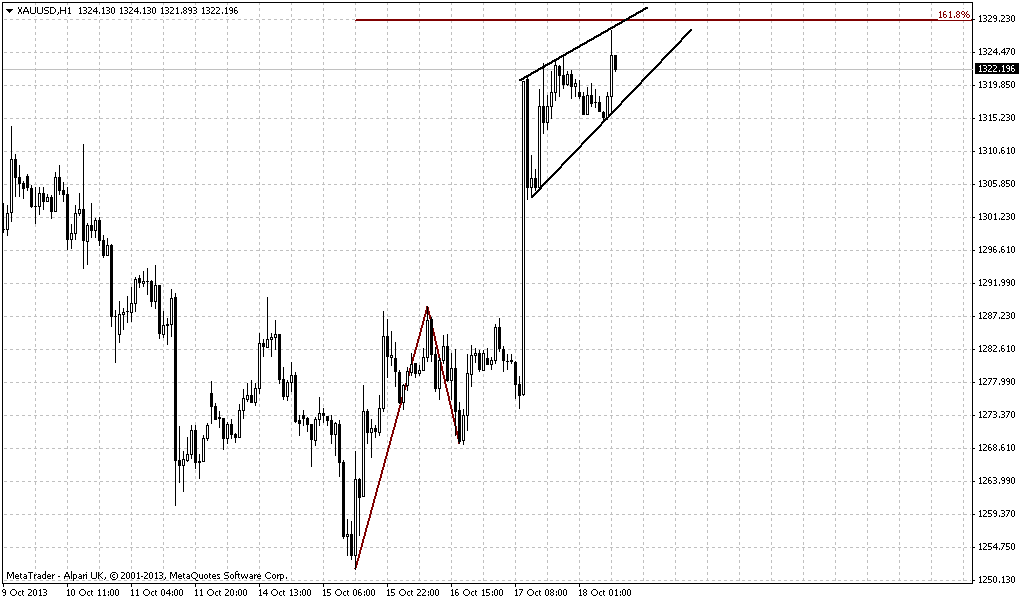
4-hour
Here we have short-term setup, that either could become a part of higher-time frame setup or could not. For example, upward action could start by DRPO “Buy” on 4-hour chart. Or, we could see B&B “Sell” for instance and market will continue move down. Anyway, this will become second setup that could be traded separately. We can try to trade B&B or DRPO whatever it will be and later to see will it have any link to higher time frame. Current thrust looks nice and suitable for DiNapoli directional pattern.
Conclusion:
Currently market stands at some edge and further action will clarify – whether we have to be ready for deeper move down, or retracement up will continue. Because now, market stands at level of 5/8 support that in general acceptable and still could treated as retracement, especially on gold and especially after solid move down. Market now is forming something that looks like falling wedge on daily chart and this action in general seems logical and could become a possible triggering pattern of upward move.
On intraday charts we have nice thrust that is suitable for DiNapoli directional and who knows, if we will get any, it could become a starting point of higher time frame setups.
The technical portion of Sive's analysis owes a great deal to Joe DiNapoli's methods, and uses a number of Joe's proprietary indicators. Please note that Sive's analysis is his own view of the market and is not endorsed by Joe DiNapoli or any related companies.