Sive Morten
Special Consultant to the FPA
- Messages
- 18,673
Fundamentals
As any other market gold has felt US debt ceil relief. Still, we have more events ahead and there is not much time till them. I mean FOMC meeting on 30th of October and probably postponed NFP release. As Reuters informs - Gold fell on Friday as investors took profits after the previous session's 3 percent rally on expectations the partial U.S. government shutdown will lead the Federal Reserve to postpone tapering of its bond-buying stimulus. The precious metal was up more than 3 percent for the week, its biggest weekly gain in two months. Heavy short covering boosted gold prices after the Congress clinched an 11th-hour deal earlier this week to pull the world’s biggest economy back from the brink of debt default. However, gold's upward momentum faded on Friday, partly after data showed holdings in the world's largest bullion exchange-traded fund, SPDR Gold Trust fell 0.37 percent (2-3 tonnes) on Thursday from Wednesday. The fund posted a fourth straight week of outflows. Its holdings have fallen more than 35 percent from their December 2012 peak, and are down nearly 3 percent this month.
"It remains to be seen whether the investor community will now restart their buying of various ETF’s given that the Fed’s tapering intentions are now merely being postponed," said Edward Meir, metals analyst at brokerage INTL FC Stone. "Once the government re-opened and the agenda moved on from the debt crisis to next week's Federal Reserve meeting, that was a trigger for gold to see some upside," Mitsubishi analyst Jonathan Butler said. However, in the long run, gold is likely to sell off as soon as talks of Fed tapering resume, Butler said. Gold's 20 percent drop this year has largely been after Fed Chairman Ben Bernanke signaled earlier this year the central bank's $85 billion monthly bond-buying scheme - which had driven gold higher by keeping a lid on interest rates while stoking inflation fears - will be tapered.
So, as we can see thought already circle around future FOMC meeting. Most traders think that Fed hardly will say something that will assume increasing of QE tapering probability. But, in reality nobody knows the impact of shut down on economy, but Fed probably does. Every time I remind words of Deutsche Bank senior economist that we’ve read 2 weeks ago. When he has spoken on shut down he said - “it is too risky to sell with shut down behind”. But as shut down has passed, no these thoughts probably could appear again. All in all, this means that he has bearish view on gold and he does not sell only due shut down turmoil. Currently is a period of corporate statements and I tell you that recent reports mostly positive – Google exceeds 1000$ per share, Morgan Stanley, BofA and other companies report on earnings growth. Fed probably knows NFP data for September. What I’m aiming at is that probability of appearing some hints on QE contraction is significant, and it could happen that negative shutdown impact on US economy could be overestimated. It could be really some fundamental trap, because currently all these speeches look too smooth and sweet.
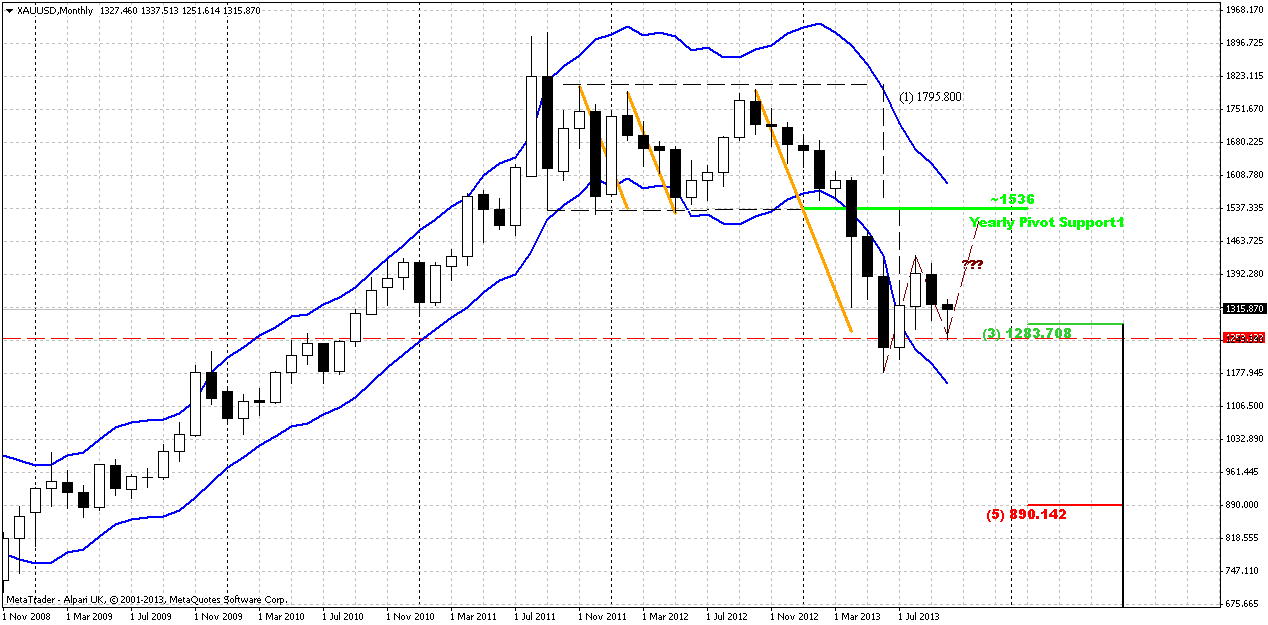
Monthly
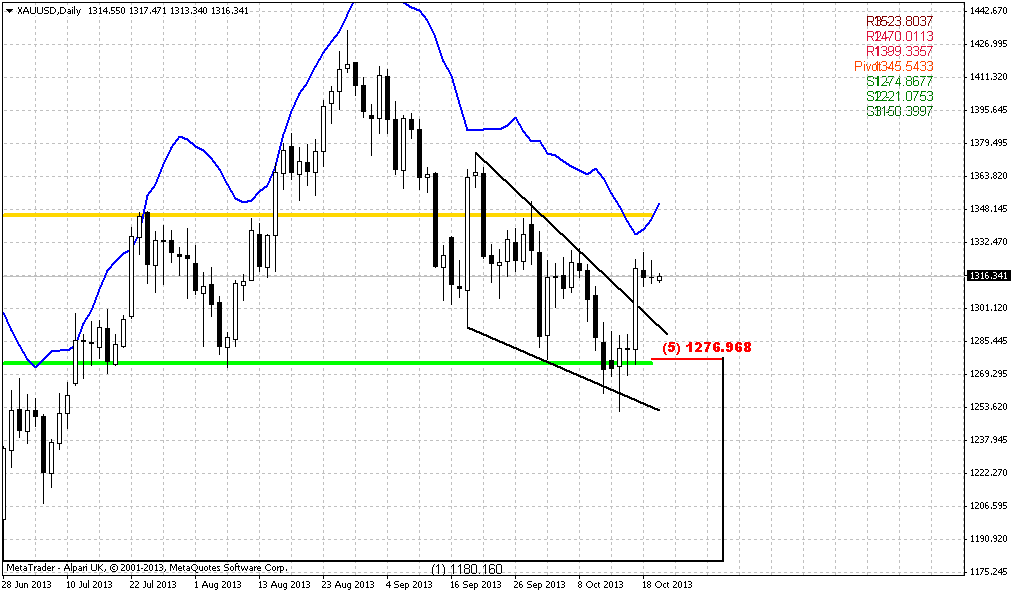
Major concern on monthly chart is about possible pattern. What current move up will be – either still AB=CD up or downward continuation? Currently it is very difficult to make any forecasts, at. Although previous week rally stands in favor of upward action, but situation still unclear, least on monthly chart. As you know our previous analysis (recall volatility breakout - VOB) suggests upward retracement. As market has significantly hit oversold we’ve suggested that retracement up should be solid, may be not right to overbought, but still significant. Take a look at previous bounces out from oversold – everytime retracement was significant. Thus, we’ve made an assumption of possible deeper upward retracement that could take a shape of AB=CD. Couple weeks ago this move has looked nice, but now we see fast move down. It could mean that second leg of move down (as we’ve suggested by previous analysis) has started. Situation will resolve right around previous lows. If market will pass through it, then, obviously we will not see any AB=CD up.
So, as a conclusion on monthly chart we can say, that we have reasons to suggest some more upward action due strong oversold and some other moments. But current move down rather fast and it could happen that now we see not a BC leg in upward AB-CD, but downward continuation by VOB.
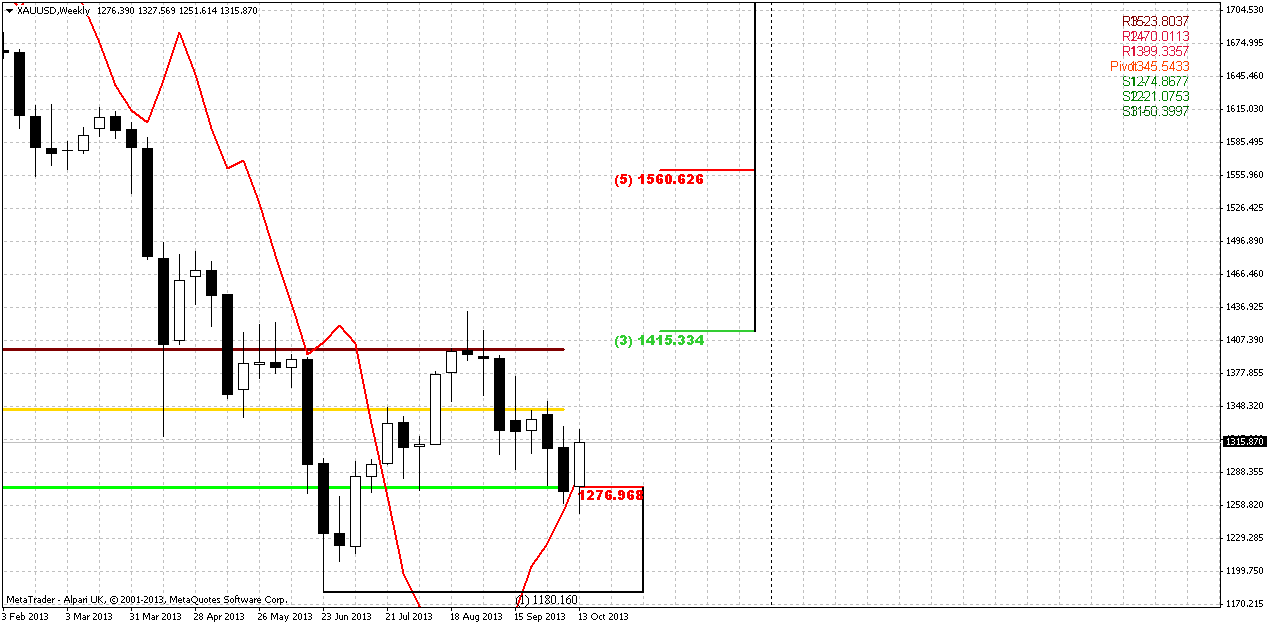
Weekly
We’ve said this on previous week and I repeat it again – weekly chart is a clue for medium term perspective. On previous week we’ve decided to keep an eye on possible bullish stop grabber and what do we see now – we’ve got it! This pattern assumes market appreciation at minimum slightly above MPP or even above 1435 highs. Since we still have pretty much time till FOMC, this scenario seems probable.
But, guys, if even we wouldn’t get this grabber, current situation absolutely does not contradict with upward action and even confirms this. Price behavior right now is 100% reasonable and logical. Take a look by yourself - retracement to MPS1 and 5/8 Fib support is normal, because in fact we have first swing up after long-term bear trend. We’ve discussed it previously – as bearish momentum was solid, market just can’t ignore it and have to respect. This respect appears as deep downward retracement. Besides, gold likes to show 5/8 retracements. Second – MPS1 should hold retracement down to keep chances on upward continuation. As market remains above PS1, it means that this is just a retracement. At the same time, current level, I mean MPS1+Fib support is an edge. Market should not pass through it, otherwise, sentiment will shift to bearish.
And finally, take a look what we have simultaneously with grabber – bullish engulfing pattern. This makes our task much easier, since we know our trading swing, invalidation point and target. Thus, we are at very comfortable level – crossing of MACDP, engulfing pattern and solid support area.
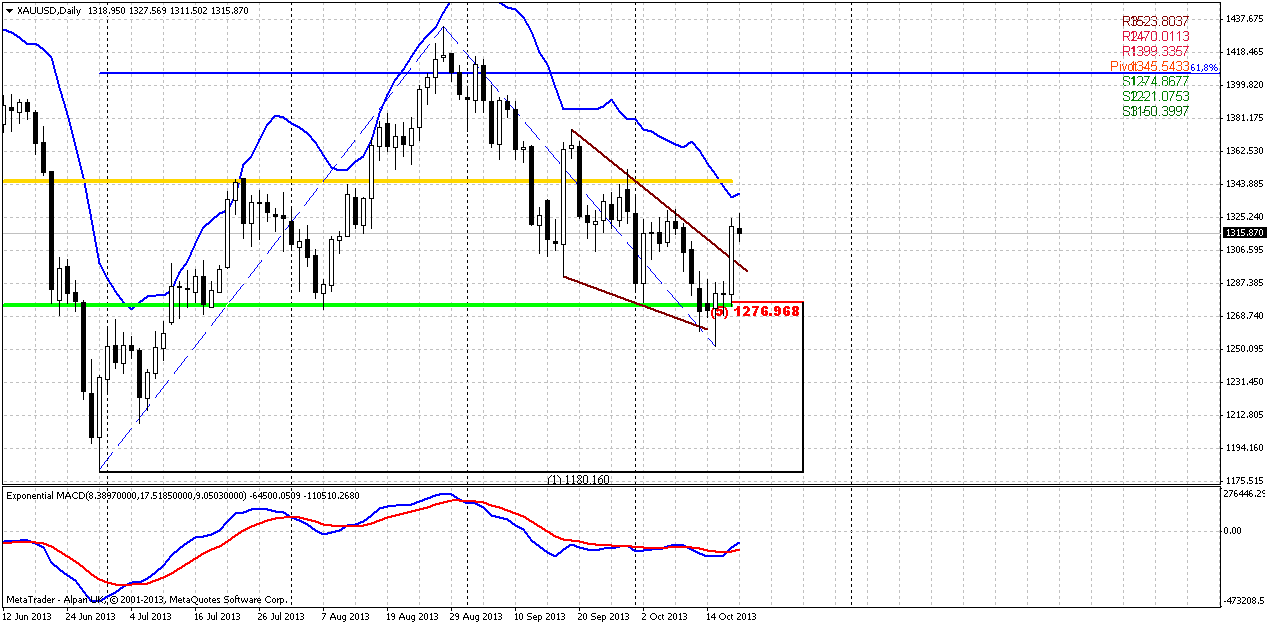
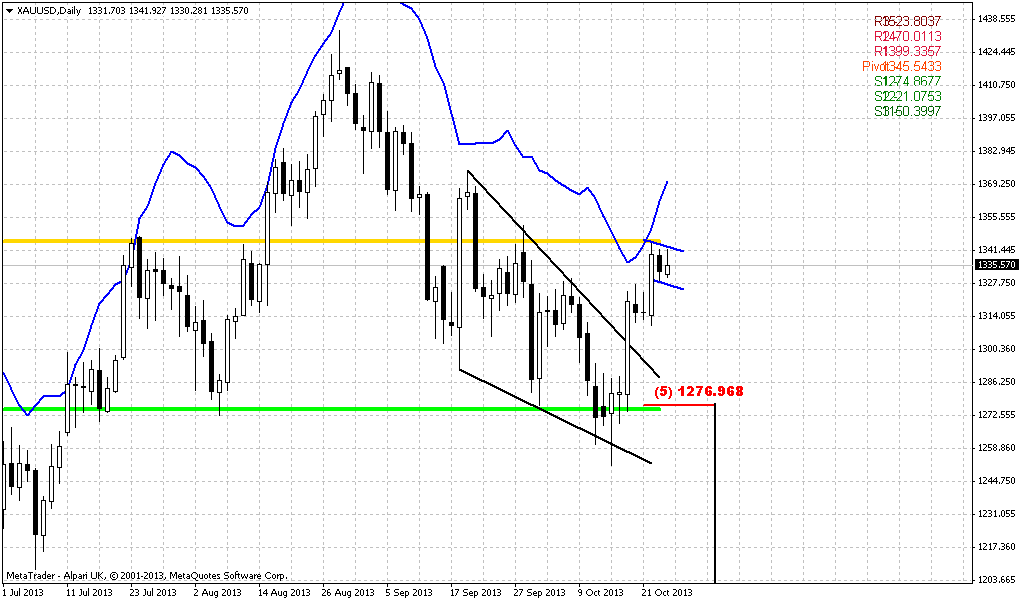
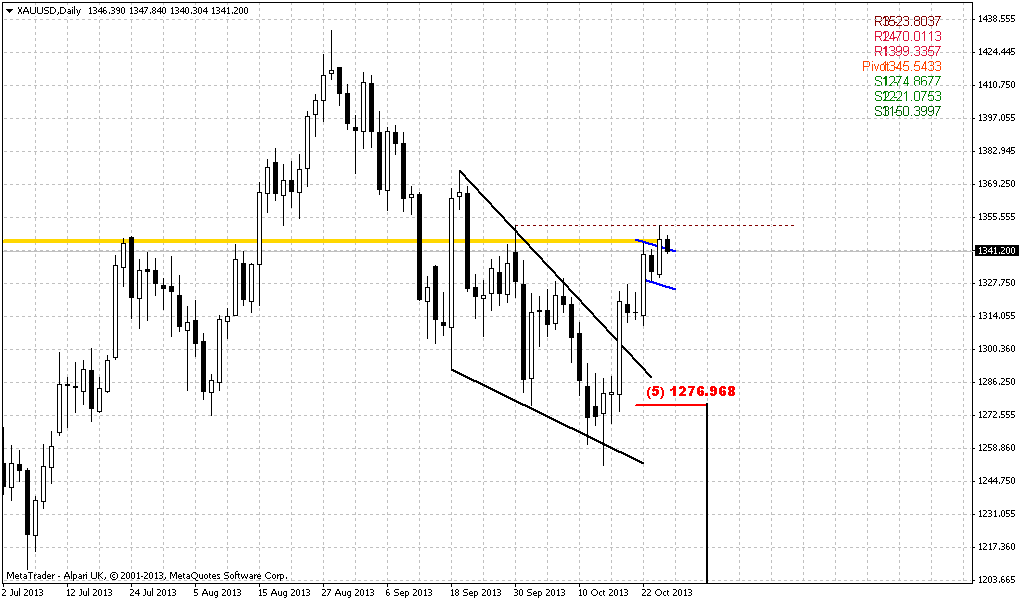
Daily
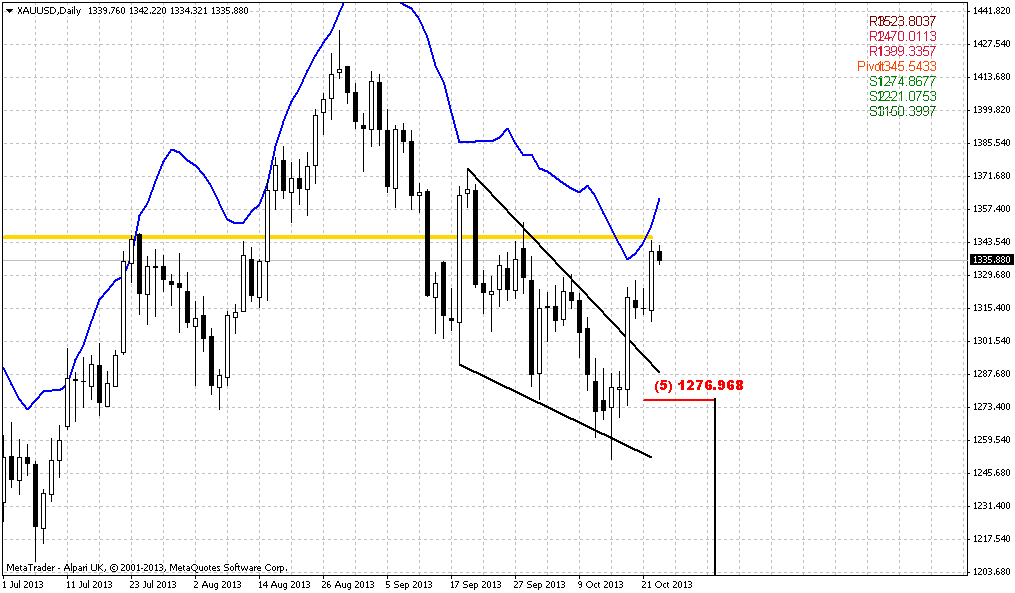
Daily picture neither shows clear patterns nor gives assistance with better understanding where we still should enter. But, daily chart provides important information still. It shows that our next resistance, despite weekly targets, is MPP around 1345, since it coincides with daily overbought and hardly market will pass through it without retracement or at least some pause. If we will take a look at a bit broader picture, then we’ll see that current action takes the shape of big AB=CD pattern with minor 0.618 target around 1400. This level could become weekly minimum target that price could reach prior FOMC meeting. And when meeting will take place, we will understand should we count on further upward move or not…Now let’s focus on entry process and first resistance level.
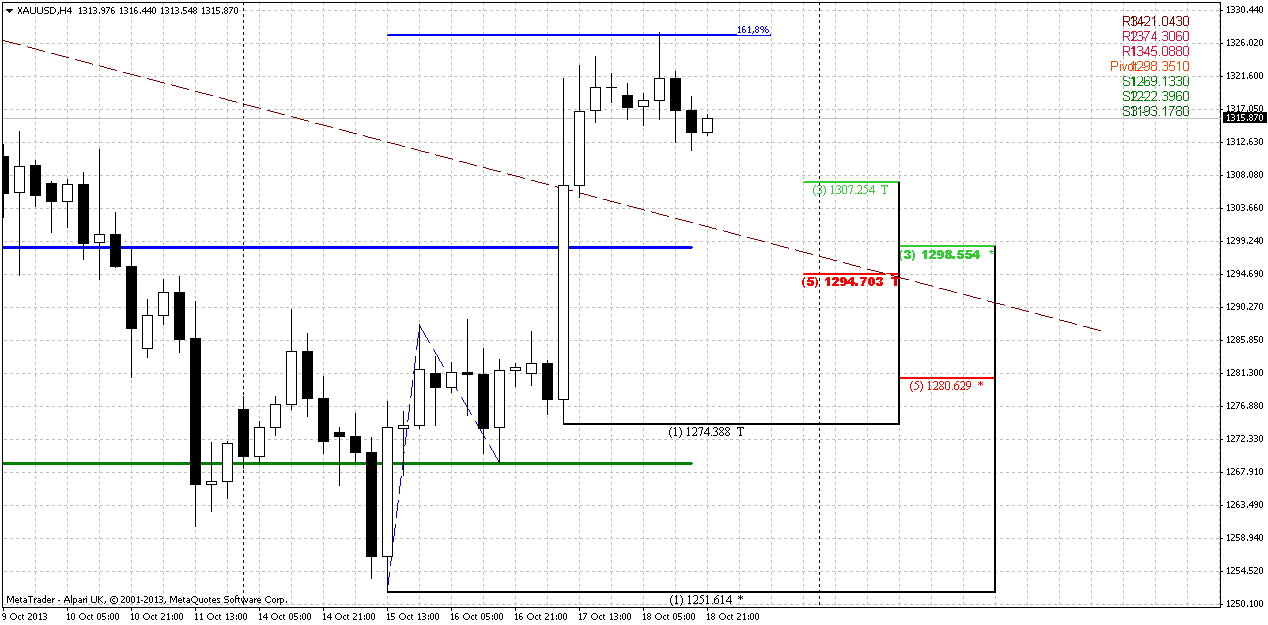
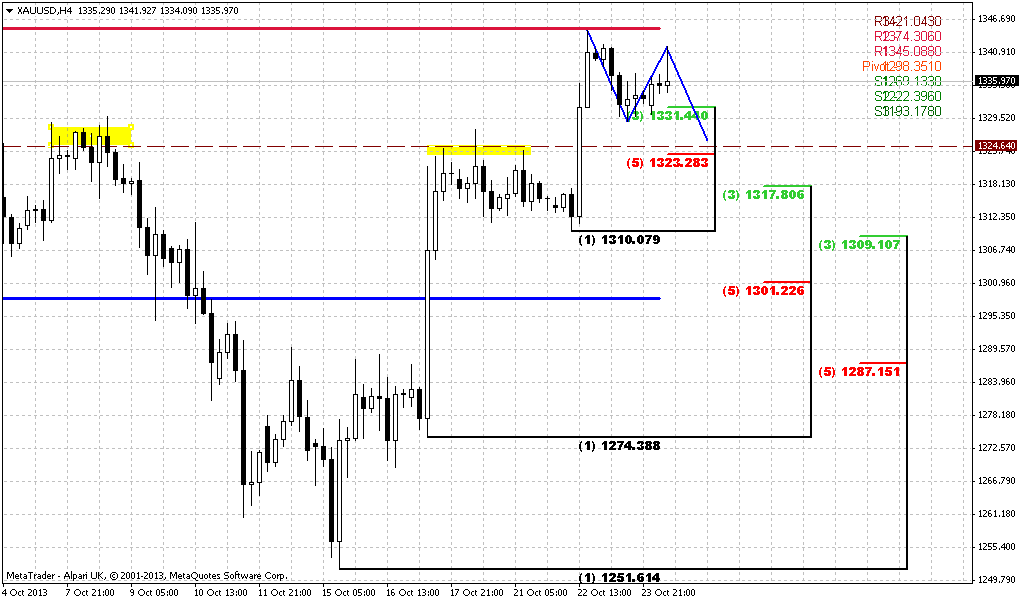
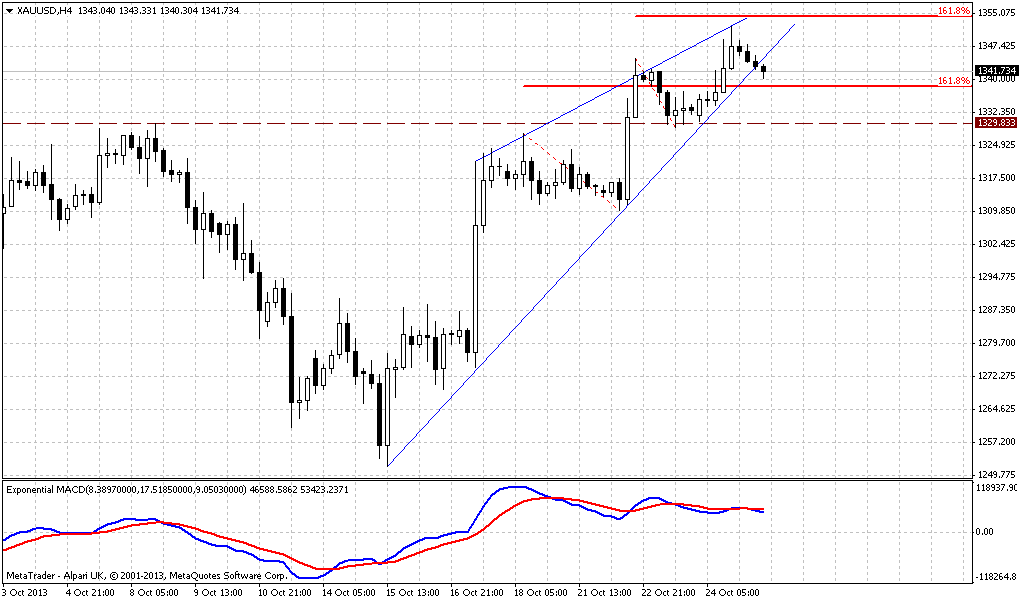
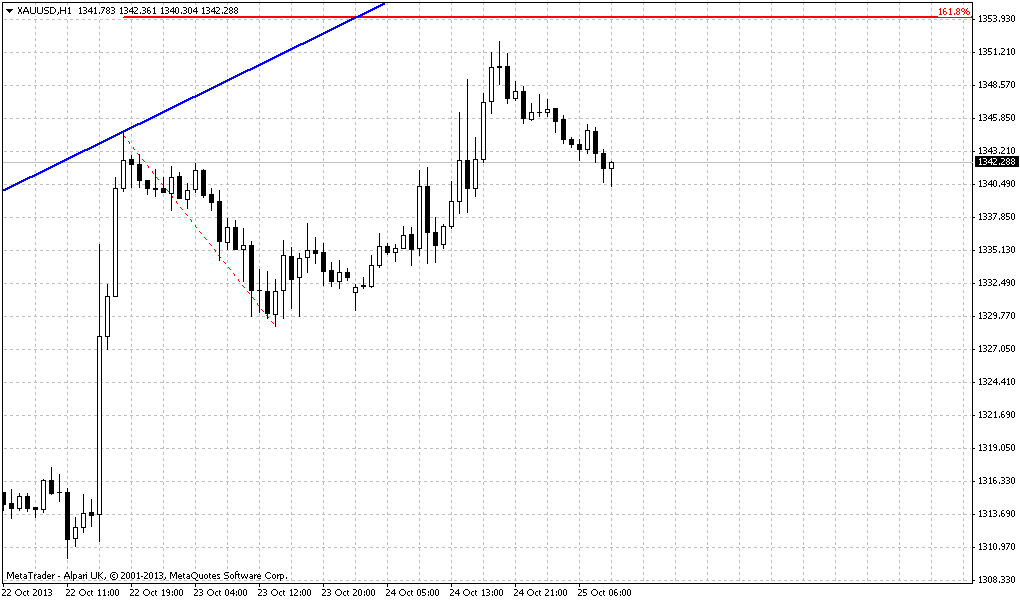
4-hour
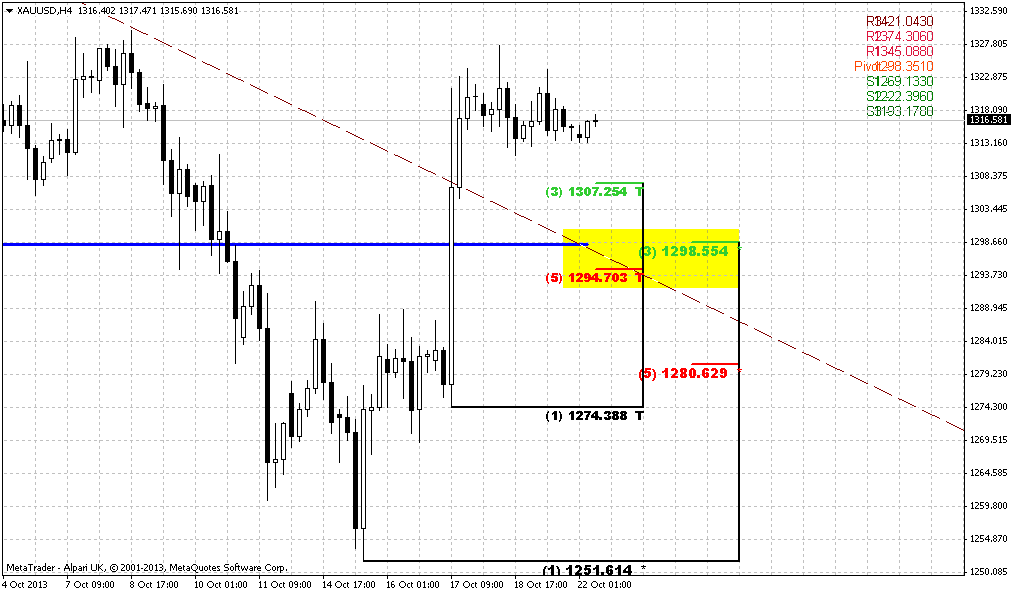
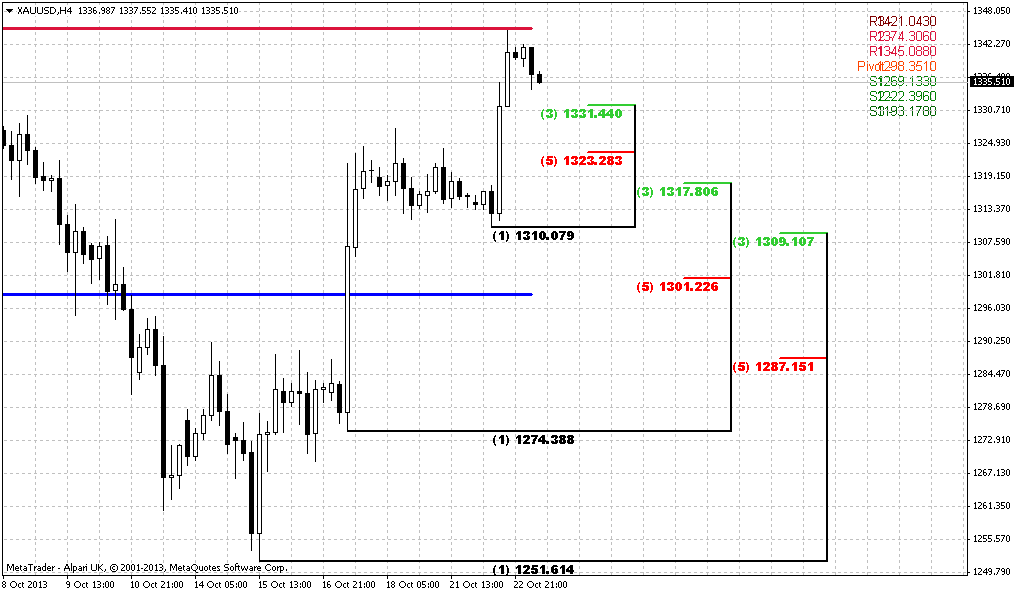
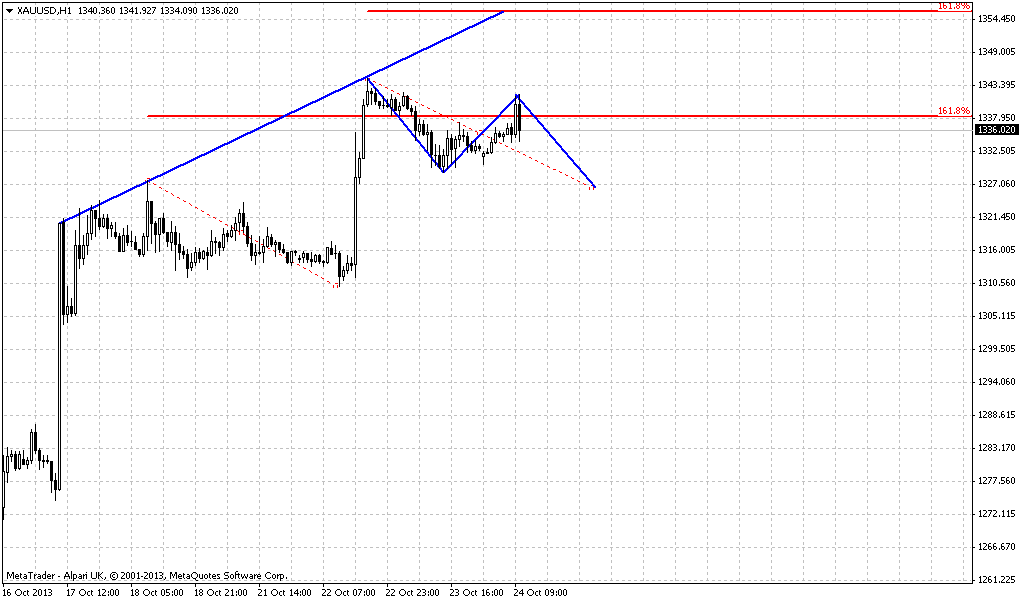
Now we’re shifting to entry process directly. As we’ve suggested in Friday’s update, market should probably hit 1.618 extension prior it will turn down and this has happened. This helps us much, because now we can say that probably market will show retracement first and move to MPP second and not vice versa. We could suggest opposite scenario if 1.618 target stands above MPP, but as market has hit major target by now, it has no objects slightly higher where it could gravitate, thus, retracement now probably will have more chances to happen. Now about levels to watch... Since market is not at oversold, retracement not neccesary will be deep, and personally I like K-support around WPP 1295-1300. But this level is important not just because this is K-support. This is also an upper border of broken daily wedge and it will be prefferable, if price will remain above it. This will keep bullish picture clean. Any return right back down will increase warning for futher upward continuation. As usual, we do not want to see nasty black candles on the way to our support. If we will get any – do not take long position. On houlry chart I do not see any patterns or anything interesting yet...
Conclusion:
Currently market stands at some edge and further action will clarify – whether we have to be ready for deeper move down, or retracement up will continue. Because now, market stands at level of 5/8 support that in general acceptable and still could treated as retracement, especially on gold and especially after solid move down. Recent upward breakout increase probability of upward deeper retracement and probably this will be really so, since we have some time till FOMC meeting. But in longer perspective, situation mostly will depend on meeting results. Market really could turn down again, since in general this corresponds with our long-term analysis and second – situation of Forex market is not quite cloudless.
The technical portion of Sive's analysis owes a great deal to Joe DiNapoli's methods, and uses a number of Joe's proprietary indicators. Please note that Sive's analysis is his own view of the market and is not endorsed by Joe DiNapoli or any related companies.
As any other market gold has felt US debt ceil relief. Still, we have more events ahead and there is not much time till them. I mean FOMC meeting on 30th of October and probably postponed NFP release. As Reuters informs - Gold fell on Friday as investors took profits after the previous session's 3 percent rally on expectations the partial U.S. government shutdown will lead the Federal Reserve to postpone tapering of its bond-buying stimulus. The precious metal was up more than 3 percent for the week, its biggest weekly gain in two months. Heavy short covering boosted gold prices after the Congress clinched an 11th-hour deal earlier this week to pull the world’s biggest economy back from the brink of debt default. However, gold's upward momentum faded on Friday, partly after data showed holdings in the world's largest bullion exchange-traded fund, SPDR Gold Trust fell 0.37 percent (2-3 tonnes) on Thursday from Wednesday. The fund posted a fourth straight week of outflows. Its holdings have fallen more than 35 percent from their December 2012 peak, and are down nearly 3 percent this month.
"It remains to be seen whether the investor community will now restart their buying of various ETF’s given that the Fed’s tapering intentions are now merely being postponed," said Edward Meir, metals analyst at brokerage INTL FC Stone. "Once the government re-opened and the agenda moved on from the debt crisis to next week's Federal Reserve meeting, that was a trigger for gold to see some upside," Mitsubishi analyst Jonathan Butler said. However, in the long run, gold is likely to sell off as soon as talks of Fed tapering resume, Butler said. Gold's 20 percent drop this year has largely been after Fed Chairman Ben Bernanke signaled earlier this year the central bank's $85 billion monthly bond-buying scheme - which had driven gold higher by keeping a lid on interest rates while stoking inflation fears - will be tapered.
So, as we can see thought already circle around future FOMC meeting. Most traders think that Fed hardly will say something that will assume increasing of QE tapering probability. But, in reality nobody knows the impact of shut down on economy, but Fed probably does. Every time I remind words of Deutsche Bank senior economist that we’ve read 2 weeks ago. When he has spoken on shut down he said - “it is too risky to sell with shut down behind”. But as shut down has passed, no these thoughts probably could appear again. All in all, this means that he has bearish view on gold and he does not sell only due shut down turmoil. Currently is a period of corporate statements and I tell you that recent reports mostly positive – Google exceeds 1000$ per share, Morgan Stanley, BofA and other companies report on earnings growth. Fed probably knows NFP data for September. What I’m aiming at is that probability of appearing some hints on QE contraction is significant, and it could happen that negative shutdown impact on US economy could be overestimated. It could be really some fundamental trap, because currently all these speeches look too smooth and sweet.
Monthly
Major concern on monthly chart is about possible pattern. What current move up will be – either still AB=CD up or downward continuation? Currently it is very difficult to make any forecasts, at. Although previous week rally stands in favor of upward action, but situation still unclear, least on monthly chart. As you know our previous analysis (recall volatility breakout - VOB) suggests upward retracement. As market has significantly hit oversold we’ve suggested that retracement up should be solid, may be not right to overbought, but still significant. Take a look at previous bounces out from oversold – everytime retracement was significant. Thus, we’ve made an assumption of possible deeper upward retracement that could take a shape of AB=CD. Couple weeks ago this move has looked nice, but now we see fast move down. It could mean that second leg of move down (as we’ve suggested by previous analysis) has started. Situation will resolve right around previous lows. If market will pass through it, then, obviously we will not see any AB=CD up.
So, as a conclusion on monthly chart we can say, that we have reasons to suggest some more upward action due strong oversold and some other moments. But current move down rather fast and it could happen that now we see not a BC leg in upward AB-CD, but downward continuation by VOB.
Weekly
We’ve said this on previous week and I repeat it again – weekly chart is a clue for medium term perspective. On previous week we’ve decided to keep an eye on possible bullish stop grabber and what do we see now – we’ve got it! This pattern assumes market appreciation at minimum slightly above MPP or even above 1435 highs. Since we still have pretty much time till FOMC, this scenario seems probable.
But, guys, if even we wouldn’t get this grabber, current situation absolutely does not contradict with upward action and even confirms this. Price behavior right now is 100% reasonable and logical. Take a look by yourself - retracement to MPS1 and 5/8 Fib support is normal, because in fact we have first swing up after long-term bear trend. We’ve discussed it previously – as bearish momentum was solid, market just can’t ignore it and have to respect. This respect appears as deep downward retracement. Besides, gold likes to show 5/8 retracements. Second – MPS1 should hold retracement down to keep chances on upward continuation. As market remains above PS1, it means that this is just a retracement. At the same time, current level, I mean MPS1+Fib support is an edge. Market should not pass through it, otherwise, sentiment will shift to bearish.
And finally, take a look what we have simultaneously with grabber – bullish engulfing pattern. This makes our task much easier, since we know our trading swing, invalidation point and target. Thus, we are at very comfortable level – crossing of MACDP, engulfing pattern and solid support area.
Daily
Daily picture neither shows clear patterns nor gives assistance with better understanding where we still should enter. But, daily chart provides important information still. It shows that our next resistance, despite weekly targets, is MPP around 1345, since it coincides with daily overbought and hardly market will pass through it without retracement or at least some pause. If we will take a look at a bit broader picture, then we’ll see that current action takes the shape of big AB=CD pattern with minor 0.618 target around 1400. This level could become weekly minimum target that price could reach prior FOMC meeting. And when meeting will take place, we will understand should we count on further upward move or not…Now let’s focus on entry process and first resistance level.
4-hour
Now we’re shifting to entry process directly. As we’ve suggested in Friday’s update, market should probably hit 1.618 extension prior it will turn down and this has happened. This helps us much, because now we can say that probably market will show retracement first and move to MPP second and not vice versa. We could suggest opposite scenario if 1.618 target stands above MPP, but as market has hit major target by now, it has no objects slightly higher where it could gravitate, thus, retracement now probably will have more chances to happen. Now about levels to watch... Since market is not at oversold, retracement not neccesary will be deep, and personally I like K-support around WPP 1295-1300. But this level is important not just because this is K-support. This is also an upper border of broken daily wedge and it will be prefferable, if price will remain above it. This will keep bullish picture clean. Any return right back down will increase warning for futher upward continuation. As usual, we do not want to see nasty black candles on the way to our support. If we will get any – do not take long position. On houlry chart I do not see any patterns or anything interesting yet...
Conclusion:
Currently market stands at some edge and further action will clarify – whether we have to be ready for deeper move down, or retracement up will continue. Because now, market stands at level of 5/8 support that in general acceptable and still could treated as retracement, especially on gold and especially after solid move down. Recent upward breakout increase probability of upward deeper retracement and probably this will be really so, since we have some time till FOMC meeting. But in longer perspective, situation mostly will depend on meeting results. Market really could turn down again, since in general this corresponds with our long-term analysis and second – situation of Forex market is not quite cloudless.
The technical portion of Sive's analysis owes a great deal to Joe DiNapoli's methods, and uses a number of Joe's proprietary indicators. Please note that Sive's analysis is his own view of the market and is not endorsed by Joe DiNapoli or any related companies.
") - which requires futher QE to stimulate economy there + Ms. Yellen;
- which requires futher QE to stimulate economy there + Ms. Yellen;