Sive Morten
Special Consultant to the FPA
- Messages
- 18,748
Fundamentals
In short-term perspective gold market mostly reacts on the same events as currency market and other. Last week this was US-China new spiral of tariff piking and US-Canada-Mexico negotiation on NAFTA.
As Reuters reports - Gold ticked higher on Friday despite a stronger dollar, as investors worried about an escalation in the U.S.-China trade dispute after fresh threats by U.S. President Donald Trump, though bullion was still headed for its fifth straight monthly decline.
“Gold is trading in a supportive environment due to increased tariffs imposed on China, said David Meger, director of metals trading at High Ridge Futures. “That is in contrast to a firmer dollar today.”
Trump is prepared to ramp up a trade war with China and has told aides he was ready to impose tariffs on $200 billion more in Chinese, Bloomberg reported on Thursday.
“Trump’s plans have had a significant impact on sentiment and the slightly weaker dollar is supporting gold,” said Peter Fertig, analyst at Quantitative Commodity Research, adding that the emerging-market currency crisis was also supporting gold.
However, the prospect of higher U.S. interest rates next month and again before the end of the year is a negative.
Yesterday we've discussed economic sentiment in US. While it has decreased a bit, but it holds on rather high levels, which let expect the same 3.5-4.0% GDP growth in 2018.
Higher U.S. rates raise the opportunity cost of holding gold, which yields no interest and costs money to store and insure. This is why many investors have sold their gold holdings, shown in exchange-traded funds (ETFs).
“The ongoing outflows from ETFs, record-high speculative shorts and upbeat U.S. economic data are still the major headwinds for gold and signify the recovery might be short- lived,” said Religare Securities analyst Sugandha Sachdeva.
In longer-term perspective situation for gold looks not very positive. Last week we already have mentioned Fathom consulting expectation of 2020 global recession. Now they tell that this is the basic scenario actually. And China is the one that could make it smoother or postpone the crisis. Although Fathom tells that sooner or later crisis should hit anyway, but China could make impact on when and how it will happen.
Now, developed economies are running hot again, with output at or above trend and unemployment at or below equilibrium. Normally, the result would be inflation, higher interest rates or a global recession (that is Fathom’s central forecast). But China could prevent that outcome from occurring once again, by redoubling its efforts to increase its export markets by cutting prices even further — either through a weaker currency (which is already happening) or through increased subsidies for exporters (which might be happening). This time around, it will be harder to achieve, since the price-level effects of cheap Chinese labour are already reflected in global prices, and China’s share of global manufacturing exports has already passed the peak that any other industrialising economy has ever achieved. This time, it would mean the dollar price of Chinese exports to the US (and other developed economies) falling sharply, and continuously for the coming few years, not just holding as it did ahead of the great financial crisis.

Should that happen, inflation would not rise in developed economies, interest rates would stay low, and a recession would be avoided in the short term. But then another credit cycle would take hold, and another banking crisis — albeit a few years away still — is the likely outcome. That is Fathom’s risk scenario.
So, it’s a small amount of pain for the global economy soon; or a lot of pain, later. China will decide.
So, this perspective, which stands not too far, actually, brings mix perspectives for the gold. If it will be a lot of pain, as it is described, then demand for the gold will be significant. Investors will be interested in return OF the investments rather than return ON the investments, as it was in 2008. Smooth scenario probably will have negative impact on gold, because of low inflation. Still, one thing we could say definitely - situation on gold market should drastically change within 2 years.
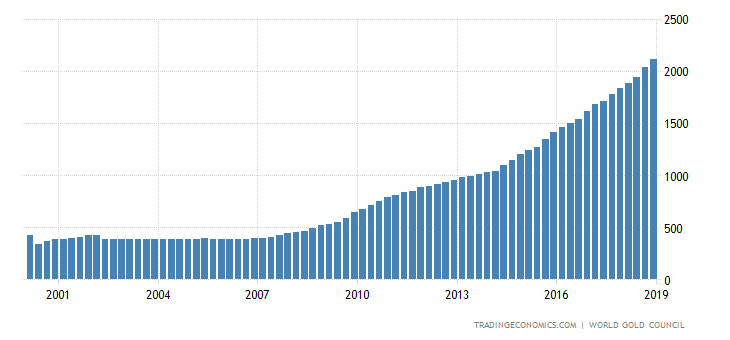
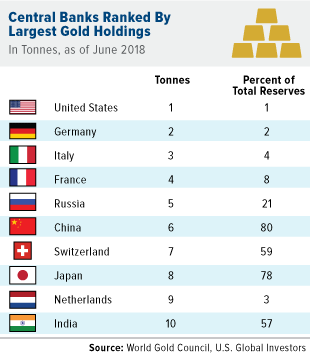
My personal gut feeling, guys, is gold will jump up. We see breaking of economical relations that last for decades. Mutual tariff piking works as decay for dollar, because now having dollar and using it in transactions is treated as additional risk factor rather than advantage. Some countries turn to using of mutual domestic currencies in trading. China and Russia are buying gold in huge amount.
Russia comes on 4th place in global largest gold reserves:
May be couple years ago I wouldn't pay too much attention to that. But, seeing now how events are twisting and turning around Russia & Co, I suppose that Mr. Putin knows something and prepares to something. Taking all this stuff together, IMO - gold rising looks more probable within 2-3 years. Breaking of old global system never happens without big collapses. And Big and painful collapses are everything for gold...
CFTC position has not changed significantly. As gold has turned to upside bounce, open interest has dropped for ~60 K contracts. SPDR Fund continues to light the store and lost another ~10 tonnes of gold within a week.
It means that despite long-term warnings and technical bounce overall sentiment mostly stands bearish still.
Technical
Monthly
Market stands in upside retracement right now that's why monthly/weekly time frames barely have changed.
Previously we already explain major points of our view on gold market and explained why we worry on acceleration of bearish performance here.
Slowly but stubbornly gold market moves lower and result of this move could be seen even on monthly chart. The crucial, decisive bearish moment happens not now, it has happened at the end of 2017.
Long-term trend line has been broken in July and as we've said last time - "If this line will be broken - gold could start dropping with acceleration."
Fundamental irrational behavior which we've disclosed earlier now starts to show continuation. Recall our conclusion that we've made since the beginning of the year. That was decisive moment that we've mentioned:
"most important moment for long-term gold right now is ability to move higher. 1327 level is long-term COP target of AB-CD started at 1046$, in July 2015. First it was reached in July 2017. After logical minor bounce price returns back to it. But right now it should be an action higher, to next 1450 target, which is OP of the same AB-CD.
If gold will not be able to do it - strong drop is possible, because price will fail to proceed next extension leg, showing inability and lack of strength to do it. This could break whole AB-CD construction. Besides, this standing below "B" point also keep door open for downside butterfly. As longer gold will stand under resistance as weaker it position will be."
Now take a look at price action that we have. Market has failed to break 1360 top, which means that it has failed to proceed to OP target. Which, in turn, means breaking of CD leg. This process has not finished yet, but signs that we see right now makes us worry.
Besides, we have W&R of 1360 COP top, which also has bearish sentiment.
Our hopes to get bulilsh grabber on May were vanished as price has closed below MACDP line. Trend now stands bearish here.
That's being said, on long-term chart gold looks heavy and weak and overall picture is not attractive for taking long-term bullish position. The fact that gold disrespect 1215 major support and Agreement area, but proceeds directly to YPS1 - just proves the weakness. YPS1 is quite important for any market. Breaking of this level will let us to treat gold action as new bear trend, and previous upside action to 1380 as just a retracement. Next target here, on monthly is 1120 lows, but first is - reaction of the market on YPS1 that we see right now:

Weekly
So our bet on upside action was correct. Although this week is inside one, but overall performance is positive as gold shows tail close and we do not have overbought here. Since this is long-term chart, the major patterns that we're waiting for are mostly the same. Here we do not have clear engulfing pattern, but price action stands the same by its nature - V-shape upside reversal on daily time frame. It lets us to suggest the same action as on EUR, where we have weekly morning star - some retracement down before next leg of upward action.
Weekly time frame is the one that gives us the vision for few weeks. In a longer-term view we still have large AB=CD pattern with OP around 1113 area. Sooner or later but probably it should be reached. Just because gold has dropped easily through 1215 major support and has not stopped at 1180 YPS1 but collapsed right to 1160. So, now price action stands between COP and OP target. Usually in such placement, price gravitates to OP, because in fact, it has no strong support lower, its a free space. And the only thing that keeps gold from disaster is Oversold condition, which important for us in short-term view.
Oversold suggests upside bounce at least to 3/8 resistance area - 1238$. It looks far on weekly chart, but in reality, this is just 30% and common response to reaching of OS. Since our major direction is down - we're mostly looking for chances to go short here, and upside bounce to Fib level could give us B&B "Sell". That's particular the pattern that we will be watching for here:

Daily
On daily chart we see that gold wasn't able to proceed higher on Friday. Two days ago upside bounce from intraday K-support looked good, but still gold wasn't able to reach new highs and dropped back.
Now price stands in the same flag pattern that we've mentioned on Friday, and it looks bullish. But, inability of gold market to re-establish upside action from strong intraday support makes us to take careful view on intraday picture.

Intraday
Here, guys, situation still stands bullish. After good upside action out from K-support area market shows pullback, but no new lows have been created. Price action reminds bullish dynamic pressure. Although we still could get AB-CD down inside the flag, but butterfly scenario to me looks probable.

On hourly chart we also have nice hidden bullish divergence with MACD right at the point where our butterfly "Buy" has been completed.
On Friday we also have mentioned possible reverse H&S pattern here, and now right arm bottom is already in place. So, you could control situation with this pattern. IF gold will drop lower, back to 1195 - expect deeper action down on 4H chart. While keeping H&S valid will play in favor of 4H butterfly pattern and upside continuation:

Conclusion
It is no changes in our expectations within few weeks - we still watch for upside retracement continuation with approx. target around 1238-1250 (major weekly K-resistance area.)
The technical portion of Sive's analysis owes a great deal to Joe DiNapoli's methods, and uses a number of Joe's proprietary indicators. Please note that Sive's analysis is his own view of the market and is not endorsed by Joe DiNapoli or any related companies.
In short-term perspective gold market mostly reacts on the same events as currency market and other. Last week this was US-China new spiral of tariff piking and US-Canada-Mexico negotiation on NAFTA.
As Reuters reports - Gold ticked higher on Friday despite a stronger dollar, as investors worried about an escalation in the U.S.-China trade dispute after fresh threats by U.S. President Donald Trump, though bullion was still headed for its fifth straight monthly decline.
“Gold is trading in a supportive environment due to increased tariffs imposed on China, said David Meger, director of metals trading at High Ridge Futures. “That is in contrast to a firmer dollar today.”
Trump is prepared to ramp up a trade war with China and has told aides he was ready to impose tariffs on $200 billion more in Chinese, Bloomberg reported on Thursday.
“Trump’s plans have had a significant impact on sentiment and the slightly weaker dollar is supporting gold,” said Peter Fertig, analyst at Quantitative Commodity Research, adding that the emerging-market currency crisis was also supporting gold.
However, the prospect of higher U.S. interest rates next month and again before the end of the year is a negative.
Yesterday we've discussed economic sentiment in US. While it has decreased a bit, but it holds on rather high levels, which let expect the same 3.5-4.0% GDP growth in 2018.
Higher U.S. rates raise the opportunity cost of holding gold, which yields no interest and costs money to store and insure. This is why many investors have sold their gold holdings, shown in exchange-traded funds (ETFs).
“The ongoing outflows from ETFs, record-high speculative shorts and upbeat U.S. economic data are still the major headwinds for gold and signify the recovery might be short- lived,” said Religare Securities analyst Sugandha Sachdeva.
In longer-term perspective situation for gold looks not very positive. Last week we already have mentioned Fathom consulting expectation of 2020 global recession. Now they tell that this is the basic scenario actually. And China is the one that could make it smoother or postpone the crisis. Although Fathom tells that sooner or later crisis should hit anyway, but China could make impact on when and how it will happen.
Now, developed economies are running hot again, with output at or above trend and unemployment at or below equilibrium. Normally, the result would be inflation, higher interest rates or a global recession (that is Fathom’s central forecast). But China could prevent that outcome from occurring once again, by redoubling its efforts to increase its export markets by cutting prices even further — either through a weaker currency (which is already happening) or through increased subsidies for exporters (which might be happening). This time around, it will be harder to achieve, since the price-level effects of cheap Chinese labour are already reflected in global prices, and China’s share of global manufacturing exports has already passed the peak that any other industrialising economy has ever achieved. This time, it would mean the dollar price of Chinese exports to the US (and other developed economies) falling sharply, and continuously for the coming few years, not just holding as it did ahead of the great financial crisis.
Should that happen, inflation would not rise in developed economies, interest rates would stay low, and a recession would be avoided in the short term. But then another credit cycle would take hold, and another banking crisis — albeit a few years away still — is the likely outcome. That is Fathom’s risk scenario.
So, it’s a small amount of pain for the global economy soon; or a lot of pain, later. China will decide.
So, this perspective, which stands not too far, actually, brings mix perspectives for the gold. If it will be a lot of pain, as it is described, then demand for the gold will be significant. Investors will be interested in return OF the investments rather than return ON the investments, as it was in 2008. Smooth scenario probably will have negative impact on gold, because of low inflation. Still, one thing we could say definitely - situation on gold market should drastically change within 2 years.
My personal gut feeling, guys, is gold will jump up. We see breaking of economical relations that last for decades. Mutual tariff piking works as decay for dollar, because now having dollar and using it in transactions is treated as additional risk factor rather than advantage. Some countries turn to using of mutual domestic currencies in trading. China and Russia are buying gold in huge amount.
Russia comes on 4th place in global largest gold reserves:
CFTC position has not changed significantly. As gold has turned to upside bounce, open interest has dropped for ~60 K contracts. SPDR Fund continues to light the store and lost another ~10 tonnes of gold within a week.
It means that despite long-term warnings and technical bounce overall sentiment mostly stands bearish still.
Technical
Monthly
Market stands in upside retracement right now that's why monthly/weekly time frames barely have changed.
Previously we already explain major points of our view on gold market and explained why we worry on acceleration of bearish performance here.
Slowly but stubbornly gold market moves lower and result of this move could be seen even on monthly chart. The crucial, decisive bearish moment happens not now, it has happened at the end of 2017.
Long-term trend line has been broken in July and as we've said last time - "If this line will be broken - gold could start dropping with acceleration."
Fundamental irrational behavior which we've disclosed earlier now starts to show continuation. Recall our conclusion that we've made since the beginning of the year. That was decisive moment that we've mentioned:
"most important moment for long-term gold right now is ability to move higher. 1327 level is long-term COP target of AB-CD started at 1046$, in July 2015. First it was reached in July 2017. After logical minor bounce price returns back to it. But right now it should be an action higher, to next 1450 target, which is OP of the same AB-CD.
If gold will not be able to do it - strong drop is possible, because price will fail to proceed next extension leg, showing inability and lack of strength to do it. This could break whole AB-CD construction. Besides, this standing below "B" point also keep door open for downside butterfly. As longer gold will stand under resistance as weaker it position will be."
Now take a look at price action that we have. Market has failed to break 1360 top, which means that it has failed to proceed to OP target. Which, in turn, means breaking of CD leg. This process has not finished yet, but signs that we see right now makes us worry.
Besides, we have W&R of 1360 COP top, which also has bearish sentiment.
Our hopes to get bulilsh grabber on May were vanished as price has closed below MACDP line. Trend now stands bearish here.
That's being said, on long-term chart gold looks heavy and weak and overall picture is not attractive for taking long-term bullish position. The fact that gold disrespect 1215 major support and Agreement area, but proceeds directly to YPS1 - just proves the weakness. YPS1 is quite important for any market. Breaking of this level will let us to treat gold action as new bear trend, and previous upside action to 1380 as just a retracement. Next target here, on monthly is 1120 lows, but first is - reaction of the market on YPS1 that we see right now:
Weekly
So our bet on upside action was correct. Although this week is inside one, but overall performance is positive as gold shows tail close and we do not have overbought here. Since this is long-term chart, the major patterns that we're waiting for are mostly the same. Here we do not have clear engulfing pattern, but price action stands the same by its nature - V-shape upside reversal on daily time frame. It lets us to suggest the same action as on EUR, where we have weekly morning star - some retracement down before next leg of upward action.
Weekly time frame is the one that gives us the vision for few weeks. In a longer-term view we still have large AB=CD pattern with OP around 1113 area. Sooner or later but probably it should be reached. Just because gold has dropped easily through 1215 major support and has not stopped at 1180 YPS1 but collapsed right to 1160. So, now price action stands between COP and OP target. Usually in such placement, price gravitates to OP, because in fact, it has no strong support lower, its a free space. And the only thing that keeps gold from disaster is Oversold condition, which important for us in short-term view.
Oversold suggests upside bounce at least to 3/8 resistance area - 1238$. It looks far on weekly chart, but in reality, this is just 30% and common response to reaching of OS. Since our major direction is down - we're mostly looking for chances to go short here, and upside bounce to Fib level could give us B&B "Sell". That's particular the pattern that we will be watching for here:
Daily
On daily chart we see that gold wasn't able to proceed higher on Friday. Two days ago upside bounce from intraday K-support looked good, but still gold wasn't able to reach new highs and dropped back.
Now price stands in the same flag pattern that we've mentioned on Friday, and it looks bullish. But, inability of gold market to re-establish upside action from strong intraday support makes us to take careful view on intraday picture.
Intraday
Here, guys, situation still stands bullish. After good upside action out from K-support area market shows pullback, but no new lows have been created. Price action reminds bullish dynamic pressure. Although we still could get AB-CD down inside the flag, but butterfly scenario to me looks probable.
On hourly chart we also have nice hidden bullish divergence with MACD right at the point where our butterfly "Buy" has been completed.
On Friday we also have mentioned possible reverse H&S pattern here, and now right arm bottom is already in place. So, you could control situation with this pattern. IF gold will drop lower, back to 1195 - expect deeper action down on 4H chart. While keeping H&S valid will play in favor of 4H butterfly pattern and upside continuation:
Conclusion
It is no changes in our expectations within few weeks - we still watch for upside retracement continuation with approx. target around 1238-1250 (major weekly K-resistance area.)
The technical portion of Sive's analysis owes a great deal to Joe DiNapoli's methods, and uses a number of Joe's proprietary indicators. Please note that Sive's analysis is his own view of the market and is not endorsed by Joe DiNapoli or any related companies.