GOLD PRO Weekly September 23-27, 2013

yes, everything is only a matter of time. time and cycles, very important. from what i've been looking at, the key seems to be able to determine the direction change just at the beginning either of a new or full moon cycle. sometime the market changes direction right when it goes from one band to the other. sometimes it takes a couple of period before it happens. and sometimes, it takes a couple of periods before the trend from the previous band just resumes.

no matter the case, there always some nice moves about to start. then it just becomes a matter of watching how market will behave at the open of a session. speaking of time, for the european session, 5.30 - 6 am London time seems to give some nice opportunities. but personally i don't like trading the European session. it's more tricky often than not. the direction during the Asian and NY sessions are easier to figure out. speaking of NY, watch what happens between 7.30 and 8.30 am--of course, i don't mean exactly at 7.30 or 8.30; sometimes it starts around 7 am, sometimes later, and sometimes after 8.30 or sometimes you have to wait until 9 or 9.15 am. but there seems to be some quite distinct market behavior taking place anywhere between 7 to 8.30-9am, and then market does something else after 8.30-9ish or so. --> when we do NOT HAVE market moving news!

on a big news day, like last Thursday, then the above doesn't matter.
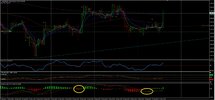
 
When is a fib level broken?

sive

that 50% fib dkami and i were mentioning, on H4 and lower it has been pierced by about 100 pips or so.

1- does that mean it is broken now?

2- but if it is, then why does market still respect it as SPPT?

3- since it is still SPPT as NY PA showed yesterday, and it has been tested 2x, i remember you saying that the more test of a level and the weaker it gets --> does this mean that now, if market goes back down again and re-tests it, we have a higher probability of breaking that 50% retrace?

Hi Triantus,
I think so, but not only because of penetration. Currently market is forming potentially bullish patterns on hourly chart. Return right to 50% level, i.e. to current lows will lead to total erasing of them. This will be bearish per se. And as a consequence, this could lead to breakout of 50% level and move at minimum o 5/8.
 
My H4 resistance @ $1331 was broken,now I have a W1 resistance @ $1337.38 W1 close above this will be nice:)

Sive I have a couple of questions if you would be so kind to answer

First is what is the blue line on your H1 chart around $1331 area?

second is how did you enter on this H1 butterfly, what are your rules to enter?
Did you put limit order buy @ 161.8fib or do you wait for solid bounce off the 161.8fib to make sure there is support there @ that level before jumping in?
 
sive

that 50% fib dkami and i were mentioning, on H4 and lower it has been pierced by about 100 pips or so.

1- does that mean it is broken now?

2- but if it is, then why does market still respect it as SPPT?

3- since it is still SPPT as NY PA showed yesterday, and it has been tested 2x, i remember you saying that the more test of a level and the weaker it gets --> does this mean that now, if market goes back down again and re-tests it, we have a higher probability of breaking that 50% retrace?

The 50fib I'm talking about is the 50fib that Sive has on his D1 charts and not the 50fib Sive has on the lower TF's H4,H1

My second entry was going to be around this 50fib but after the bounce off the 50fib the H1 closed was to close to my 1st entry so I simply didn't need to take it:)
 
Last edited:
My H4 resistance @ $1331 was broken,now I have a W1 resistance @ $1337.38 W1 close above this will be nice:)

Sive I have a couple of questions if you would be so kind to answer

First is what is the blue line on your H1 chart around $1331 area?

second is how did you enter on this H1 butterfly, what are your rules to enter?
Did you put limit order buy @ 161.8fib or do you wait for solid bounce off the 161.8fib to make sure there is support there @ that level before jumping in?

Hi Dkami,
blue line without any markings - is WPP.
Blue line near the bottom of the picture is 76.8% support from upward thrust of previous week (FOMC meeting).
I've entered according to classical rules for Butterfly trading (as in Military School) - right at 1.618 point with small stop. Unfortunately I can't check where was first stop (i've moved it later to b/e), but entry was at 1308. stop probably somewhere at 1304-1305. Then I move it at b/e when market has reached 1314-1315.
 
yes, everything is only a matter of time. time and cycles, very important. from what i've been looking at, the key seems to be able to determine the direction change just at the beginning either of a new or full moon cycle. sometime the market changes direction right when it goes from one band to the other. sometimes it takes a couple of period before it happens. and sometimes, it takes a couple of periods before the trend from the previous band just resumes.

no matter the case, there always some nice moves about to start. then it just becomes a matter of watching how market will behave at the open of a session. speaking of time, for the european session, 5.30 - 6 am London time seems to give some nice opportunities. but personally i don't like trading the European session. it's more tricky often than not. the direction during the Asian and NY sessions are easier to figure out. speaking of NY, watch what happens between 7.30 and 8.30 am--of course, i don't mean exactly at 7.30 or 8.30; sometimes it starts around 7 am, sometimes later, and sometimes after 8.30 or sometimes you have to wait until 9 or 9.15 am. but there seems to be some quite distinct market behavior taking place anywhere between 7 to 8.30-9am, and then market does something else after 8.30-9ish or so. --> when we do NOT HAVE market moving news!

on a big news day, like last Thursday, then the above doesn't matter.
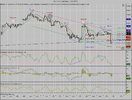
Yea you can enter on market cycle rather risky unless your in CON-gress in my view, I just try keep things simple and enter on Japanese candle pattern:)
 
Last edited:
Hi Dkami,
blue line without any markings - is WPP.
Blue line near the bottom of the picture is 76.8% support from upward thrust of previous week (FOMC meeting).
I've entered according to classical rules for Butterfly trading (as in Military School) - right at 1.618 point with small stop. Unfortunately I can't check where was first stop (i've moved it later to b/e), but entry was at 1308. stop probably somewhere at 1304-1305. Then I move it at b/e when market has reached 1314-1315.

Ok thanks

I hope this stop grabber you talked about friday doesn't play out!
 
Hi Sive,
been a slow week on gold so far to say the least:)

I see bullish hidden divergence on H1 but I cant see the bearish divergence on H4 like you talked about?
Gold 5.jpg

Enjoy and look forward to your analysis next week!
 
Moon phases w/first and last quarters added to chart

for fun, look at this chart: https://www.tradingview.com/x/3jNpodaU/

the white circles represent the new moon, and the dark circles, the full moon.

EDIT: just replaced chart with a more recent snapshot as it shows the downside continuation better now[/QUOTE]

Triantus; I've been following Sive for about 3 years now and I came across your tread about moon charts. I follow the moon phases very closely and have made my own observations. Here goes:

New: Usually good safe trading period; 2-4 days before phase begins excellent entry to follow the trend. - watch for excellent entry within 5 days before totality - trading opportunities before; during and after totality with excellent price action.

First quarter: Reinforces current trend; good trading opportunities. Entry within 2 days before totality of this phase. Obvious entry and exits

Full: Greatest price action during this phase; 5 days before totality then 3 days after. (trend change is possible). Of all the phases this has the most dramatic effect on price action. Like gravity; strong pull toward then release. Characteristics of a celestial body that transits a planet that is influenced by it's gravitational pull as it approaches, then release as it passes by. (trend change)

Last quarter: Ends the trend: 18 hours before totality. Expect dramatic changes to follow this phase. However, if trend continues expect strong price movement with the trend.

If you want to plot your own charts: www.calendar-365.com/moon-phases.html is an excellent source.

Have fun with it and watch out for that last quarter: Ends the trend

Michael
 

Attachments

  • GC 12-13 (240 Min)  10_1_2013.jpg
    GC 12-13 (240 Min) 10_1_2013.jpg
    184.6 KB · Views: 5
Back
Top