Sive Morten
Special Consultant to the FPA
- Messages
- 18,754
Fundamentals
Major event on passed week has happened on Thursday when Fed Reserve announced continuation of QE program. Although gold market falls withing recent year and one of the major reason for that is anemic inflation, but such news was too much even for current gold market and it has splashed prices up. Later, on Friday, Saint Louis Fed president said the U.S. central bank might move next month to reduce stimulus spending that has bolstered bullion for years. That has led to aggressive sell off and profit taking and has erased solid part of previous growth. At the same time, Mr. Bullard said that “if inflation and employment will continue to show stronger data” then Fed could announce QE contraction. Whether this data will show growth we don’t know. That’s why this is not a great hint or some kind of promise, this is mostly suggestion. Besides, as experts tell, Mr. Bullard mostly a centrist in FOMC, and in fact, mostly in will depend on how many hawkish members in FOMC that could push equilibrium on QE contraction. We’ll see. "The gold market had rallied substantially on tapering being taken off the table. Now Bullard's comments have injected some uncertainty near term, and that has prompted a wave of selling in the gold and the precious metals complex," said James Steel, chief precious metals analyst at HSBC to Reuters.
Option-related selling accelerated gold's decline, said Comex gold options floor trader Jonathan Jossen, noting that many participants exercised put options after heavy buying of inexpensive puts following Wednesday's rally. Relatively thin volume during gold's rally this week also suggested that gains could be short lived. In addition, a two-percent drop of open interest in Comex gold futures on Wednesday showed the post-Fed rally was driven by investors who bought back previously bearish bets instead of new money. Gold prices fell faster after declining below a key technical support at $1,345 where the 50-day and 100-day moving averages were converging, analysts said.
Commodity hedge fund Clive Capital told investors it will close down, the latest commodity fund to call it a day. It blamed a lack of investment opportunities for its poor performance and outflows. Sean McGillivray, head of asset allocation at Oregon-based Great Pacific Wealth Management, said to Reuters that there were some "sell-the-rumor" type selling on Clive's news, as worries about panic selling by funds could further pressure gold. A gauge of investor interest, holdings in the world's largest gold exchange-traded fund, the SPDR Gold Trust, rose 0.88 tonnes, or 0.1 percent to 912 tonnes on Thursday. But this growth obviously is just nominal rather than sizable.
CFTC data still shows flat action, at least open interest has not changed much within previous month. At the same time most recent data shows decreasing of net long positions. Since I do not find any clarification on silver CFTC data, I’ve decided to take a look at copper. Surely this is absolutely different commodity, but it is good barometer of economy and within current year open interest is decreasing simultaneously with growing of net long position. So, it could mean and relatively confirm that it is not as good with economy as it seems on surface. And this action stands in agreement with FOMC decisions, right? As net speculative position has turned to short, open interest stops falling.

So, in short term perspective recent fears on market that were before FOMC meeting are started to return back. Now the major question is: will it lead to re-establishing of long term bear trend again?
Monthly
On previous week market has shown solid action on lower time frames, but it couldn’t be seen here, on monthly. Thus, monthly chart almost has not changed from previous week and analysis that we’ve made previously stands the same.
September black candle is not a tragedy and even looks absolutely reasonable. Take a look, we have almost a year of consequtive drop – month by month. Previous 2 candles were the first ones up. Bearish momentum is not disappear it still on the market and presses on it, does not let market freely change sentiment. Thus, such sort of “returns” should not surprise us. All other analysis here is still the same. Current move down probably should become a part of compounded retracement up, until market will not take current lows. Only in this case we could say that bearish trend has continued.
We keep in mind Volatility breakout pattern and know that there will be 3-leg downward action. This means that current bounce will be just retracement probably. Second, currently we know that market at support – Fib support, target of rectangle breakout, completion of double harmonic swing down and monthly deep oversold. Unfortunately monthly chart does not give us much assistance in short-term trading. One bullish pattern that probably could be seen here is bullish DiNapoli “Stretch” pattern, since market stands at deep oversold right at Fib support. Target of this pattern is a middle between Oscillator Predictor Bands – right around 1550$ area. That is also the lower border of long-term consolidation after historical peak. S&P analyst specifies approximately the same target. This area agrees with “Stretch” pattern as well.

Weekly
As we’ve said previously that it is too early to panic that market has started move down again. Current price action is absolutely normal for reversal swing. Trend holds bullish, market stands at 50% support level and MPS1. Most recent candle mostly indicates indecision, since price has closed around open level. Some kind of high wave pattern, and it is reasonable by taking into consideration moments that we’ve discussed in fundamental part of research. Retracement down is also reasonable, since market has hit major 0.382 Fib resistance level. Taking into consideration previous bearish power and momentum, market just can’t show light retracement, since momentum is still here and it should be fade out particularly by deep retracements. But what about low volumes on futures that was mentioned above? This is also absolutely logical. If you ever saw the trading volumes of any reversal patterns, say, H&S, or Double top or bottom, you know that first bounce up shows low volumes and first return back down shows greater volumes, because by previous momentum market treats it as retracement and makes attempt to continue move down. But when it fails to do that and sentiment is starting to change, then volume starts to change places and becomes greater on growth. Here we have the same. This is first bounce up and it has to have weak volumes. If market will form here some reversal pattern, then weak volumes in final swings of this pattern will be a worrying sign. In the beginning it’s normal. That’s being said, I do not see any hazard here for bullish development yet, all action absolutely logical. And in general, we probably will say that market has re-established bearish trend only if it will take out current lows around 1170. Or if we will see some clear signs of inability to move higher.

Daily
You, guys, probably remember this chart that we’ve discussed on Thursday:

And we could say that it’s all OK with it, if we wouldn’t get this pattern on Friday. I’m speaking about bearish stop grabber that makes as overall analysis very difficult as situation here tricky. This pattern suggests deeper move down and taking out previous lows. This makes possible retracement to major 5/8 level around 1277. This is not a problem from perspective of reverse H&S pattern, although it will start look a bit worse than it looks now. Second is – we understand why this bounce has happened. Fundamentally we’ve clarified this and from technical point of view – market has hit overbought around 5/8 Fib resistance and MPP.
On the next chart below I show you why I’m a bit upset with this stop grabber. Because if we wouldn’t get it, we could get Butterfly “sell” pattern and it’s target stands slightly lower than 1550. Other words, this butterfly could become the corner stone of medium term action. Because we treat current move up as retracement, as BC leg of monthly AB-CD action with target somewhere around 1550. Then we expect that market should show another leg down. Thus, if BC leg simultaneously will become a reversal point – that could become double deuce. But now we have significant risk that we will not get it. Of cause, we do not know, may be a bit later market will form a bit wider butterfly, where current swing down will be the initial swing of the pattern, but now, as you can see it looks not cloudless.
Thus, conclusion of daily time frame – keep a close eye on stop grabber first, since it has been formed and it stands in progress. When it will either work or fail, we will start to thing about next step.

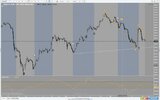
4-hour
There is no much information on lower time frames unfortunately. Here I can just point some levels. First is – market has hit resistance on Thurday at daily overbought. Also we can pay some attention on price action around 76.8% support level, since it very typical for butterflies. Currently I’m not buiding illusions concerning reversal around it, since we have strong grabber and action is rather solid, but anything could happen and even such strong pattern also could theoretically fail, thus it will not become a hard work to take brief look on market action when it will get there.

Conclusion:
We can say that on higher time frames market has not passed the bullish edge yet. Yes retracement is solid but it is reasonable as well, and weekly context is still bullish.
On lower time frames we have a bit contradictive patterns and action and need wait when bearish pattern will work out and then take a look – does our greater bullish pattern is still valid. Depending on result we will try to make decision about market’s direction.
The technical portion of Sive's analysis owes a great deal to Joe DiNapoli's methods, and uses a number of Joe's proprietary indicators. Please note that Sive's analysis is his own view of the market and is not endorsed by Joe DiNapoli or any related companies.
Major event on passed week has happened on Thursday when Fed Reserve announced continuation of QE program. Although gold market falls withing recent year and one of the major reason for that is anemic inflation, but such news was too much even for current gold market and it has splashed prices up. Later, on Friday, Saint Louis Fed president said the U.S. central bank might move next month to reduce stimulus spending that has bolstered bullion for years. That has led to aggressive sell off and profit taking and has erased solid part of previous growth. At the same time, Mr. Bullard said that “if inflation and employment will continue to show stronger data” then Fed could announce QE contraction. Whether this data will show growth we don’t know. That’s why this is not a great hint or some kind of promise, this is mostly suggestion. Besides, as experts tell, Mr. Bullard mostly a centrist in FOMC, and in fact, mostly in will depend on how many hawkish members in FOMC that could push equilibrium on QE contraction. We’ll see. "The gold market had rallied substantially on tapering being taken off the table. Now Bullard's comments have injected some uncertainty near term, and that has prompted a wave of selling in the gold and the precious metals complex," said James Steel, chief precious metals analyst at HSBC to Reuters.
Option-related selling accelerated gold's decline, said Comex gold options floor trader Jonathan Jossen, noting that many participants exercised put options after heavy buying of inexpensive puts following Wednesday's rally. Relatively thin volume during gold's rally this week also suggested that gains could be short lived. In addition, a two-percent drop of open interest in Comex gold futures on Wednesday showed the post-Fed rally was driven by investors who bought back previously bearish bets instead of new money. Gold prices fell faster after declining below a key technical support at $1,345 where the 50-day and 100-day moving averages were converging, analysts said.
Commodity hedge fund Clive Capital told investors it will close down, the latest commodity fund to call it a day. It blamed a lack of investment opportunities for its poor performance and outflows. Sean McGillivray, head of asset allocation at Oregon-based Great Pacific Wealth Management, said to Reuters that there were some "sell-the-rumor" type selling on Clive's news, as worries about panic selling by funds could further pressure gold. A gauge of investor interest, holdings in the world's largest gold exchange-traded fund, the SPDR Gold Trust, rose 0.88 tonnes, or 0.1 percent to 912 tonnes on Thursday. But this growth obviously is just nominal rather than sizable.
CFTC data still shows flat action, at least open interest has not changed much within previous month. At the same time most recent data shows decreasing of net long positions. Since I do not find any clarification on silver CFTC data, I’ve decided to take a look at copper. Surely this is absolutely different commodity, but it is good barometer of economy and within current year open interest is decreasing simultaneously with growing of net long position. So, it could mean and relatively confirm that it is not as good with economy as it seems on surface. And this action stands in agreement with FOMC decisions, right? As net speculative position has turned to short, open interest stops falling.
So, in short term perspective recent fears on market that were before FOMC meeting are started to return back. Now the major question is: will it lead to re-establishing of long term bear trend again?
Monthly
On previous week market has shown solid action on lower time frames, but it couldn’t be seen here, on monthly. Thus, monthly chart almost has not changed from previous week and analysis that we’ve made previously stands the same.
September black candle is not a tragedy and even looks absolutely reasonable. Take a look, we have almost a year of consequtive drop – month by month. Previous 2 candles were the first ones up. Bearish momentum is not disappear it still on the market and presses on it, does not let market freely change sentiment. Thus, such sort of “returns” should not surprise us. All other analysis here is still the same. Current move down probably should become a part of compounded retracement up, until market will not take current lows. Only in this case we could say that bearish trend has continued.
We keep in mind Volatility breakout pattern and know that there will be 3-leg downward action. This means that current bounce will be just retracement probably. Second, currently we know that market at support – Fib support, target of rectangle breakout, completion of double harmonic swing down and monthly deep oversold. Unfortunately monthly chart does not give us much assistance in short-term trading. One bullish pattern that probably could be seen here is bullish DiNapoli “Stretch” pattern, since market stands at deep oversold right at Fib support. Target of this pattern is a middle between Oscillator Predictor Bands – right around 1550$ area. That is also the lower border of long-term consolidation after historical peak. S&P analyst specifies approximately the same target. This area agrees with “Stretch” pattern as well.
Weekly
As we’ve said previously that it is too early to panic that market has started move down again. Current price action is absolutely normal for reversal swing. Trend holds bullish, market stands at 50% support level and MPS1. Most recent candle mostly indicates indecision, since price has closed around open level. Some kind of high wave pattern, and it is reasonable by taking into consideration moments that we’ve discussed in fundamental part of research. Retracement down is also reasonable, since market has hit major 0.382 Fib resistance level. Taking into consideration previous bearish power and momentum, market just can’t show light retracement, since momentum is still here and it should be fade out particularly by deep retracements. But what about low volumes on futures that was mentioned above? This is also absolutely logical. If you ever saw the trading volumes of any reversal patterns, say, H&S, or Double top or bottom, you know that first bounce up shows low volumes and first return back down shows greater volumes, because by previous momentum market treats it as retracement and makes attempt to continue move down. But when it fails to do that and sentiment is starting to change, then volume starts to change places and becomes greater on growth. Here we have the same. This is first bounce up and it has to have weak volumes. If market will form here some reversal pattern, then weak volumes in final swings of this pattern will be a worrying sign. In the beginning it’s normal. That’s being said, I do not see any hazard here for bullish development yet, all action absolutely logical. And in general, we probably will say that market has re-established bearish trend only if it will take out current lows around 1170. Or if we will see some clear signs of inability to move higher.
Daily
You, guys, probably remember this chart that we’ve discussed on Thursday:
And we could say that it’s all OK with it, if we wouldn’t get this pattern on Friday. I’m speaking about bearish stop grabber that makes as overall analysis very difficult as situation here tricky. This pattern suggests deeper move down and taking out previous lows. This makes possible retracement to major 5/8 level around 1277. This is not a problem from perspective of reverse H&S pattern, although it will start look a bit worse than it looks now. Second is – we understand why this bounce has happened. Fundamentally we’ve clarified this and from technical point of view – market has hit overbought around 5/8 Fib resistance and MPP.
On the next chart below I show you why I’m a bit upset with this stop grabber. Because if we wouldn’t get it, we could get Butterfly “sell” pattern and it’s target stands slightly lower than 1550. Other words, this butterfly could become the corner stone of medium term action. Because we treat current move up as retracement, as BC leg of monthly AB-CD action with target somewhere around 1550. Then we expect that market should show another leg down. Thus, if BC leg simultaneously will become a reversal point – that could become double deuce. But now we have significant risk that we will not get it. Of cause, we do not know, may be a bit later market will form a bit wider butterfly, where current swing down will be the initial swing of the pattern, but now, as you can see it looks not cloudless.
Thus, conclusion of daily time frame – keep a close eye on stop grabber first, since it has been formed and it stands in progress. When it will either work or fail, we will start to thing about next step.
4-hour
There is no much information on lower time frames unfortunately. Here I can just point some levels. First is – market has hit resistance on Thurday at daily overbought. Also we can pay some attention on price action around 76.8% support level, since it very typical for butterflies. Currently I’m not buiding illusions concerning reversal around it, since we have strong grabber and action is rather solid, but anything could happen and even such strong pattern also could theoretically fail, thus it will not become a hard work to take brief look on market action when it will get there.
Conclusion:
We can say that on higher time frames market has not passed the bullish edge yet. Yes retracement is solid but it is reasonable as well, and weekly context is still bullish.
On lower time frames we have a bit contradictive patterns and action and need wait when bearish pattern will work out and then take a look – does our greater bullish pattern is still valid. Depending on result we will try to make decision about market’s direction.
The technical portion of Sive's analysis owes a great deal to Joe DiNapoli's methods, and uses a number of Joe's proprietary indicators. Please note that Sive's analysis is his own view of the market and is not endorsed by Joe DiNapoli or any related companies.


")