Sive Morten
Special Consultant to the FPA
- Messages
- 18,699
Fundamentals
Weekly Gold Tading Report prepared by Sive Morten exclusively for ForexPeaceArmy.com
According to Reuters news Gold fell on Friday as a dollar-driven rally encouraged by U.S. economic growth dimmed bullion's investment appeal, sending the metal's prices toward a key support level at $1,200 an ounce.
Bullion posted its fourth consecutive weekly loss, its longest losing streak since April 2013, after the U.S. Federal Reserve indicated it could raise interest rates sooner than expected earlier this month.
"People are going into the dollar today and that's the main driver weighing down on gold," said Michael Matousek, head trader at San Antonio-based U.S. Global Investors with about $1 billion in assets under management.
"Also, less monetary easing means less inflation and less opportunities for an immediate rally in gold," he said.
The metal fell to a nine-month low of $1,206.85 on Thursday, before rebounding due to a sharp selloff in U.S. equities, which prompted investors to seek refuge in perceived safer assets such as bullion.
The Commerce Department raised its estimate of gross domestic product to show the economy expanded at a 4.6 percent annual rate, in line with expectations and the best performance since the fourth quarter of 2011.
Technical selling could further pressure gold after spot's 50-day moving average fell below its 200-day moving average last week, a bearish formation known as a "death cross," for the first time since the end of May.
Bullion investors closely monitored the U.S. Treasuries market after Pimco Chief Investment Officer Bill Gross said he would be joining rival Janus Capital Group, which spurred concerns of investor redemptions at the world's largest bond fund manager.
Open Interest:
 Longs:
 Shorts:
 Source: CFTC, Reuters
CFTC Report shows continuation of tendency that we’ve seen on previous week. Again – open interest increased and net long position decreased simultaneously “Net Long” means difference between longs and shorts. Hence, decreasing of Net long means either closing longs or opening shorts. But as we see simultaneous growth in Open Interest – it means new positions were opened and these positions probably short. This tells that bearish sentiment still strong and has got new support by new short positions on recent week. Hence, we probably should be ready for more achievements to the downside. Taking in consideration this information we probably will be rather skeptic on any technical bullish sign on short-term charts.
Monthly
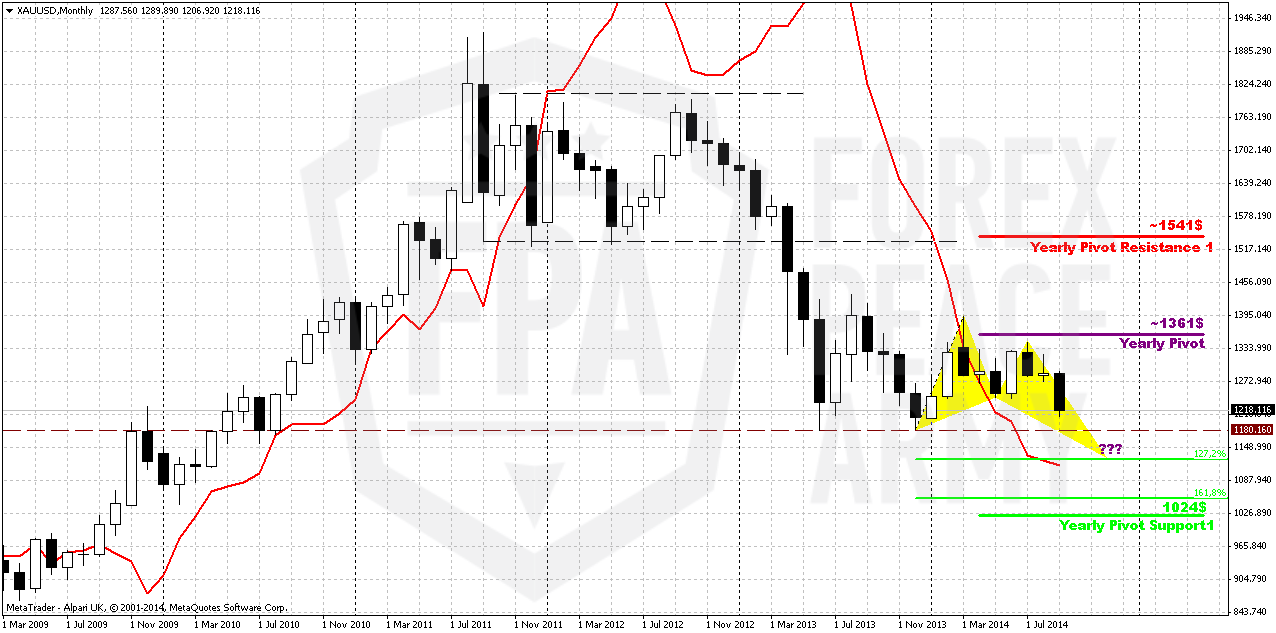
From long-term picture we have two major levels – 1400$ and 1180$. First one is invalidation point of our bearish grabber and market sentiment could shift bullish only in a case of upward breakout of this level. 1180$ in turn, is a target and significant low. Any action below this level could trigger more selling that could take the signs of panic and lead gold to YPS1. Shift in seasonal trend does not fascinate traders much. Physical demand stands weak, dollar strong, inflation weak and talks around rate hiking also does not add optimism to gold. Comments from physical traders on physical demand has appeared to be only comments. First, they told that demand grows below 1330, then 1300, then 1240, now speeches promise demand around 1180, let’s see, but CFTC data shows oposite information.
You probably already understand that primary question on big picture – how deep market could fall. Whether price will break 1180? Here I would like to remind pattern from which our gold analysis has started – Volatility breakout when we said that some 0.618 AB-CD down should happen. And what do we see right now... Pay attention that retracement up to 1400 was small, just 3/8 Fib level. It points on strength of the bears. Thus, following this logic – market should form 1. 618 Butterfly because it’s target coincides with AB-CD target. We will not promise reaching of 1025-1050 area definitely (although this is logical – action to YPS1) but chances that gold will break through 1180 seem significant, especially on a background of recent CFTC data.
Major factors are still valid - good economy data, that right now is confirmed by US companies earning reports, weak physical demand – all these moments prevent gold appreciation. As September bearish intentions look strong - tendency could take shape of butterfly as I’ve drawn on the chart, especially because it agrees with bearish grabber target.
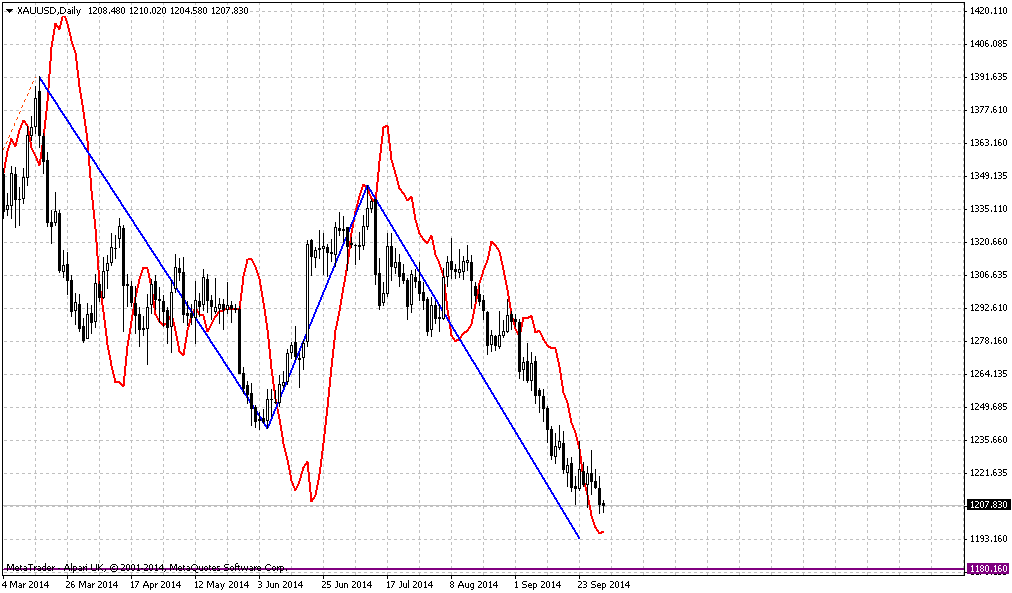
It is interesting that during recent rally market was not able to re-test Yearly Pivot and later has vanished our bullish weekly grabbers. This moments make difficult to count on upward reversal. Also we suspect that we could get bearish dynamic pressure here and probably already getting it. As you can see trend has turned bullish, but gold does not show any upward action. Splash in July has faded fast. Mostly this pattern will depend on action in September-October. Plunge down here and taking 1240 lows confirms it. Finally, overall action since the beginning of the year mostly bearish. Take a look – in the beginning of the year market has tested YPP and failed, then continued move down. During recent attempt to move higher – has not even reached YPP again.
That’s being said, situation on the monthly chart does not suggest yet taking long-term long positions on gold. Fundamental picture is moderately bearish in long-term. Possible sanctions from EU and US could hurt their own economies as well, especially EU. Many analysts already have started to talk about it. It means that economies will start to loose upside momentum and inflation will remain anemic. In such situations investors mostly invest in interest-bear assets, such as bonds. Approximately the same comments we saw for recent 1-2 months from physical gold traders.
On monthly chart we have chain of targets. First one stands at former lows at 1180. Next one is 1125$ - butterfly 1.27 target and then ultimate combination of 1.618 target and YPS1 around 1020-1050 area. 1180 seems most probable not only because it stands closer but also because this is the target of the grabber and bearish dynamic pressure, but some patterns and details do not exclude even reaching of 1025-1050 area.
Weekly
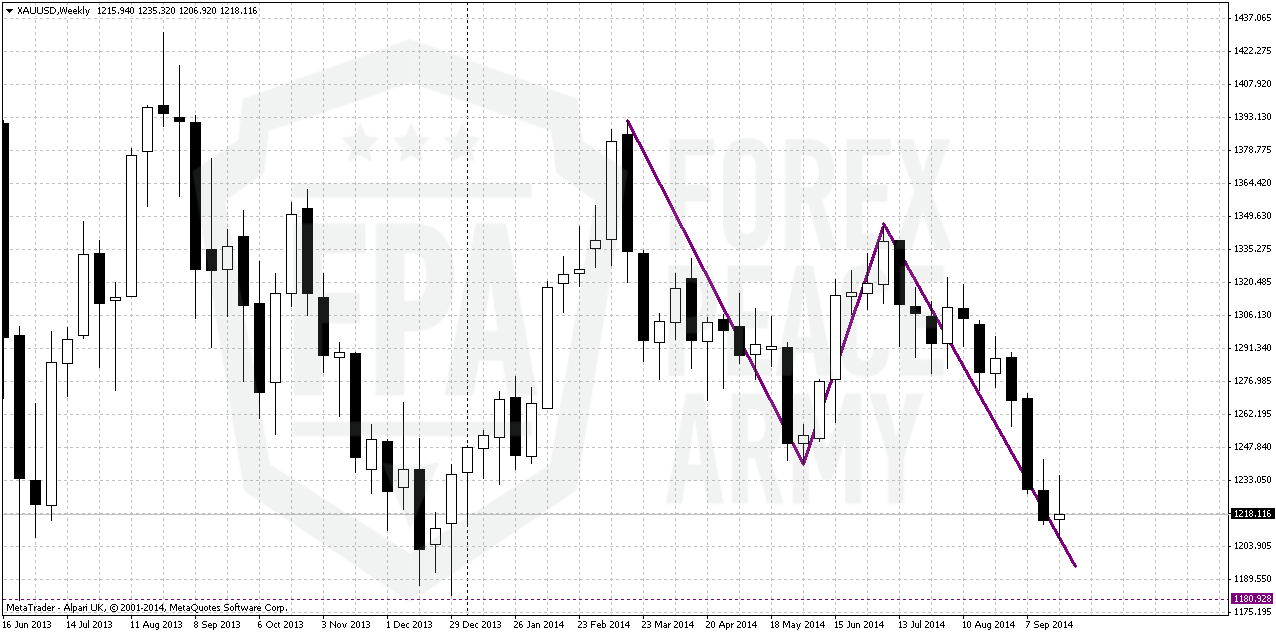
On previous week gold has not shown any significant action lower but at the same time any shy attempt to trigger retracement or rally were vanished fast. And this probably had to happen taking into consideration CFTC data. Still previous week mostly was inside one and looks like high wave pattern. Market is slowing down motion while approaches to 1180 lows. On coming week we will get Consumption and NFP data releases and who knows, may be it will become triggering factor for 1200$ breakout.
Thus, we even do not need any pivots here since market has broken them all. Gold also has stably close below 1240 and this was not a W&R, this was real breakout. Moving below 1240 has destroyed even theoretical chances on upside butterfly that we’ve discussed on previous week.
Gathering all this stuff together we come to conclusion that market has small chances to hold around and we should be ready for action to 1180 lows.
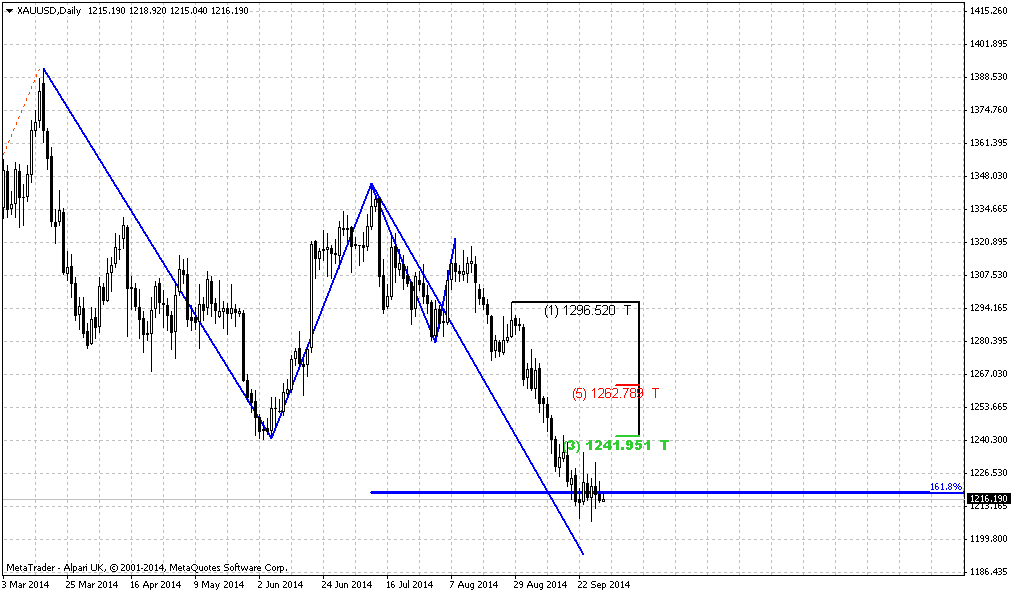
Today we do not have any important Fib levels on weekly chart, we do not need pivots, we know that trend is bearish and market right now is not at oversold. That’s why today picture of gold market is extremely simple:
Yes, we just have AB=CD pattern. And since price already has passed 0.618 target it has no choice but just complete it. AB=CD target stands accurately around 1180 lows, but as we have grabber as well – most probably that gold will wash it out. Besides, this is gold’s habit either. Hence our next destination point here is 1180 lows.
Daily
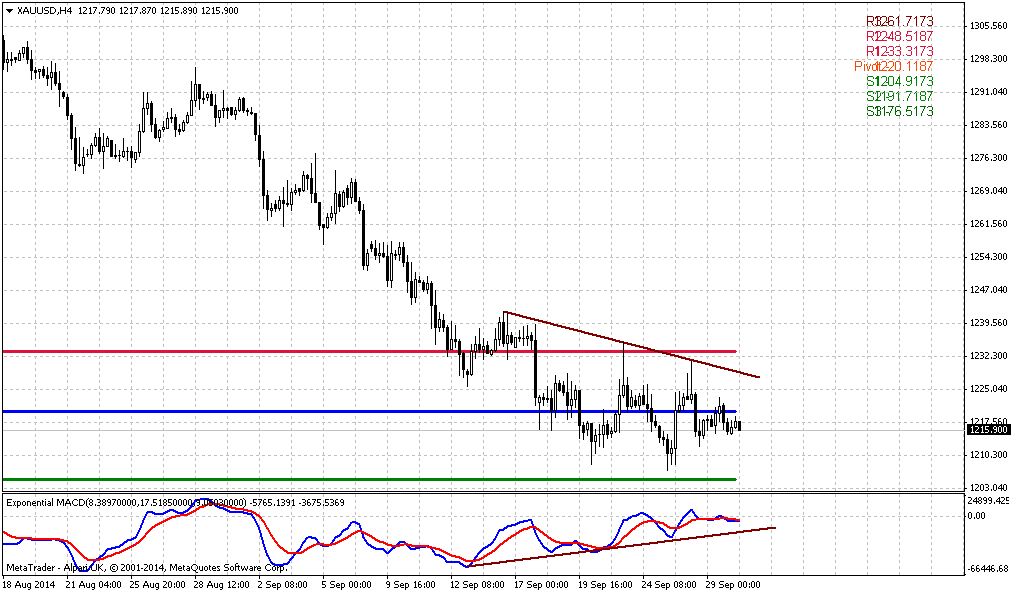
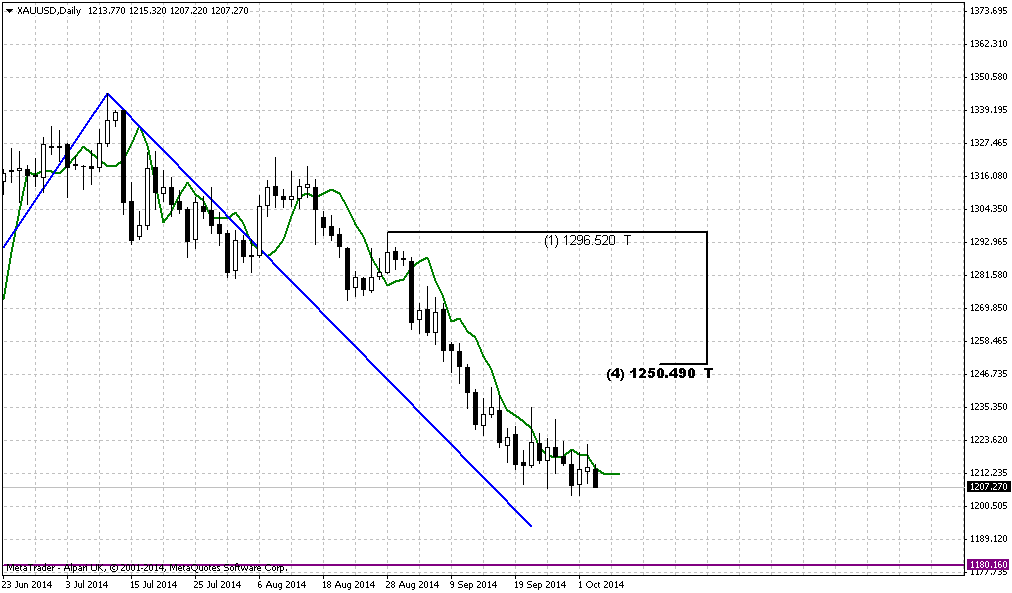
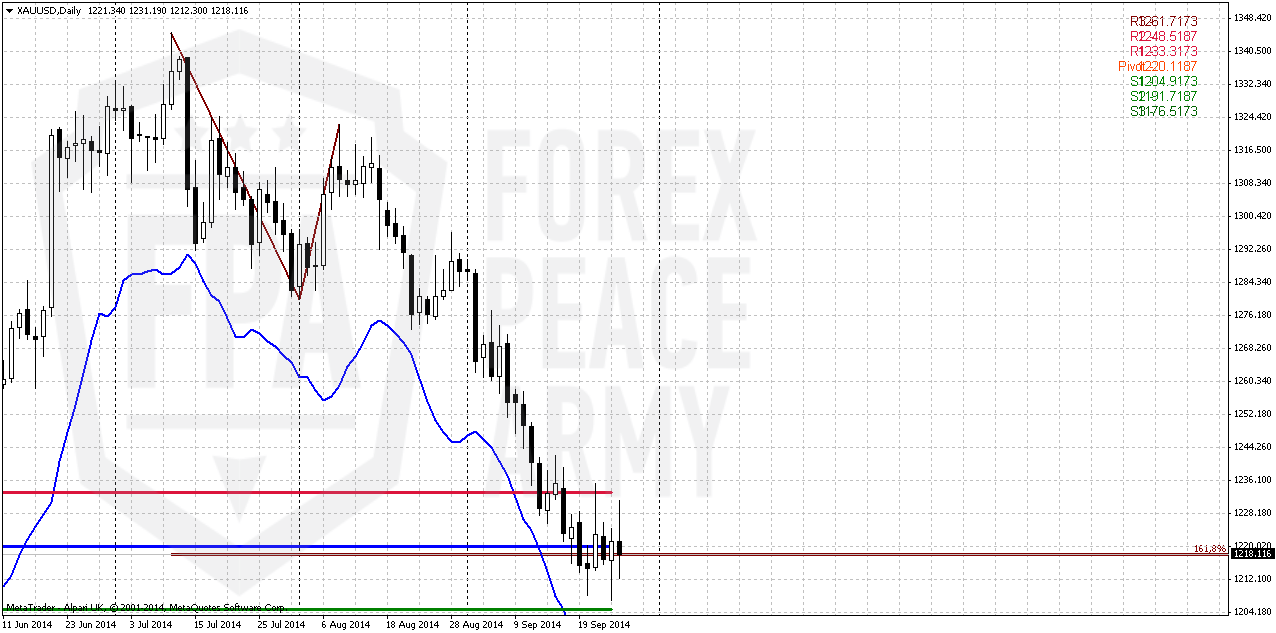
As a result of previous week we have to acknowledge that 1.618 AB=CD target was able to hold gold from immediate downward action and acts as support. Multiple upward and downward spikes were triggered by geopolitical and economical events that still were rather secondary for gold. Thus, spike up is due starting bombing in Syria, while upside splashes – QII US GDP upside revision. But in general market stands in a range. As a result – pivots stand very tight and envelop recent action.
“Standing in the range” could have some special meaning. It happens very often before solid breakout. Market could build energy, traders start to open positions, place stops etc. Range traders start to play “ping-pong” inside with corresponding OCO stops and so on. All this mess lead to appearing of stop orders forest around that could be useful during breakout. When market will form quintessence of some external event, internal position balance and orders – breakout will be possible. External events are coming US data probably, while external is growing amount of shorts and buying stops below level.
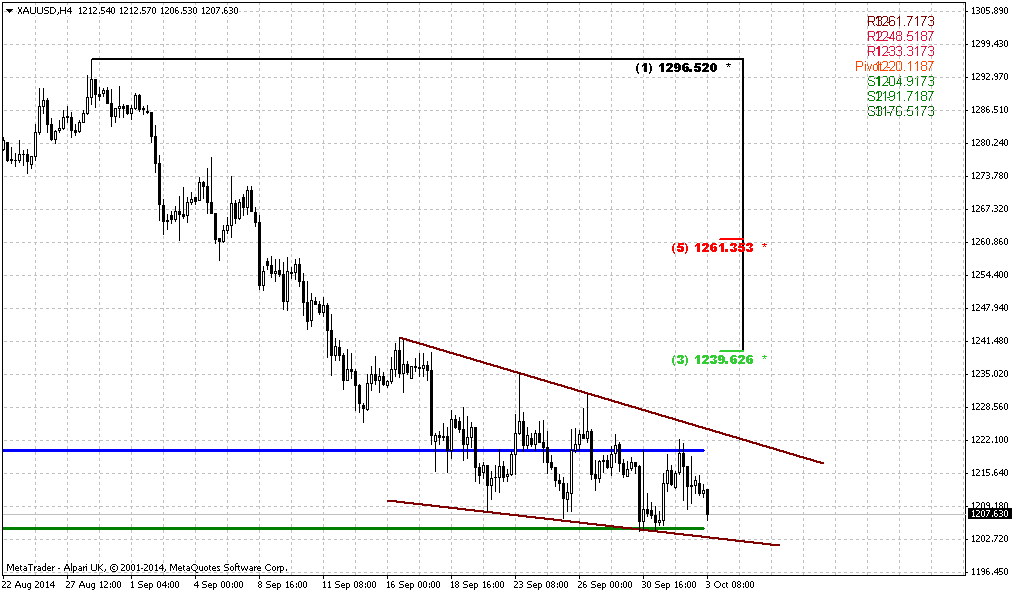
1-hour
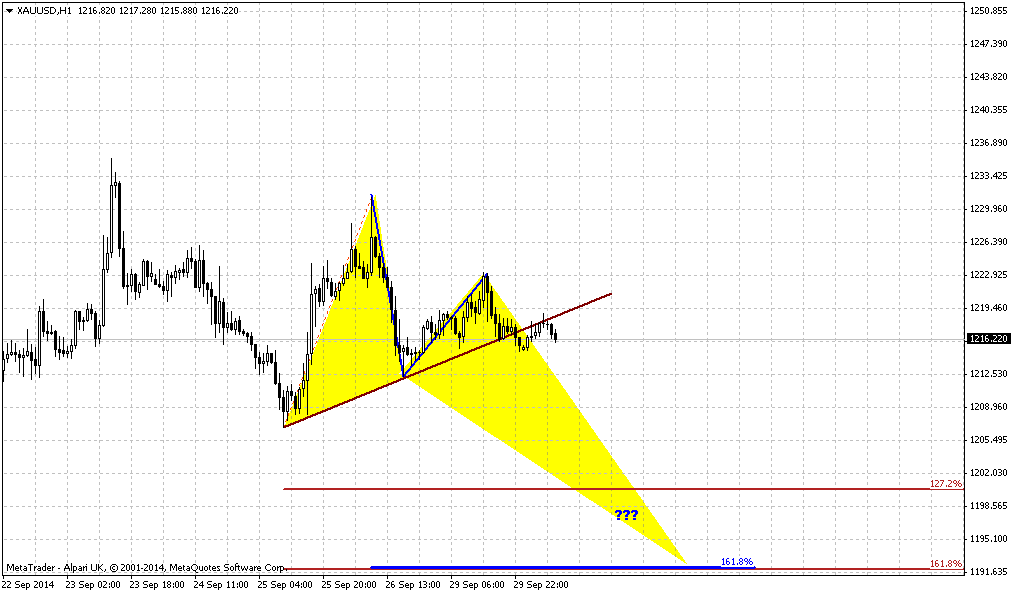
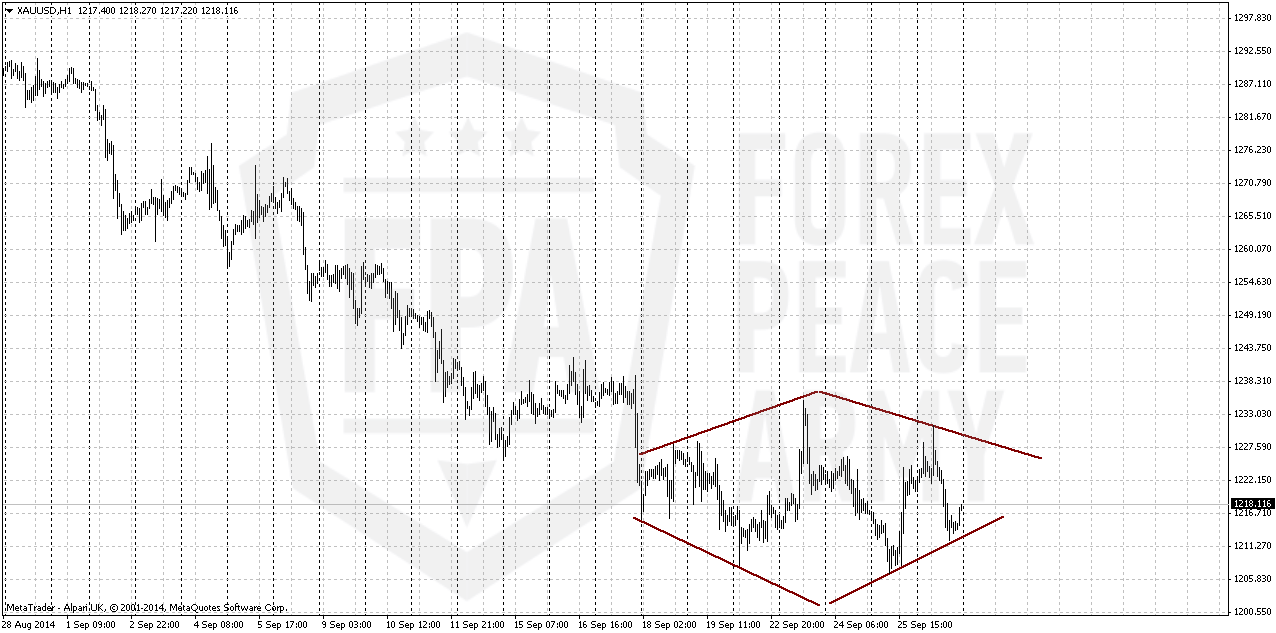
As we’ve said market has turned to consolidation. In the beginning of the week we thought that it will be may be megaphone pattern. But right now it gradually takes shape of a diamond, although not perfect. As you know diamonds are rare and on the market either. And this is reversal pattern. Taking into consideration all bearish stuff that we’ve discussed here – we wouldn’t bet on reversal here and take any long position based on this pattern. Besides this is hourly chart and it is very short term – shy splash up will be enough probably to treat pattern as worked properly. This fakes could appear on volatility during some data releases or someting of that sort. Thus, better to follow something more valuable, such as market mechanics and sentiment. And they suggest bearish conitnuation by far.
Conclusion:
Situation on gold market remains sophisticated. Due bearish moments, such as bullish USD sentiment, lack of physical demand, gold has re-established recently downward action. Recent action shows more and more bearish signs as well as fundamental data and overall market sentiment. On a way down market could pass through multiple target and nearest one is 1180$. We even have setup on big picture that suggests moving to 1025-1050 area.
In short term perspective we should wait for reaching of 1180 area first. There some signs should come – whether gold will go lower or not. Be careful with hourly diamond pattern. We probably would call you do not trade it having such sentiment and overall bearish situation on gold market on the back. But final choice, as usual is up to you.
The technical portion of Sive's analysis owes a great deal to Joe DiNapoli's methods, and uses a number of Joe's proprietary indicators. Please note that Sive's analysis is his own view of the market and is not endorsed by Joe DiNapoli or any related companies.
Weekly Gold Tading Report prepared by Sive Morten exclusively for ForexPeaceArmy.com
According to Reuters news Gold fell on Friday as a dollar-driven rally encouraged by U.S. economic growth dimmed bullion's investment appeal, sending the metal's prices toward a key support level at $1,200 an ounce.
Bullion posted its fourth consecutive weekly loss, its longest losing streak since April 2013, after the U.S. Federal Reserve indicated it could raise interest rates sooner than expected earlier this month.
"People are going into the dollar today and that's the main driver weighing down on gold," said Michael Matousek, head trader at San Antonio-based U.S. Global Investors with about $1 billion in assets under management.
"Also, less monetary easing means less inflation and less opportunities for an immediate rally in gold," he said.
The metal fell to a nine-month low of $1,206.85 on Thursday, before rebounding due to a sharp selloff in U.S. equities, which prompted investors to seek refuge in perceived safer assets such as bullion.
The Commerce Department raised its estimate of gross domestic product to show the economy expanded at a 4.6 percent annual rate, in line with expectations and the best performance since the fourth quarter of 2011.
Technical selling could further pressure gold after spot's 50-day moving average fell below its 200-day moving average last week, a bearish formation known as a "death cross," for the first time since the end of May.
Bullion investors closely monitored the U.S. Treasuries market after Pimco Chief Investment Officer Bill Gross said he would be joining rival Janus Capital Group, which spurred concerns of investor redemptions at the world's largest bond fund manager.
Open Interest:
CFTC Report shows continuation of tendency that we’ve seen on previous week. Again – open interest increased and net long position decreased simultaneously “Net Long” means difference between longs and shorts. Hence, decreasing of Net long means either closing longs or opening shorts. But as we see simultaneous growth in Open Interest – it means new positions were opened and these positions probably short. This tells that bearish sentiment still strong and has got new support by new short positions on recent week. Hence, we probably should be ready for more achievements to the downside. Taking in consideration this information we probably will be rather skeptic on any technical bullish sign on short-term charts.
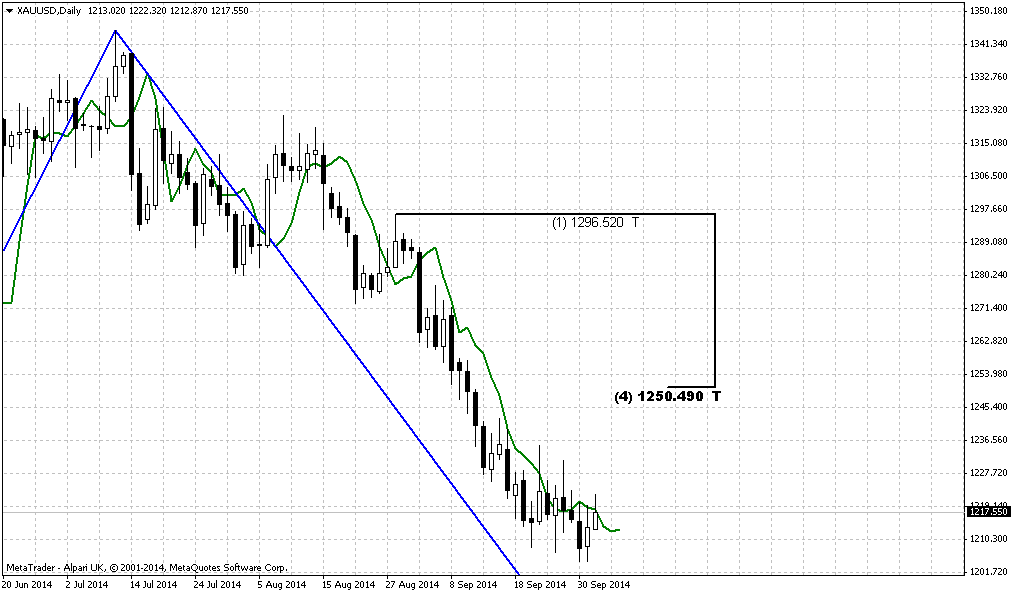
Monthly
From long-term picture we have two major levels – 1400$ and 1180$. First one is invalidation point of our bearish grabber and market sentiment could shift bullish only in a case of upward breakout of this level. 1180$ in turn, is a target and significant low. Any action below this level could trigger more selling that could take the signs of panic and lead gold to YPS1. Shift in seasonal trend does not fascinate traders much. Physical demand stands weak, dollar strong, inflation weak and talks around rate hiking also does not add optimism to gold. Comments from physical traders on physical demand has appeared to be only comments. First, they told that demand grows below 1330, then 1300, then 1240, now speeches promise demand around 1180, let’s see, but CFTC data shows oposite information.
You probably already understand that primary question on big picture – how deep market could fall. Whether price will break 1180? Here I would like to remind pattern from which our gold analysis has started – Volatility breakout when we said that some 0.618 AB-CD down should happen. And what do we see right now... Pay attention that retracement up to 1400 was small, just 3/8 Fib level. It points on strength of the bears. Thus, following this logic – market should form 1. 618 Butterfly because it’s target coincides with AB-CD target. We will not promise reaching of 1025-1050 area definitely (although this is logical – action to YPS1) but chances that gold will break through 1180 seem significant, especially on a background of recent CFTC data.
Major factors are still valid - good economy data, that right now is confirmed by US companies earning reports, weak physical demand – all these moments prevent gold appreciation. As September bearish intentions look strong - tendency could take shape of butterfly as I’ve drawn on the chart, especially because it agrees with bearish grabber target.
It is interesting that during recent rally market was not able to re-test Yearly Pivot and later has vanished our bullish weekly grabbers. This moments make difficult to count on upward reversal. Also we suspect that we could get bearish dynamic pressure here and probably already getting it. As you can see trend has turned bullish, but gold does not show any upward action. Splash in July has faded fast. Mostly this pattern will depend on action in September-October. Plunge down here and taking 1240 lows confirms it. Finally, overall action since the beginning of the year mostly bearish. Take a look – in the beginning of the year market has tested YPP and failed, then continued move down. During recent attempt to move higher – has not even reached YPP again.
That’s being said, situation on the monthly chart does not suggest yet taking long-term long positions on gold. Fundamental picture is moderately bearish in long-term. Possible sanctions from EU and US could hurt their own economies as well, especially EU. Many analysts already have started to talk about it. It means that economies will start to loose upside momentum and inflation will remain anemic. In such situations investors mostly invest in interest-bear assets, such as bonds. Approximately the same comments we saw for recent 1-2 months from physical gold traders.
On monthly chart we have chain of targets. First one stands at former lows at 1180. Next one is 1125$ - butterfly 1.27 target and then ultimate combination of 1.618 target and YPS1 around 1020-1050 area. 1180 seems most probable not only because it stands closer but also because this is the target of the grabber and bearish dynamic pressure, but some patterns and details do not exclude even reaching of 1025-1050 area.
Weekly
On previous week gold has not shown any significant action lower but at the same time any shy attempt to trigger retracement or rally were vanished fast. And this probably had to happen taking into consideration CFTC data. Still previous week mostly was inside one and looks like high wave pattern. Market is slowing down motion while approaches to 1180 lows. On coming week we will get Consumption and NFP data releases and who knows, may be it will become triggering factor for 1200$ breakout.
Thus, we even do not need any pivots here since market has broken them all. Gold also has stably close below 1240 and this was not a W&R, this was real breakout. Moving below 1240 has destroyed even theoretical chances on upside butterfly that we’ve discussed on previous week.
Gathering all this stuff together we come to conclusion that market has small chances to hold around and we should be ready for action to 1180 lows.
Today we do not have any important Fib levels on weekly chart, we do not need pivots, we know that trend is bearish and market right now is not at oversold. That’s why today picture of gold market is extremely simple:
Yes, we just have AB=CD pattern. And since price already has passed 0.618 target it has no choice but just complete it. AB=CD target stands accurately around 1180 lows, but as we have grabber as well – most probably that gold will wash it out. Besides, this is gold’s habit either. Hence our next destination point here is 1180 lows.
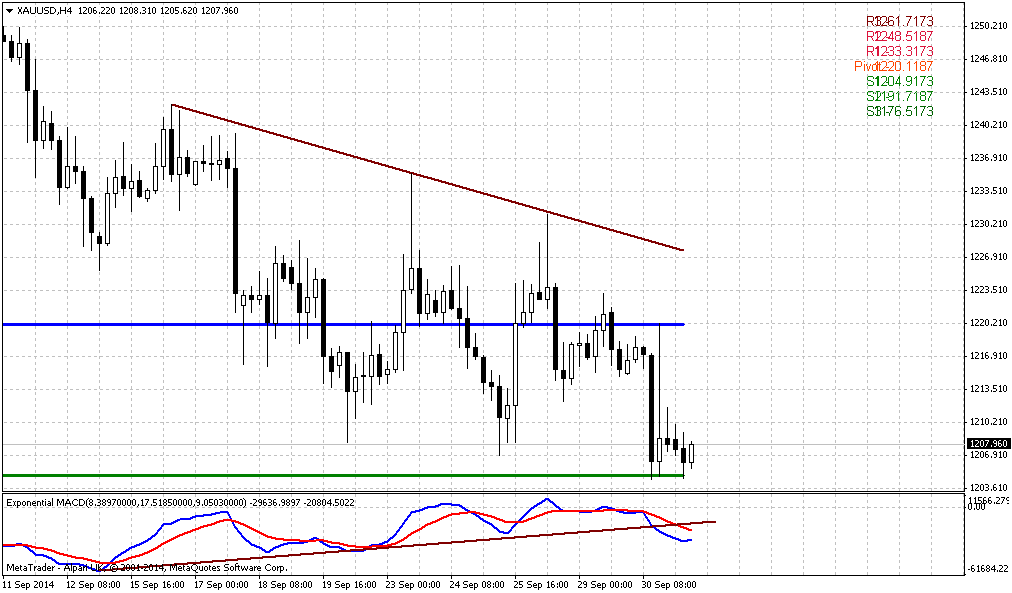
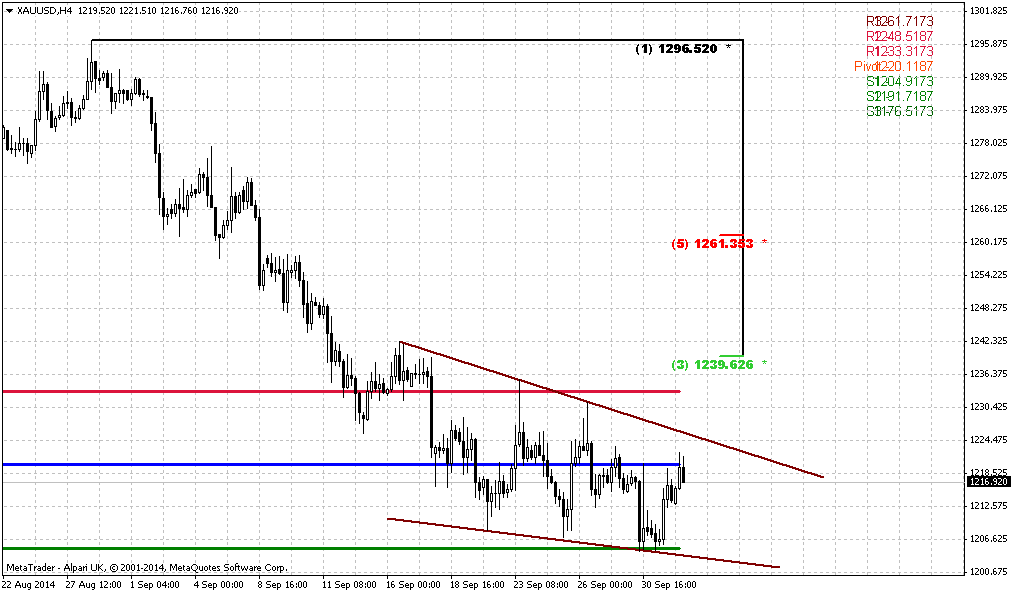
Daily
As a result of previous week we have to acknowledge that 1.618 AB=CD target was able to hold gold from immediate downward action and acts as support. Multiple upward and downward spikes were triggered by geopolitical and economical events that still were rather secondary for gold. Thus, spike up is due starting bombing in Syria, while upside splashes – QII US GDP upside revision. But in general market stands in a range. As a result – pivots stand very tight and envelop recent action.
“Standing in the range” could have some special meaning. It happens very often before solid breakout. Market could build energy, traders start to open positions, place stops etc. Range traders start to play “ping-pong” inside with corresponding OCO stops and so on. All this mess lead to appearing of stop orders forest around that could be useful during breakout. When market will form quintessence of some external event, internal position balance and orders – breakout will be possible. External events are coming US data probably, while external is growing amount of shorts and buying stops below level.
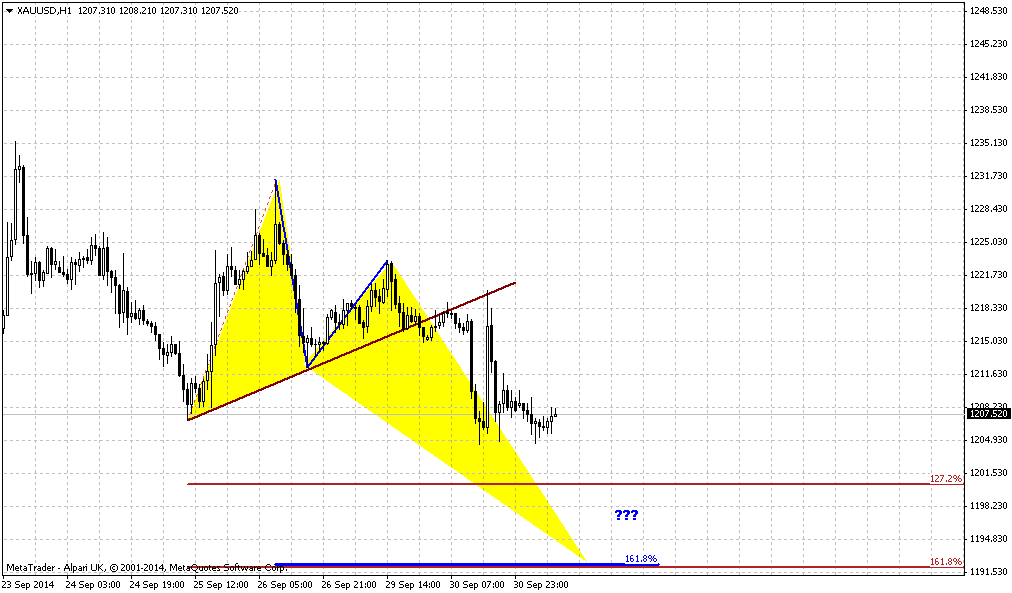
1-hour
As we’ve said market has turned to consolidation. In the beginning of the week we thought that it will be may be megaphone pattern. But right now it gradually takes shape of a diamond, although not perfect. As you know diamonds are rare and on the market either. And this is reversal pattern. Taking into consideration all bearish stuff that we’ve discussed here – we wouldn’t bet on reversal here and take any long position based on this pattern. Besides this is hourly chart and it is very short term – shy splash up will be enough probably to treat pattern as worked properly. This fakes could appear on volatility during some data releases or someting of that sort. Thus, better to follow something more valuable, such as market mechanics and sentiment. And they suggest bearish conitnuation by far.
Conclusion:
Situation on gold market remains sophisticated. Due bearish moments, such as bullish USD sentiment, lack of physical demand, gold has re-established recently downward action. Recent action shows more and more bearish signs as well as fundamental data and overall market sentiment. On a way down market could pass through multiple target and nearest one is 1180$. We even have setup on big picture that suggests moving to 1025-1050 area.
In short term perspective we should wait for reaching of 1180 area first. There some signs should come – whether gold will go lower or not. Be careful with hourly diamond pattern. We probably would call you do not trade it having such sentiment and overall bearish situation on gold market on the back. But final choice, as usual is up to you.
The technical portion of Sive's analysis owes a great deal to Joe DiNapoli's methods, and uses a number of Joe's proprietary indicators. Please note that Sive's analysis is his own view of the market and is not endorsed by Joe DiNapoli or any related companies.