globalcurrencymarkets.com
Recruit
- Messages
- 0
Analysis by Roberto Jbili
Park Capital Management
Italy, Milano 15-09-09
info@optionstotrade.com
Tel: 0039 3272386209
THE MARKETS
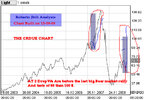
THE Crud oil trading is dominating the Global markets, with dow reaching 10.000 levels, it will be an perfect timing to some traders to exit before the other when dow will reach 10.000, the markets will need time and little beat correction before having year end trading above 10.000.
The exit of some traders will cause oil drop to 64 and Euro drop to 1.42 before an rally to 1.52 with oil to 88 $.
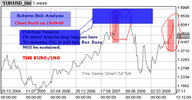
OIL & EURO & Politics
Russia Again will not accept the period in which the Oil will start the drop and the bear market rally of oil in its first time of 2 will finish.
The blue marked patterns on the Euro/USD Chart and the direct drop of Oil, may mean that Euro will not drop with Oil, Euro will be up with Gold on politicl tension and OIl will go down to ignore terrorism and political tension influence inside the Street House.
Oil will go down on Demand since bear market rally will end among with negative Economic data which will confirm the return of Credit problems, industrial slow and other market problems.
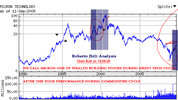
SPECIAL CHART /MICRCON/
The Markets & Economy.
Microcn as will be noted will remain one of stock chart in from which we can predict the USD direction as tech Currecncy.... since this chart explain us the timing and duration of next technology cycle and when the tech cycle will start and how much the bear market of commodities will last.
As the USD is an currency of Export countries, and the Euro will remain an commodity country, and this is the war about pricing commodities in Euro.
The USA export everything and at large the Technology, Cisco represent the GDP of USA and play an big role in Globalk politics, when we look to charts like Micron we can predict the Euro Direction from this charts, since the USA is the technology currency.
The Below Chart of Micron explain the commodity cycle and the Tech cycle.
The 3 towers represent the close of technology cycle, and after the drop of 2 pattern noted, we will start the big pattern which will be the technology cycle as a whole, This chart will remain the best of 2009.
EURO/USD Connection
I can call the 3 towers chart as similar of the Euro/USD in fisrt tower it show the drop when soros entered the market with euro high to 1.33 then drop when he sold the Euro, then high to 1.37 in the 2 tower, is the same pattern in the mentioned chart.
the 3 tower represent the high record of Euro to 1.60. we remain in the 3 tower to confirm the drop to 1.25 levels..
This chart confirm Oil direction and USA economy direction, MSFT Chart as largest tech empire will indicate the same.
The Chart or the traders which bought the Micron stocks will indicate USD direction (investors) but also importers and export markets.
the chart was not clear on the upside for the drop in the 3 tower doing to 11 Septmber attacks price into value of Futute export, MU was not going up to make Fibo Rally for the drop from 100 to below 20. (see pattern of 1995 END).
MU was in need to go more higher like the pattern in 1995.
The market rally or the pattern of tech cycle will start after thye 2 pattern of drop, this mean that the pattern of drop will take same time of the pattern of rise of Micron, with this chart we built market timing for the next 12 years.
THE TRADING
AS WELL EXPLAINED IN ABOVE CHARTS, WE ADVISE THE FOLLOWING TRADES:
OIL
From 64 levels to 88 then 75 then 100 $ to finish the first bear market rally.
EUR/USD
As predicited before the target will be with oil to 1.52 when oil will reach 88$.
The Euro will go up from 1.42 levels in the short term.
MICRON
Short term it will be building to above 10, for Medum term we like to short Micron from the level above 10 to below 5.
Call options on Micron Chart from below 5 $ to above 100 $ when Nasdaq will join Dow and SAP for new record high.
Analysis By Roberto Jbili Globalcurrencymarkets.com
Forex Signals*
Park Capital Management
Italy, Milano 15-09-09
info@optionstotrade.com
Tel: 0039 3272386209
THE MARKETS
THE Crud oil trading is dominating the Global markets, with dow reaching 10.000 levels, it will be an perfect timing to some traders to exit before the other when dow will reach 10.000, the markets will need time and little beat correction before having year end trading above 10.000.
The exit of some traders will cause oil drop to 64 and Euro drop to 1.42 before an rally to 1.52 with oil to 88 $.
OIL & EURO & Politics
Russia Again will not accept the period in which the Oil will start the drop and the bear market rally of oil in its first time of 2 will finish.
The blue marked patterns on the Euro/USD Chart and the direct drop of Oil, may mean that Euro will not drop with Oil, Euro will be up with Gold on politicl tension and OIl will go down to ignore terrorism and political tension influence inside the Street House.
Oil will go down on Demand since bear market rally will end among with negative Economic data which will confirm the return of Credit problems, industrial slow and other market problems.
SPECIAL CHART /MICRCON/
The Markets & Economy.
Microcn as will be noted will remain one of stock chart in from which we can predict the USD direction as tech Currecncy.... since this chart explain us the timing and duration of next technology cycle and when the tech cycle will start and how much the bear market of commodities will last.
As the USD is an currency of Export countries, and the Euro will remain an commodity country, and this is the war about pricing commodities in Euro.
The USA export everything and at large the Technology, Cisco represent the GDP of USA and play an big role in Globalk politics, when we look to charts like Micron we can predict the Euro Direction from this charts, since the USA is the technology currency.
The Below Chart of Micron explain the commodity cycle and the Tech cycle.
The 3 towers represent the close of technology cycle, and after the drop of 2 pattern noted, we will start the big pattern which will be the technology cycle as a whole, This chart will remain the best of 2009.
EURO/USD Connection
I can call the 3 towers chart as similar of the Euro/USD in fisrt tower it show the drop when soros entered the market with euro high to 1.33 then drop when he sold the Euro, then high to 1.37 in the 2 tower, is the same pattern in the mentioned chart.
the 3 tower represent the high record of Euro to 1.60. we remain in the 3 tower to confirm the drop to 1.25 levels..
This chart confirm Oil direction and USA economy direction, MSFT Chart as largest tech empire will indicate the same.
The Chart or the traders which bought the Micron stocks will indicate USD direction (investors) but also importers and export markets.
the chart was not clear on the upside for the drop in the 3 tower doing to 11 Septmber attacks price into value of Futute export, MU was not going up to make Fibo Rally for the drop from 100 to below 20. (see pattern of 1995 END).
MU was in need to go more higher like the pattern in 1995.
The market rally or the pattern of tech cycle will start after thye 2 pattern of drop, this mean that the pattern of drop will take same time of the pattern of rise of Micron, with this chart we built market timing for the next 12 years.
THE TRADING
AS WELL EXPLAINED IN ABOVE CHARTS, WE ADVISE THE FOLLOWING TRADES:
OIL
From 64 levels to 88 then 75 then 100 $ to finish the first bear market rally.
EUR/USD
As predicited before the target will be with oil to 1.52 when oil will reach 88$.
The Euro will go up from 1.42 levels in the short term.
MICRON
Short term it will be building to above 10, for Medum term we like to short Micron from the level above 10 to below 5.
Call options on Micron Chart from below 5 $ to above 100 $ when Nasdaq will join Dow and SAP for new record high.
Analysis By Roberto Jbili Globalcurrencymarkets.com
Forex Signals*