How to identify support and resistance level in forex?
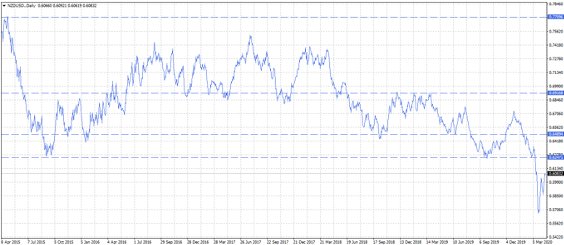
The main rule to identify support and resistance lines is to ensure that they are meaningful by ensuring they touch at least two or three points. Otherwise, your lines will misguide you and lead to trading mistakes. To ensure that a line is meaningful, it would be wise to start with higher timeframes such as the daily chart, although you can use other timeframes such as the 4H or 1H timeframes. After opening the chart and using the line chart and zooming out, you will be able to see levels where the price has bounced more than once. Here, using the horizontal lines would help. You can place those lines at price levels that the price has reacted to at least three times in the past to ensure that the lines are valid.
Keep in mind that support and resistance are technical levels to which the price has shown a reaction in the past. In other words, the price has reversed direction upon reaching those levels. Whether a specific line is a support or a resistance line depends on where the price is in relation to that line. If the price is above the line, then it is a support line. If the price is below the line, then it is a resistance line.
After you place the horizontal lines, you can return to the candlestick chart and lower time frames. The lines then would then guide you. They would offer good areas that you can use to either enter a trade or place a stop loss or a take profit level. Also, those lines can be used with other technical analysis tools to ensure you have a confluence of signals and more accuracy.