Part I. Support and Resistance

Commander in Pips: As I’ve promised, today we will continue to deal with technical analysis and talk about support and resistance in the market.
In general support and resistance are amongst the major tools that are used in the market by the absolute majority of traders. That’s why it’s very strange, that these tools do not have a definite description – there are almost as many explanations of support and resistance and how to build them as there are traders.

On a theoretical chart the idea of support and resistance looks very clear – on an upward move as on downward:
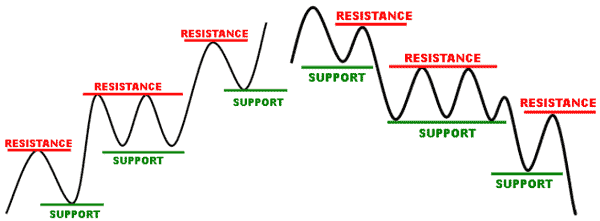
Pipruit: Looks like resistance, despite the direction of the market always stands above it – something that does not allow market to go upward. Support conversely – holds the market from free falling, i.e. stands below the market.
Commander in Pips: Yes. When the market reaches some level above it, that does not allow it to move higher, and turns it to the downside – this particular level becomes a resistance. After a move lower, the market reaches some level below it that turns it from this level to upside move again. So, this level becomes a support. In fact, the market creates resistance and support levels over time during up and down moves.
Drawing Support and Resistance on the chart
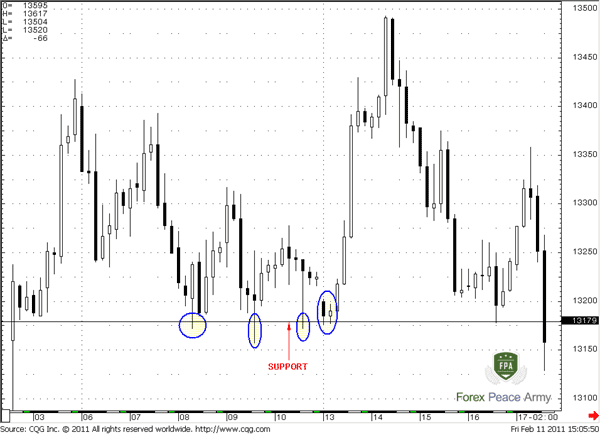
First of all remember that support and resistance are not precise numbers, they are more areas. And the larger your time frame, the wider this area. For instance, on a monthly chart the area of support/resistance could be 100+pips, while on 5-minite chart hardly more than 10 pips. It means that even if you will see that price has temporally penetrated a support or resistance level, this does not always mean that this level is broken. It all depends on the depth and way of penetration, and here we can offer a simple and widely-applied rule: If the market has not closed below/above support/resistance then it is just testing it and this level is still valid. You can easily see it with bar chart or candlestick (charts #1 and #2). See, although the market has penetrated this level number of times it has not closed below it - close price in of all bars/candles stays above the support level (I hope you remember how to determine the close price of bars and candles). By the way, later market retests this level once again – see the touch just above our logo.
#1 EUR/USD 4-hour chart – support tested, but not terminated
#2 … so the same at bar chart
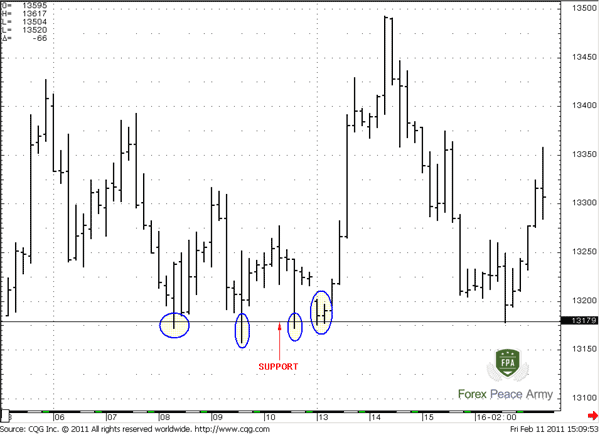

#2 … so the same at bar chart

Pipruit: So, why have you previously said that support and resistance levels are tricky? I mean although they are quite simple, all traders interpret them and use differently – you even give me the rule how to determine – has particular level been broken already or not…
#3 Is this level broken or not?
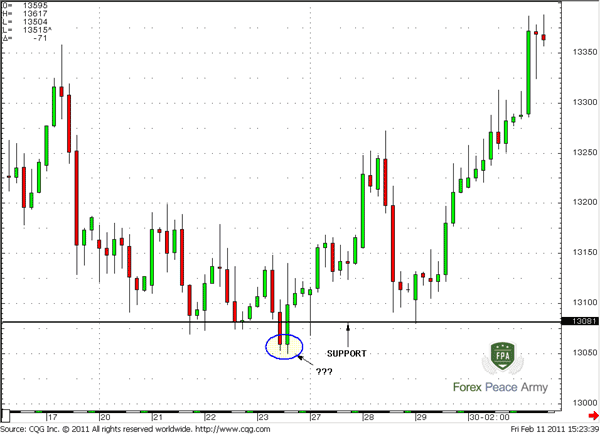

Pipruit: Wow, according to your rule – it was, but I sense that somehow it not… Yes, the market has shown a close below it, but then returned back very fast and accelerated in the opposite direction. What a move!
Commander in Pips: …and?
Pipruit: I don’t know. You’re right – it’s more sophisticated then seems before. What should we do then, how we can estimate the real breakout?
Commander in Pips: Well, maybe my answer seems frustrating to you, but – there is no definite and 100% way to do that. But, still, we have some additional rules that could help with this and increase the probability of estimation of real breakout. But before it you should understand the market mechanics of trading or support/resistance levels. This will help you much, believe me.
Pipruit: Cool!
ADVANCED COMMENTS ON SUPPORT AND RESISTANCE LEVELS
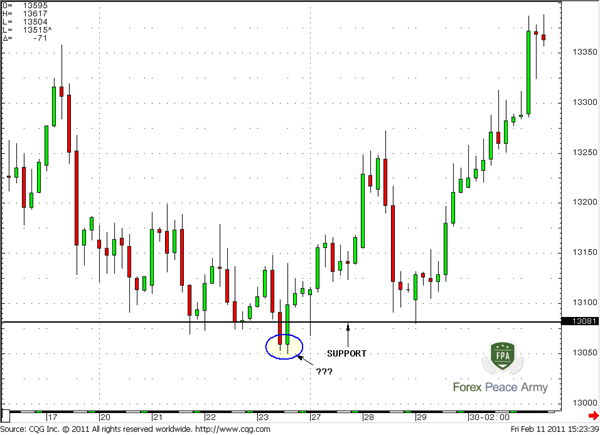
Commander in Pips: For this conversation, we will build around chart #3, but previously you should remember, what we’ve talked about stop-loss orders (if you’ve forgotten it – refresh your memory with the corresponding chapter).
ADVANCED COMMENTS ON SUPPORT AND RESISTANCE LEVELS
Commander in Pips: For this conversation, we will build around chart #3, but previously you should remember, what we’ve talked about stop-loss orders (if you’ve forgotten it – refresh your memory with the corresponding chapter).
Pipruit: Ok, I remember that – stop loss orders are usually used for limiting of potential losses if the market starts to move in direction against your position.
Commander in Pips: That’s right. Now, what we’ve talked about support area, just in the beginning of current chapter?
Pipruit: Well, support area holds market from further move down, at least temporally.
Commander in Pips: Excellent. Let’s suppose that you intend to enter Long (buy EUR/USD), and you have two possible areas where you can do that – from some support area or just in market’s free flow move, so where will you act?
Pipruit: Obviously from support – it’s safer because, as we’ve clarified already, the support area holds the market up, “supporting” it from a further move down, so the probability is much higher that the market will starts to move in my favor from support, than just from “nowhere”.
Commander in Pips: You’re absolutely right, so as other many-many traders. And, say, if you see support and open Long position – where do you place your stop order and why?
Pipruit: Below the support level because it hardly will be triggered – market will have to struggle below the support area to reach it, and why are you asking about obvious things?
Commander in Pips: Yes, so are other many-many traders… and now listen carefully:
Big players (we call them elephants or whales) see this support level also and they also want to buy here. But also they see stop orders just below the level of support, and how big value they are.
Pipruit: So what?
Commander in Pips: If the value of these stop orders is significant – they may use it in their own favor. Here is how they do that – say the market is flirting with a support area and has already shown some shallow penetrations of it but no single close below. This support level is well recognizable (say, obvious), so more and more traders see it and enter long with stop-loss orders just below this level. Suddenly “whales” are starting to sell (open shorts) positions and they sell until public’s stops will be triggered. What will happen if your stop loss on your Long position will be triggered?
Pipruit: Well, if I initially bought, hence, stop order should be “Sell EUR/USD” and will close my position.
Commander in Pips: That’s right, when price will reach your stop-loss order – you will sell EUR/USD. So, “Whales” will have a possibility to buy your position from you (your stop order) as well as other public stop loss orders. As “Whales” initially sold (have opened short position) they need to fix profits – in other words close these positions – they need to buy. So they do this with the poor public. When this transaction is over – and there is no one who wants to sell any more – then the market turns to the upside. That is what you definitely see on chart #3 during the short-term breakout below the support area.
Pipruit: But that is terrible! How they could do that and why?
Commander in Pips: Huh, my boy – don’t be naive. They want your money, everybody wants your money. This is why FOREX is a battlefield – if you do not make profit, then profit is made by someone else…
Commander in Pips:Again, FOREX is a battlefield – if you do not make profit, then profit is made by someone else…
“Why?” - The answer is obvious. First, “Whales” get profit from this short-term trade – they Sell just above the support and Buy (i.e. close their positions) just below it at lower price. Here is a profit from the “Short” trade. Second, they also can not just close their short positions, but can also create their own “long” positions by buying out your stops. And their new inventory of long positions will be made at an excellent price – just below the support area due to your stops. In fact they buy at lows. They can satisfy their greed. See – many advantages…
Pipruit: Trading is a really cruel business. But with such information I will prepare more…
Commander in Pips: That’s right son, here we are for that purpose.
So, traders call this price behavior differently – some call it “Stop licking”, Joe DiNapoli calls it “Wash and Rinse.” Anyway, the name does not change the core idea.
And now, let’s make some rules that will help you to act more successfully around support and resistance levels:
First rule remains intact – If the market holds above/below the support/resistance level and has not closed below/above it but only just insignificantly pierced it (with candle shadows), the more probable that it still valid. So, Close price is your first assistant.
Second rule - the longer time support/resistance is forming the more obvious it becomes – then the more probable is the appearance of a stop licking pattern.
Third rule - to not been trapped with stop licking (a.k.a. Wash and Rinse) you may act twofold – place your stop-loss order a bit deeper or wait until after you see a stop licking pattern as a confirmation of support/resistance strength and further upward/downward market move. After you will see, that Stop licking pattern completed – you may enter in the corresponding direction.
Fourth rule – Stop Licking is a fast pattern, so if market has broken support/resistance level (i.e. closed below/above it) and holds there for 3 periods (i.e. 3 bars/candles) or more, then probably this level has been erased by market action and not valid any more.
I hope these small and easy rules will help you to become more successful with trading around support and resistance levels.
Pipruit: There is another item I am a bit confused about, Commander. The point is that most candles have quite different shadows near support/resistance levels, and it makes it more difficult to draw the line. Does some way exist to negate this problem?
Commander in Pips: Your question is reasonable. To avoid incorrect drawing of support/resistance levels, you may use simple Line chart, that we’ve discuss. It shows close prices only, in difference to Open/High/Low/Close prices of bar and candle charts. Sometimes shadows of candles add noise to interpretation, sometimes long shadows could be just a mistake of some participant so, that we call a reflex move. The line chart instead, shows intentional movement of the market, since it links close prices, and releases you from market noise. Let’s compare them and you will understand better:
#4 GBP/USD Daily Line chart with support and resistance levels
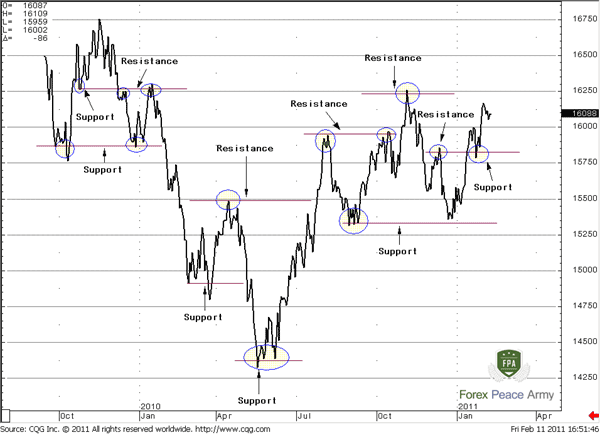
#5 … the same chart but in bar mode
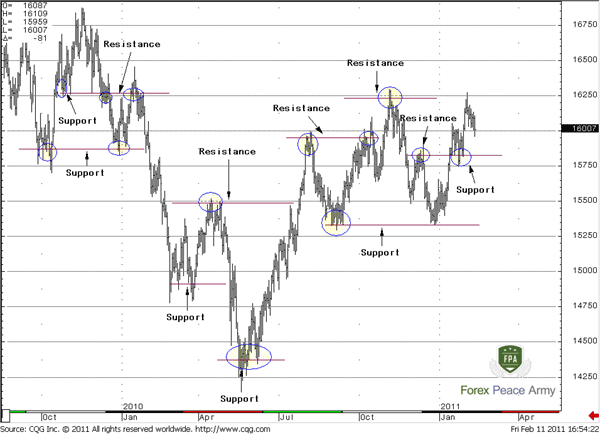
See – a bar chart, just as a candle chart, has many “tails” that penetrate support and resistance levels, so they become a bit blurring. The Line chart, in turn, looks much clearer from this point of view. But, after some time you will get more skills with support/resistance and will not need to shift to a Line chart any more.
#5 … the same chart but in bar mode

Pipruit: Hey, this does really help in the beginning, but still, they are not sharp price level as you’ve said.
I will have to remember that support and resistance are areas and not the fix levels.
Also, Commander, I notice, that the same line was support and then become a resistance and vice versa – is it normal? Just take a look at the first line on previous chart – see, it was support once, but after downward breakout has become a resistance, and the latest line on the chart also…
1. When price breaks, say support level, later it could retest it and this area can act as resistance. The same is true for resistance level – after breakout, it could act as support if the market will return and retest this area.
2. The more often price tests the level – the weaker it becomes, because market bounce from the level due to participants who open positions against the previous market move. Sooner or later, if market returns to this level again and again – all who wants to enter against the market – have done this, so there will not be any participants who want to open against the market. With each touching of the level fewer and fewer people are ready for entering on a counter side and eventually there will be no one who intends to do this.
3. The longer some level holds, the stronger could be the move after true breakout of this level.
4. The longer your time frame – the wider support/resistance area.
So, that’s all for today and don’t forget our previous 4 rules. I think that you can start to practice with support and resistance lines already in a demo account. What are you waiting for
Pipruit: Yeah, I’m itching to get started…Thanks.
Comments
J
john Garbett
12 years ago,
Registered user
Hi
Which is the best chart timeframe to determine true levels of support and resistance? If I use a longer timeframe - daily or weekly charts - I can easily determine the areas, and there are fewer of them. When I look at 1 hour charts or 15 minute charts, then I can see even more areas of support and resistance.
I can only place 20-25 pip stop losses, ( I do not have the money built up yet in the account to place 100 pip stops) and typically trade from 1 hour and 15 minute charts. So often I am looking at upto 5 areas of support and 5 areas of resistance on the chart - within truer levels of support and resistance idenitified from a weekly chart.
If you have the time to think about this I would be very grateful. Thanks.
Sive Morten
12 years ago,
Registered user
> Hi
Which is the best chart timeframe to determine true levels of support and resistance? If I use a longer timeframe - daily or weekly charts - I can easily determine the areas, and there are fewer o..
Hi John,
In fact there is no such term as "best time frame" for sup/res estimation. But our rule, that the higher time frame is, the stronger the levels - push us to general understanding how It works:
1. First, you shoud identify sup/res on big charts - monthly and weekly.
2.Then do it on daily
3. And then, on your trading time frame.
Why we have to do that? Because, for instance, montly sup/res stay around 80 pips from current level. Although you do not trade monthly, but when market will reach it - you will not understand where this sup/res come from, while you do not pay attention to higher time frames.
So, in the beginning of trading session, you have to check where big sup/res stand and will you meet them today or not. If not - shift to your time frame levels. If yes - be prepared...
You do right, that use as support and resistance higher time frames.
M
mjunkyard
12 years ago,
Registered user
sup/resistance
Hi Dear Sive;
I really appreciate all your education and assistance!
(I don't miss a video of yours for months already!)
First a small clarification. At the end of this chapter #3 and #4 seems contradictory. Since #3 says that the longer in holds the better and #4 says the more it's tested the weaker. So I figured that the longer the support holds, you mean without being tested. Is that so? Doesn't it contradict to the double bottom idea?
Now I have a question;
In chart #3 (which by the way i remember from your trade entry video) I see certain things that I would like to understand why you as a proffesional trader see it differently.
1) In terms of entry setups; how did you know not to enter at the inside bar and the doji before? how did you know to wait for the w&r? In lots of cases with the strong supports that you teach us the w&r doesn't occur and other reversal setups do appear.
2) The support area was tested numerous times. What gave you the confidence that we're shooting upwards from here? Doesn't it condradict with #4 at the end of this chapter?
Sorry for the long questions but you are the first one that explains forex to me in a way that it actually makes sense!
thanks a million
mjunkyard
Sive Morten
12 years ago,
Registered user
> Hi Dear Sive;
I really appreciate all your education and assistance!
(I don't miss a video of yours for months already!)
First a small clarification. At the end of this chapter #3 and #4 seems contra..
Hi Mjunkyard,
Looks like you've told about 2 and 3... There is no contradiction here:
1. Second rule tells that level becomes weaker with each touch.
2. Third rule tells that not the level will be stronger, but move after breakout, if level holds for a long time.
So, while in first case we speak about the move after breakout, but in the second about strength of the level itself.
Doesn't it contradict to the double bottom idea?
Please clarify how you see this contradiction, looks like I do not quite understand.
1) In terms of entry setups; how did you know not to enter at the inside bar and the doji before? how did you know to wait for the w&r? In lots of cases with the strong supports that you teach us the..
Here we do not analize, say, where better to enter or how we could enter in different points. You're right that probably we could enter in that point, that you've spoken. But this chart has a bit another application - just to show how wash & Rinse looks, and what to do, if you'll see it.
Here I do not mean that I enter precisely here with W&R. This is just initial chapter about the lines - you need to wait a bit, when chapters about trading the lines and making overall trading plan will be released ;)
The support area was tested numerous times. What gave you the confidence that we're shooting upwards from here? Doesn't it condradict with #4 at the end of this chapter?
Well, if we rely purely on W&R pattern - that's become clear, because this is Bullish pattern and tells that we should move higher.
What contradiction do you see with this:Stop Licking is a fast pattern, so if market has broken support/resistance level (i.e. closed below/above it) and holds there for 3 periods (i.e. 3 bars/candles) or more, then probably this level has been erased by market action and not valid any more.?
In general this is initial chapter that has no target to discuss the trading of the lines but to show different scenarios. There will be another chapter that will be dedicated particularly to trading.
M
mjunkyard
12 years ago,
Registered user
Thanks Sive, once you clarified the first point all the questions got answered!
Thanks again. Your education is invaluable.
Thanks again. Your education is invaluable.
J
john Garbett
12 years ago,
Registered user
Confluence Support and Agreement
Hi Sive
In your weekly analysis and daily videos of the EUR/USD pair you use the terms confluence support and agreement very regularly.
How can I work these areas out for myself, and if I were to do so, how do I know if I have got it right? It seems to me that finding the area where there is confluence support and agreement is absolutely essential to establish on the weekly and daily timeframes.
Once again many thanks for all of your help.
John
Sive Morten
12 years ago,
Registered user
> Hi Sive
In your weekly analysis and daily videos of the EUR/USD pair you use the terms confluence support and agreement very regularly.
How can I work these areas out for myself, and if I were to do..
Hi John.
This topic will be disclose with details in Fibonacci chapter. Read it, and if you will still have any questions - we will discuss them.
A
Arik
12 years ago,
Registered user
Hello Sive
question? about a time interval in question, thank you in advance
.
Forth rule - Stop Licking is a fast pattern, so if market has broken support / resistance level (ie closed below / above it) and holds there for three periods (ie 3 bars / candles) or more, then probably this level has been erased by market action and not valid any more.
Sive Morten
12 years ago,
Registered user
> Hello Sive
question? about a time interval in question, thank you in advance
.
Forth rule - Stop Licking is a fast pattern, so if market has broken support / resistance level (ie closed below / ..
Hi Arik
Here we speak about any interval, since we've said "period". It means that if you trade on 5-min chart, then your 3 period is 15 min, while if you trade on weekly chart, then your period is 3 weeks.
B
BenOm
12 years ago,
Registered user
Elephants or Whales
Hi Sive,
Thank you very much for the invaluable education.
The subject of W/R and Whales is very interesting.
Just out of curiousity,
Do you know how many of these Whales exist? (all approx.)
Do they compete againt each other or collude?
When they open a position(s), what is the approx. lot size?
The lot size must be huge to be able to move the market.
I am just curious and I understand that you may not have the answer.
Best Regards,
Bernard
Sive Morten
12 years ago,
Registered user
> Hi Sive,
Thank you very much for the invaluable education.
The subject of W/R and Whales is very interesting.
Just out of curiousity,
Do you know how many of these Whales exist? (all approx.)
Do..
Hi Bernard,
On some questions we can answer. The position volumes - look at initial chapters of the school. What we do know - overall trading volume per day on spot forex, the greatest participants and their share in this volume. Hence, you can estimate the average position. ;)
Second, due to the structure of FX market, great banks do not see each stop order - they see stops of big FX dealers, which in turn place them to hedge total net client's orders and position - smaller dealers and public. That's why there is no need to make any collude - even small FX broker could give you some quote to link the stops, or use some delay in orders filling or quote trasfering to do that. Read an example in comparison FX with other markets, where we've discussed the orders execution. And you can't prove that there was such price on the market.
A
Amanda_pips
12 years ago,
Registered user
What is the best time frame to identify support and resistance?
Sive Morten
12 years ago,
Registered user
> What is the best time frame to identify support and resistance?
Hi Amanda,
those time frame where you see it clearly. It is better to use higher time frame support resistances levels, since they are more reliable. I mean, if you trade on hourly chart - better rely on daily support/resistance and so on.
Hi Amanda,
those time frame where you see it clearly. It is better to use higher time frame support resistances levels, since they are more reliable. I mean, if you trade on hourly chart - better rely on daily support/resistance and so on.
T
tyburon
12 years ago,
Registered user
Resistance Become Support and Support Become Resistance
Where can i find an indicator for this?
Where can i find an indicator for this?
Sive Morten
12 years ago,
Registered user
Price chart is indicator for classical support/resistance levels.
You may try to read DeMark book "Technical analysis is new sience", there some scrutiny approach to estimate trend lines, support and resistance.
You may try to read DeMark book "Technical analysis is new sience", there some scrutiny approach to estimate trend lines, support and resistance.
J
jmcl
12 years ago,
Registered user
Hello Sive
Will there be a discussion on supply and demand zones in future? Why I am asking is because with the marking of S&R zones the S&D zones are at different places and my problem is to determine the S&D zones correctly.
Thanks for all your hard work which is appreciated.
John from Durban
Will there be a discussion on supply and demand zones in future? Why I am asking is because with the marking of S&R zones the S&D zones are at different places and my problem is to determine the S&D zones correctly.
Thanks for all your hard work which is appreciated.
John from Durban
Sive Morten
12 years ago,
Registered user
> Hello Sive
Will there be a discussion on supply and demand zones in future? Why I am asking is because with the marking of S&R zones the S&D zones are at different places and my problem is to determi..
Hi John,
I'm not exactly understand what do you mean with supply/demand zones, but I suggest that this should be link with trading volume. Could you please give a bit more clarification about it.
Thanks.
J
jmcl
12 years ago,
Registered user
Sive
Yep you are right it should be volume
Thanks
John from Durban
Yep you are right it should be volume
Thanks
John from Durban
Sive Morten
12 years ago,
Registered user
> Sive
Yep you are right it should be volume
Thanks
John from Durban
Well, if you've read School carefully you know that there is a problem to estimate volume on Spot Forex market. We will use it couple of times, mostly based on currency futures, but I'm not sure that this is the same supply/demand zones that youv'e spoken about.
What do you mean with supply demand zones?
P
pph
10 years ago,
Registered user
Hi Sive
How exactly is option market data used to calculate levels of support and resistance on eurusd and also where do you get the information to be able to do the calculations.Is this method reliable.
Regards
How exactly is option market data used to calculate levels of support and resistance on eurusd and also where do you get the information to be able to do the calculations.Is this method reliable.
Regards
K
kba
8 years ago,
Registered user
Reading the chart
Hi Sive,
Thank you very much for your the lecture.
I have been following all the topic smoothly since, but I don't understand how to read the chart and how to apply each of them.
Once again thank you and I appreciate your gift.
Best regards,
kba
Hi Sive,
Thank you very much for your the lecture.
I have been following all the topic smoothly since, but I don't understand how to read the chart and how to apply each of them.
Once again thank you and I appreciate your gift.
Best regards,
kba
K
kba
8 years ago,
Registered user
Can you recommend anytrusted broker for me?
Hi Sive,
Thank you very much for your good work.
Please I would like to start demo practicing now, would recommend a reputable broker for me.
Secondly, as I said earlier, I am finding those charts hard to understand. Please do you the video relating to those charts?
Best regards,
kba
Hi Sive,
Thank you very much for your good work.
Please I would like to start demo practicing now, would recommend a reputable broker for me.
Secondly, as I said earlier, I am finding those charts hard to understand. Please do you the video relating to those charts?
Best regards,
kba
F
fxapex
7 years ago,
Registered user
Yes its better to look at the past movements and then look at the support and resistance levels as its very important to place trades.
R
rucailo
7 years ago,
Registered user
Hi Sive,
I have a question regarding the "big whales"
according to what you say
"Big players (we call them elephants or whales) see this support level also and they also want to buy here. But also they see stop orders just below the level of support, and how big value they are."
How do the big whales see other´s stop orders?
Thanks Sive for your excellent work on this program.
Regards,
Mario
Hamza Samiullah
7 years ago,
Registered user
very informative..
G
Grzegorz1
6 years ago,
Registered user
Hello Mr. Sive
You often use in your analysis K-support term. I know what is support but what is K-support?
Regards.
You often use in your analysis K-support term. I know what is support but what is K-support?
Regards.
IrwanI
6 years ago,
Registered user
Great,Sup&Dem(daily time frame) indicator that i used for a very long time.
Always base on fundamental and the Sup&Dem indicator is used for entry and exit.
Practice it and you will be profitable.
Always base on fundamental and the Sup&Dem indicator is used for entry and exit.
Practice it and you will be profitable.
Table of Contents
- Introduction
- FOREX - What is it ?
- Why FOREX?
- The structure of the FOREX market
- Trading sessions
- Where does the money come from in FOREX?
- Different types of market analysis
- Chart types
- Support and Resistance
-
Candlesticks – what are they?
- Part I. Candlesticks – what are they?
- Part II. How to interpret different candlesticks?
- Part III. Simple but fundamental and important patterns
- Part IV. Single Candlestick Patterns
- Part V. Double Deuce – dual candlestick patterns
- Part VI. Triple candlestick patterns
- Part VII - Summary: Japanese Candlesticks and Patterns Sheet
-
Mysterious Fibonacci
- Part I. Mysterious Fibonacci
- Part II. Fibonacci Retracement
- Part III. Advanced talks on Fibonacci Retracement
- Part IV. Sometimes Mr. Fibonacci could fail...really
- Part V. Combination of Fibonacci levels with other lines
- Part VI. Combination of Fibonacci levels with candle patterns
- Part VII. Fibonacci Extensions
- Part VIII. Advanced view on Fibonacci Extensions
- Part IX. Using Fibonacci for placing orders
- Part X. Fibonacci Summary
-
Introduction to Moving Averages
- Part I. Introduction to Moving Averages
- Part II. Simple Moving Average
- Part III. Exponential Moving Average
- Part IV. Which one is better – EMA or SMA?
- Part V. Using Moving Averages. Displaced MA
- Part VI. Trading moving averages crossover
- Part VII. Dynamic support and resistance
- Part VIII. Summary of Moving Averages
-
Bollinger Bands
- Part I. Bollinger Bands
- Part II. Moving Average Convergence Divergence - MACD
- Part III. Parabolic SAR - Stop And Reversal
- Part IV. Stochastic
- Part V. Relative Strength Index
- Part VI. Detrended Oscillator and Momentum Indicator
- Part VII. Average Directional Move Index – ADX
- Part VIII. Indicators: Tightening All Together
- Leading and Lagging Indicators
- Basic chart patterns
- Pivot points – description and calculation
- Elliot Wave Theory
- Intro to Harmonic Patterns
- Divergence Intro
- Harmonic Approach to Recognizing a Trend Day
- Intro to Breakouts and Fakeouts
- Again about Fundamental Analysis
- Cross Pair – What the Beast is That?
- Multiple Time Frame Intro
- Market Sentiment and COT report
- Dealing with the News
- Let's Start with Carry
- Let’s Meet with Dollar Index
- Intermarket Analysis - Commodities
- Trading Plan Framework – Common Thoughts
- A Bit More About Personality
- Mechanical Trading System Intro
- Tracking Your Performance
- Risk Management Framework
- A Bit More About Leverage
- Why Do We Need Stop-Loss Orders?
- Scaling of Position
- Intramarket Correlations
- Some Talk About Brokers
- Forex Scam - Money Managers
- Graduation!