Part IV. 3-Drive pattern and harmony in classical patterns

3-Drives pattern

Pipruit: Hm, I have double association with this pattern, Commander. First one, is it looks like 2 AB=CD patterns, that linked together and that have one common leg. Second, it reminds me EW thrust wave that consists of 5 sub-waves.
Commander in Pips: What can I say – you’re absolutely right! AS we already know, harmonic patterns also in some sense are fractals. But still they have their own features and qualities, that we have started to discuss.
As we’ve discussed the symmetry that has to be present in any harmonic pattern – AB=CD, “222”, Butterfly – 3-Drives has no exception as well. In fact, symmetry is a core. As the pattern is more symmetrical, it becomes more reliable.
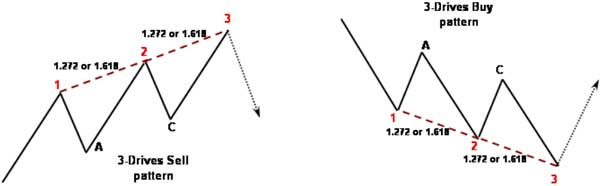
Since you’ve already noted, 3-Drives is a relatively simple pattern in structure. It also could be found at any market and any time frame. It consists of three consecutive tops/bottoms and also contains AB-CD in last 2/3 part of it. I’ve marked only A and C letters, just to keep the picture simple. As a rule, the 3-Drives pattern appears on tops or bottoms as a final push before reversal starts. Although 3-Drives is a reversal pattern, it does not mean that after it has appeared - total reversal will start. It could lead to just some retracement in the opposite direction…
Pipruit: And may be it does have some minimum target that we can count on?
Commander in Pips: Well, I can’t say that it will hold for 100% but very often the minimum target of this pattern is a gravitating to take out low/high between 2d and 3d drives. Other words – th market tends to clear the C point.
Pipruit: I see. That’s definitely what I want to hear, Sir.
Commander in Pips: Since the pattern has accomplished, we have to look, how the consecutive move develops. Very often, if this is a real reversal, we can see thrusting action in the opposite direction to the 3-Drives pattern.
As you can see from the picture above, this pattern consists of 3 consecutive tops or bottoms. Each of them is higher/lower than the previous one. Distance from the drive 1 to drive 2 should be 1.272 or 1.618 expansion, so as between drive 2 and 3.
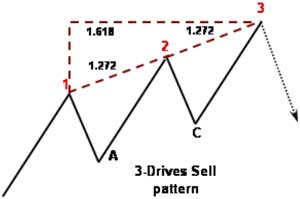
Sometimes it happens, that drive 2 stands at 1.272 expansion of drive 1, and drive 3 stands at coincidence of 1.618 extension from 1st drive and 1.272 of 2nd drive. Look at the picture – here is example of a “Sell” pattern, but it also could be seen on a “Buy” pattern as well:
Second important part of 3-Drives is the inner AB=CD. Perfectly if BC retracement stands at 0.618 or 0.786 of AB, so as for first retracement after first drive. If the BC leg reaches just 0.382 it tells us that probably the trend is still strong and 3-Drives pattern has more chances to fail.
Do not try to draw this pattern by force, because in that case you may see this pattern there, where it totally absent. It should be a pleasure to an eye to watch at it, and since you’ve recognized it - it should be rather harmonic.
The second important part of symmetry is a harmony in time. Moves from point A to second drive and from point C to third drive should have approximately equal number of bars to form. At least the number of bars should relate to each other with major Fib ratio. For instance, if AB leg consists of 8 bars and CD leg is of 13 bars, then 8/13 ~ 0.618, something like that.
Invalidating points of 3-Drives pattern
1. Drive 1 above/below drive 2 for sell/buy pattern, so as drive 2 above/below drive 3;
2. C-point below/above A-point for Sell/Buy 3-Drives pattern;
3. If pattern shows extensions greater than 1.618, then it treated as a failed one;
4. If market shows gaps or long-ranged bars while is forming 3-Drive pattern in the direction of it, especially closer to third drive completion point, then probably this pattern will fail. At least you need to wait for additional confirmation of this pattern after it will be completed.
That’s being said, 3-Drives pattern as with any other should have three degree of symmetry – price symmetry in AB-CD and drives expansions, time - in duration of AB and CD legs, and visual – it should be pleasure to an eye to look at it.
Pipruit: Ok, it does not look too difficult, especially after all other stuff that we’ve studied.
Commander in Pips: Excellent! So, we can pass to trading process then. I have something special for you…
Pipruit: Please give me relief…
Commander in Pips: Don’t worry, it will be interesting. We will start from followed chart:
Chart #1 | 60-min EUR/USD 3-Drives “Sell” pattern
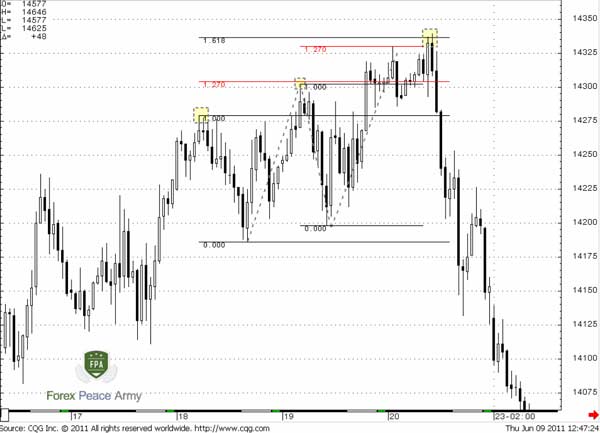
Pipruit: Well, I see that the pattern holds according our rules, in terms of price action and time. C point stands above A, so everything in order. Also this is an example when 1.618 from first drive coincides with 1.27 of second. This makes this pattern stronger. Also, we see that this is reversal pattern – as you’ve said, right after it completed market shows a strong thrusting move in the opposite direction.
Commander in Pips: Very well, son. Concerning trading this pattern, we should act as with other harmonic patterns. Try to describe how we should act in current environment.
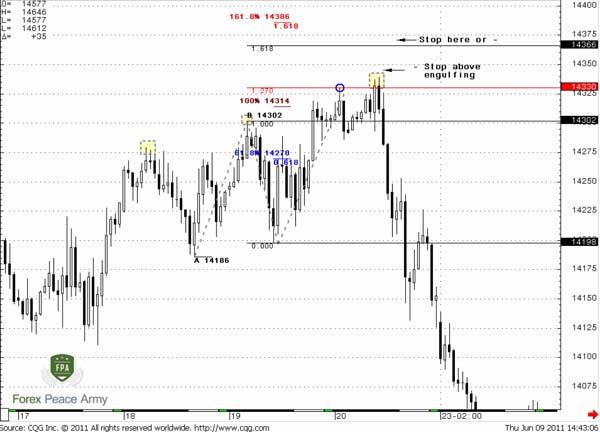
Pipruit: Ok, I’ll try. First, we should decide where to place stop. As we’ve said, if market will exceed 1.618 target of the pattern, very probable, that this pattern will fail. Hence, our first area to place stop is above 1.618 of second drive. Since this is 60-min chart, I suppose we can use this way.
Second possibility, is if our account rather small, we can use harmonic swing on hourly chart about 37 pips, but in our case it gives us the same level as using 1.618 expansion of second drive.
Third possibility is to use some patterns that could appear around completing point of this 3-Drives. This could be used if we trade at large time-frame, say, on weekly, or if our account very small. Here, fortunately we have bearish engulfing right at point of completion of 3-Drives pattern. It allows us to place a very tight stop – just above this pattern.
Commander in Pips: Very good. And which one will you choose?
Pipruit: I will probably choose the first way. It’s not so far, because we trade on an hourly chart, but it’s much safer and logical in terms of probability than the third way of stop placing. Besides, as you can see, the market has reached third drive target right in the point of AB-CD completion and only after that retested this highs, cleared them and shown engulfing. So, applying third approach to stop placing could lead you to need to re-enter, while using first way holds your stop untouched.
Commander in Pips: Excellent.
Chart #2 | 60-min EUR/USD 3-Drives “Sell” pattern and Pipruit stop placement
Pipruit: Now we should calculate our position value. As we’ve said our stop is 40 pips roughly. Since an average account is about 5000$, we need a potential loss no more than 100$. Hence our trading volume will be 0.25 standard lots.
Now is the most difficult question. Where to take profit? First, as I remember, we need take profit that equals potential risk - 40 pips.
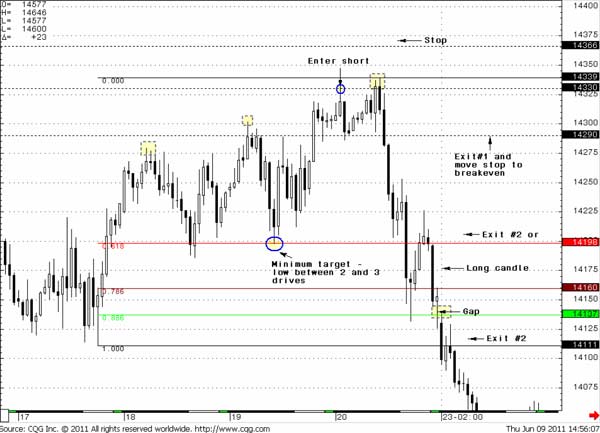
Chart #3 | 60-min EUR/USD 3-Drives “Sell” pattern and Pipruit exits
Now is the most difficult question. Where to take profit? First, as I remember, we need take profit that equals potential risk - 40 pips.
Chart #3 | 60-min EUR/USD 3-Drives “Sell” pattern and Pipruit exits
So I will take 40 pips profit at 1.4290 and then move stop on the rest of position to breakeven. Since we’ve said that most common target that this pattern reaches is the low between second and third drives – probably I will take second profit there.
But, looking in rearview that is of cause much simpler than act in real-time, I can say that probably it has made sense to keep second half of position a bit longer. We have nasty black bars down, especially near 0.618 Fib support. It could tell us that probably it will not hold. Then we see acceleration gap near 0.886 Fib support and the same nasty bar just before that…
You teach me to think in probabilities and that we never know if it will be reversal 3-Drives or just retracement after that. So, from that standpoint my action looks logical. Probably when I’ll get more experience – I will be able to grab more profit, but now we should act simply but surely.
Commander in Pips: You’re done well, and do not be ashamed with the smaller profit than it could have been. I think that you will not care about it, when you will start the second glass on the plane to Hawaii.
Pipruit: I hope that this will happen sometime.
Commander in Pips: Sure it will. But now let’s move to the second part of this chapter – compounding of harmonic patterns and using them in trading classical patterns.
Advanced comments - compounding of Harmonic patterns
We will start from the following chart:
Chart #4 | 60-min EUR/USD
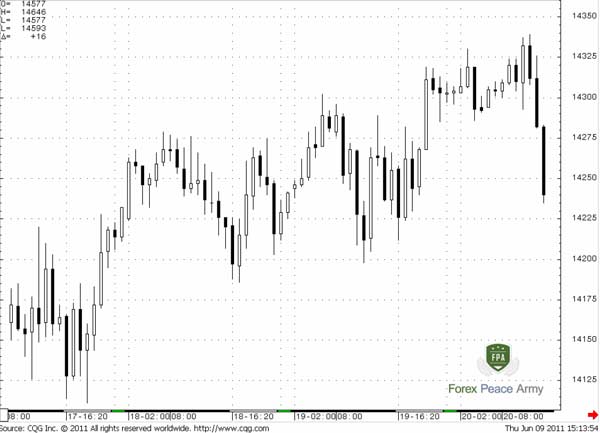
Do you see something here?Pipruit: I don’t know, may be some AB=CD’s… Wait a minute, I see Butterfly!
Ok, this is the same chart of 3-Drives pattern, but without markings…
Pipruit: I can’t believe it.
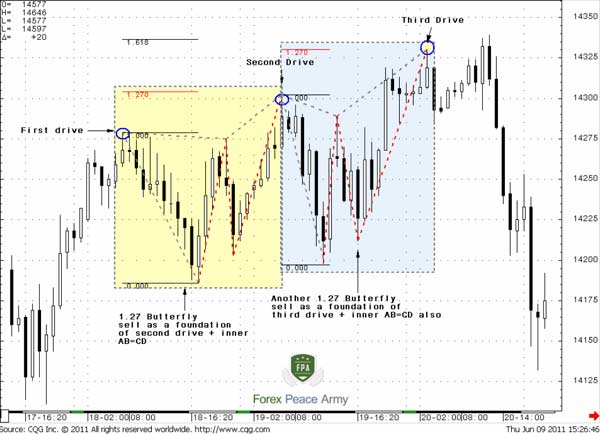
1. First drive and start of a second are 1.27 Butterfly “Sell”;
2. Second and third drives are another 1.27 Butterfly “Sell”;
3. Both Butterflies, as we already know have inner AB=CD’s;
4. Then 3-Drive pattern itself, that also includes larger AB=CD, which overlap both Butterflies. This could be seen on chart #2.
Pipruit: Sir, this is just amazing! But how we can apply that?
Commander in Pips: First, when you do not even think, that 3-Drive could appear – you can trade first Butterfly with a nice profit – so you ride on first drive.
Second, if you even could not recognize 3-Drives, you can act, based on the second butterfly alone. Since it has the same target as 3-Drive and the same stop placing level – for you there will not be difference to trade this butterfly or 3-Drive.
And the last but most important thing - just imagine that you have at least 3 patterns that point on the same level for short entry – Butterfly (second), large AB-CD and 3-Drives. What are your thoughts then?
Pipruit: Well, I will have a lot of confidence to enter.
But it not necessary always will be like on chart #5. Sometimes it could be two butterflies without holding 3-Drives, or different AB=CD, “222” or something.
Chart #5 | 60-min EUR/USD 3-Drives pattern compounding
Now let’s talk about how harmonic patterns could be the part of classical patterns. Let’s start from the same 3-Drives. Very often it could take form of Wedge or Triangle pattern. Obvious that different kind of Butterflies as on chart #5 and AB=CD’s also are parts of it:
Sometimes targets of harmonic patterns could coincide with Fib extensions or retracement levels, Pivot points, classical support/resistance lines, etc. You have to combine all this stuff. Because it allows you to watch at situation from all points of view and either to get more confidence in potential trade or decide to skip it.
Commander in Pips: You’re very smart guy, but jokes aside – you’re absolutely right. I’m glad that you understand that.
Here is the last example for today – reverse Head & Shoulders pattern that we’ve discussed already. Applying of harmonic patterns adds many colors to the trading process:
Also take a note that very often right at the top/bottom of the head Butterfly could form. This usually looks like head consist of two smaller tops/bottoms and second one is higher/lower than the first one. This kind of compounding and analysis definitely will give you such possibilities for trading that you can’t get using only the classical approach - and just awaiting of neckline breakout.
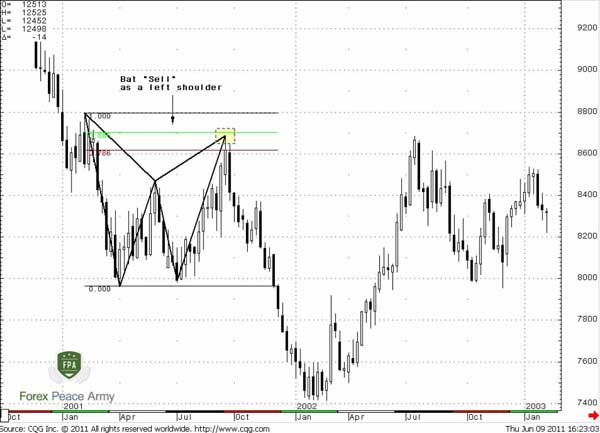
Pipruit: Cool! Also it seems that you’ve missed the Bat pattern that is the left shoulder. So we can sell even prior Butterfly “Buy” pattern:
Chart #8 Weekly JPY/USD H&S pattern in a view of harmonic patterns
Commander in Pips: Oh... Now I see that you really do understand me. Well done!
Commander in Pips: Oh... Now I see that you really do understand me. Well done!
Now let’s talk about how harmonic patterns could be the part of classical patterns. Let’s start from the same 3-Drives. Very often it could take form of Wedge or Triangle pattern. Obvious that different kind of Butterflies as on chart #5 and AB=CD’s also are parts of it:
Chart #6 | 60-min EUR/USD 3-Drives Sell pattern as bearish Wedge
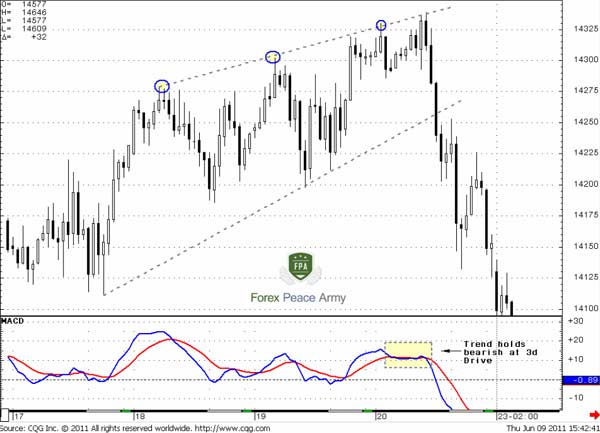
Second important moment that 3-Drives pattern as a rule is confirmed by the trend indicator. In our example it’s a MACD. This confirmation looks like trend shifting at around the third drive completion point. See - market establishes new high at third drive, but the trend has turned and holds bearish. Later we will discuss such term as “divergence” – this is different move in price and indicator. For instance price establishes new highs, but MACD does not follow it and second top of oscillator is lower than previous one. This phenomenon you can see very often at third drive point.Sometimes targets of harmonic patterns could coincide with Fib extensions or retracement levels, Pivot points, classical support/resistance lines, etc. You have to combine all this stuff. Because it allows you to watch at situation from all points of view and either to get more confidence in potential trade or decide to skip it.
Pipruit: Hold on, Sir. Looks like I’ve got it. You want to say that applying harmonic approach to classical patterns we can trade classical ones more delicately and effectively, right? For instance, in classical approach, to trading a wedge, we need difficult technique of confirmation, applying trend, some reversal patterns or entering after breakout. But applying harmonic patterns we can, first, trade the whole wedge from the beginning to the end as it was with side-by-side butterflies, second – enter in the direction of breakout almost at spot point due completion of 3-Drives pattern!
Here is the last example for today – reverse Head & Shoulders pattern that we’ve discussed already. Applying of harmonic patterns adds many colors to the trading process:
Chart #7 | Weekly JPY/USD H&S pattern in a view of harmonic patterns
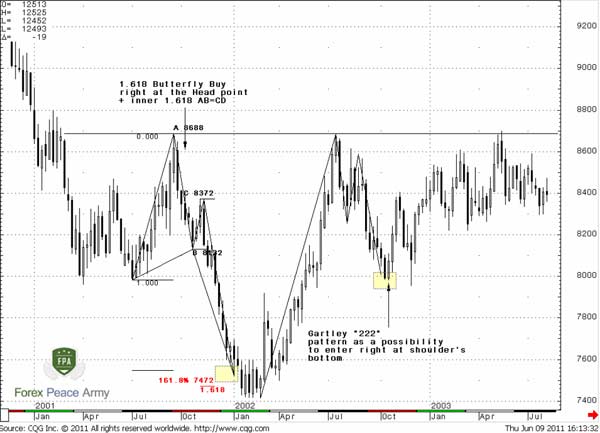
First of all, you will be able to enter long right at the bottom of the head, since it was the target as 1.618 Butterfly “Buy” as inner 1.618 AB=CD. Later, when formation of H&S has become obvious you have another chance with Gartley “222”.Also take a note that very often right at the top/bottom of the head Butterfly could form. This usually looks like head consist of two smaller tops/bottoms and second one is higher/lower than the first one. This kind of compounding and analysis definitely will give you such possibilities for trading that you can’t get using only the classical approach - and just awaiting of neckline breakout.
Pipruit: Cool! Also it seems that you’ve missed the Bat pattern that is the left shoulder. So we can sell even prior Butterfly “Buy” pattern:
Chart #8 Weekly JPY/USD H&S pattern in a view of harmonic patterns
Comments
A
Aldo Colombo
12 years ago,
Registered user
Is it before my nose? or I can´t find B&B and DRPO patterns Sive's always talking about?
Thank you.
Thank you.

Sive Morten
12 years ago,
Registered user
Hi Aldo,
DRPO and B&B are mentioned and described in Joe DiNapoli book "Trading with DiNapoli Levels" that is a law protected context. So I have no legal permission to post it in our school.
Read the book, or find some videos/weekly research where we've traded them - use forum search tool.
DRPO and B&B are mentioned and described in Joe DiNapoli book "Trading with DiNapoli Levels" that is a law protected context. So I have no legal permission to post it in our school.
Read the book, or find some videos/weekly research where we've traded them - use forum search tool.

Xenofanes
11 years ago,
Registered user
try buying it directly from Amazon.com, and on page 72 of this excellent and famous book there is written all about "double repenetration" :mad:;) - since time I discovered it I am dreaming about repenetration during my lonely evenings....;)

Hamza Samiullah
6 years ago,
Registered user
Amazing work...
O
One-fm
5 years ago,
Registered user
Great lesson.
Z
zhilone32
4 years ago,
Registered user
Have you buy Joe DiNapolis trading book
> try buying it directly from Amazon.com, and on page 72 of this excellent and famous book there is written all about "double repenetration" :mad:;) - since time I discovered it I am dreaming about repe..
> try buying it directly from Amazon.com, and on page 72 of this excellent and famous book there is written all about "double repenetration" :mad:;) - since time I discovered it I am dreaming about repe..
Table of Contents
- Introduction
- FOREX - What is it ?
- Why FOREX?
- The structure of the FOREX market
- Trading sessions
- Where does the money come from in FOREX?
- Different types of market analysis
- Chart types
- Support and Resistance
- Candlesticks – what are they?
- Mysterious Fibonacci
- Introduction to Moving Averages
- Bollinger Bands
- Leading and Lagging Indicators
- Basic chart patterns
- Pivot points – description and calculation
- Elliot Wave Theory
- Intro to Harmonic Patterns
- Divergence Intro
- Harmonic Approach to Recognizing a Trend Day
- Intro to Breakouts and Fakeouts
- Again about Fundamental Analysis
- Cross Pair – What the Beast is That?
- Multiple Time Frame Intro
- Market Sentiment and COT report
- Dealing with the News
- Let's Start with Carry
- Let’s Meet with Dollar Index
- Intermarket Analysis - Commodities
- Trading Plan Framework – Common Thoughts
- A Bit More About Personality
- Mechanical Trading System Intro
- Tracking Your Performance
- Risk Management Framework
- A Bit More About Leverage
- Why Do We Need Stop-Loss Orders?
- Scaling of Position
- Intramarket Correlations
- Some Talk About Brokers
- Forex Scam - Money Managers
- Graduation!