Part II. Buying and Selling the News

Pipruit: And what it is?

Pipruit: Yes, I remember that.
Pipruit: And why they can’t do it right after the release?
Commander in Pips: Think by yourself – they are 60% of overall Forex trades. If this huge mass of money comes flooding in all at once – what will happen on the market? This is absolutely unwelcome for big banks. They can do this gradually on calm markets with low volatility days. This is more preferable than turning over huge position in doom & gloom, because that will cost much more money.
Commander in Pips: When the moment of truth will come – I mean release time - all eyes will be locked on the actual and expected number divergence.
Pipruit: Ok, ok, I know… If data will release better than previously we will see growth of the currency, if worse then we will see decrease, right?
Commander in Pips: Not quite. Let’s suppose that you expect a release of US Retail Sales number. The previous number was at 1.0% m/m growth. Let’s assume that the actual number comes at 2.0%. What move on EUR/USD you will see?
Pipruit: Well, probably appreciation of USD, or downward move on EUR/USD…
Commander in Pips: And if consensus expectation was at 2.5%?
Pipruit: Hm, I don’t know…
Commander in Pips: Ok the major rule is to compare the actual number with consensus forecast, since it shows how large banks have already adjusted their positions and what they do expect. In our case, releasing Retail Sales at 2% could lead to weaker USD, despite the fact that current month data is two times better than in the previous one. This happens because big whales have adjusted their positions thinking that the US economy stronger than it has appeared by real data. Hence they will have to re-adjust it to a weaker long-term expectation and this could lead to some decrease of USD against the EUR (growth of EUR/USD).
Commander in Pips: Absolutely. Of course, you will see some splashes and additional volatility, but they will come from small speculators and will not hold for a long time, since large participants have already adjusted their positions.
Commander in Pips: Yes, since the economy has shown to be even weaker than expected and large banks will start to adjust their positions – for instance, reducing dollar holding against other currencies. But anyway this adjustment will be not as significant as it could be, if they have not adjusted it before.
Commander in Pips: Also the strength of possible reaction depends on the importance of data. If this is the third revision of GDP, it’s hardly likely that you can expect some significant reaction to it, compared, for instance, with the NFP release.
The second important rule is “how big is the difference of actual data from consensus.” We might say that this is the core of news trading. Different data has its own crucial difference that can trigger the move on market. The less important the data, the greater difference is demanded by traders. Usually this difference is measured in percents. For instance, for NFP it could be just 10-15% difference and it could lead to a very significant short-term reaction on market, while for Housing starts indicator will be necessary to have at least a 25% difference. These numbers are just for illustration. I suppose that it will be your homework to investigate and find this “triggering difference” for major data.
Commander in Pips: Very simple. On historical chart find day of, say, NFP releases. Estimate, how different they were from expectation and estimate the move that has followed the release. So, you will estimate minimum required difference that leads to a significant move. Without this procedure you will not be able to apply next and most common way of news trading – fact number trading.
This is the more common way to do news trading. Those traders who have done their homework on estimation of “triggering differences” for every major piece of data know what difference has to happen between actual and consensus numbers to lead to a significant move on the market. Before release time they have trading plans for a negative difference and for a positive. All that they have to do during release is assess the real number fast and fill the orders. If actual data shows not enough skew from consensus (less than necessary “triggering difference”), then they do nothing and skip that trade. This is called actual number trading, since you do not have any preliminary view and expectation about the number. You act by fact – in any direction, depending on actual data.
Commander in Pips: Ok the major rule is to compare the actual number with consensus forecast, since it shows how large banks have already adjusted their positions and what they do expect. In our case, releasing Retail Sales at 2% could lead to weaker USD, despite the fact that current month data is two times better than in the previous one. This happens because big whales have adjusted their positions thinking that the US economy stronger than it has appeared by real data. Hence they will have to re-adjust it to a weaker long-term expectation and this could lead to some decrease of USD against the EUR (growth of EUR/USD).
Pipruit: Wow, I see. So if it will be right at consensus, despite that it comes in 2 times higher than last time, this could lead to a flat market with the absence of any solid move, right?
Commander in Pips: Absolutely. Of course, you will see some splashes and additional volatility, but they will come from small speculators and will not hold for a long time, since large participants have already adjusted their positions.
Pipruit: Well, but can we tell that if number will be, say, 0.5%, we can count on some significant counter USD move?
Commander in Pips: Yes, since the economy has shown to be even weaker than expected and large banks will start to adjust their positions – for instance, reducing dollar holding against other currencies. But anyway this adjustment will be not as significant as it could be, if they have not adjusted it before.
Pipruit: I see.
Commander in Pips: Also the strength of possible reaction depends on the importance of data. If this is the third revision of GDP, it’s hardly likely that you can expect some significant reaction to it, compared, for instance, with the NFP release.
The second important rule is “how big is the difference of actual data from consensus.” We might say that this is the core of news trading. Different data has its own crucial difference that can trigger the move on market. The less important the data, the greater difference is demanded by traders. Usually this difference is measured in percents. For instance, for NFP it could be just 10-15% difference and it could lead to a very significant short-term reaction on market, while for Housing starts indicator will be necessary to have at least a 25% difference. These numbers are just for illustration. I suppose that it will be your homework to investigate and find this “triggering difference” for major data.
Pipruit: And how can I accomplish this?
Commander in Pips: Very simple. On historical chart find day of, say, NFP releases. Estimate, how different they were from expectation and estimate the move that has followed the release. So, you will estimate minimum required difference that leads to a significant move. Without this procedure you will not be able to apply next and most common way of news trading – fact number trading.
This is the more common way to do news trading. Those traders who have done their homework on estimation of “triggering differences” for every major piece of data know what difference has to happen between actual and consensus numbers to lead to a significant move on the market. Before release time they have trading plans for a negative difference and for a positive. All that they have to do during release is assess the real number fast and fill the orders. If actual data shows not enough skew from consensus (less than necessary “triggering difference”), then they do nothing and skip that trade. This is called actual number trading, since you do not have any preliminary view and expectation about the number. You act by fact – in any direction, depending on actual data.
Pipruit: Well, sounds interesting?
Directional data trading
Commander in Pips: Let’s speak a bit more about the first type of trading, that assumes a directional view on some macro data, and hence, on its new release. For simplicity let’s discuss the same retail sales. As we’ve said we have to have some predefined view on expected data. But that is not enough. As we’ve said, even if retail sales will be good, there will appear the other question – how good, and why? We know that the “growth of economy” is good, while “recession in economy” is bad, the same we can say about retail sales – growth in retail sales is good while reducing of retail sales is bad. But not all things are so simple.
In fact, it is just called “directional data trading”, while in reality this data trading is mostly based on fundamental analysis. Sometimes when we see that some data, let it be the same retail sales, comes in better than expected, we do not see any positive reaction on dollar. Instead of solid down EUR/USD move it turns to some flat action or showing an unconfident move down. Why? It could happen, because even positive current retail sales data does not change the overall trend of the US economy. Particularly this number can’t prove to investors that the US economic environment has changed. This is almost like a move in parallel channel. In bearish parallel channel there are moments when price shows an upward move, but it does not change the overall bearish direction. The same is here.
Second reason is a period itself. For instance, we look at November and December retail sales releases. Even tremendous growth could be not sufficient for a solid reaction on markets, since Thanksgiving day, Black Friday shopping and the Christmas shopping rush could lead to a significant splash in retail sales. Such nuances exist for most data.
To successfully trade on data directionally you have to see the larger picture. Study the dynamic of retail sales for extended period, so you are able to compare year to year growth and the overall trend. It’s better if you will have some regression model of forecasting retail sails, based on its link with other data, so that retail sales are in a row with the overall economy and so on. In other words, for directional data trading, you must understand how particularly this data will be built into the overall picture. Will it have influence or not on the overall tendency? For instance, for changing the fundamental situation you need really outstanding numbers. In this case – whatever upside surprise will happen – it will not launch a significant move on markets.
So, I suppose, you’ve got the idea, so let’s focus on some examples…
Here is a typical preparation work on the release date. First, you have to look at the overall trend in Retail Sales. Since this release for September, there were no significant holidays that could lead to a jump in sales. From that point of view everything is clear.
Now you have to investigate fundamental aspects of the current situation in the economy. You see that there was some reversal point in retail sales. Also you see the upward tendency in other data – personal consumption, reduction in unemployment, GDP growth. That coincides with your observation of changing in retail sales trend during the previous year. Also you see repeating growth in retail sales on a year to year basis and see that GDP has reached the pre-crisis numbers adjusted for inflation. So, your view on retail sales is moderately bullish. Probably your regression forecasting model tells that the real number should be slightly greater than expected.
From that conclusion you understand, that even small upward surprise will not lead to strong strengthening in the USD and you may count on only a small move. That’s why you apply intraday strategy.
Let’s just assume (although it is not) that this is EUR/USD chart right at release moment of Retail Sales:
To avoid double losses, you place Stop entry order at the downward breakout of the rectangle, stop above the upper border, target – at 1.3680 – 68 pips lower of lower border.
At the release moment the market shows a solid move down and triggers your entry order. You may want to shift your stop loss order inside the rectangle right above the high of the thrusting bearish candle.
This way of data trading gives you some psychological advance, since you will not be forced to act during the release and halve already made all preparations in advance. In the moment of release you will be just watching the development of the situation.
Some time later, you’ve got your profit taking order. So, your trade was successful this time.
If you plan to trade news directionally, you have to look deeper inside the numbers to understand the overall process and information for a particular report, not just compare it with consensus forecast. Otherwise, you may fall to very unpleasant trades.
Hopefully we have Peter O who can lead us through this process unharmed.
Occasional news trading
Commander in Pips: I hope you don’t mind that I’ve called that way of news trading with some sarcasm. Of course, this is not “occasional” trade, it’s intended one, but I call it like that just to appoint important moment that shows us the difference from a directional news trade. In this type of news trading we do not have any predefined view on news. We don’t care – will they show upward surprise or downward surprise. All that we are caring about is that they will show any surprise, and how large it will be – the larger surprise all the better. Our main task here is to pull the trigger in time and have detailed trading plan as for negative and for positive surprise in the data prior to release time.
Since surprise is greater with greater data type, say NFP, such kind of “important” data quite suitable to trade them in “occasion” mode – in most cases they will show significant surprise.
Commander in Pips: We will show you one of the possible ways and mention another one, but these strategies do not limit all possible ways of news trading. They are just applied more often than the others.
First strategy – two-side trading (spot straddle trading)
1. Look at price action just before the release time. Very often due to expectations of release, the market stands in the range. The tighter the range is - the stronger move could happen at breakout.
2. Place two stop entry orders on breakout in different directions with target equals the range width (classical approach) or some other way (extensions, harmonic patterns etc). You may apply the harmonic number for a particular currency. For EUR/USD this number is approximately 20 pips.
3. Place stop-loss order for buy entry 1 harmonic number lower than the upper border and for sell entry – 1 harmonic number higher than the lower border of the range.
If your broker allows you – you may place OCO orders, if not – manage them manually.
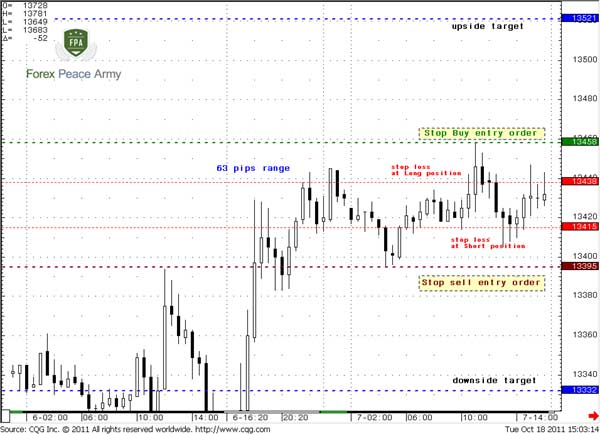
Ok, let’s say we’ve done all this stuff, and now at the eve of the most recent 7th of October NFP release. On chart #3 we see that some hours prior the release, the market stands in a 63 pips range. The upper border stands at 1.3458, the lower at 1.3395. So, we have to place our stop entry orders – one is above 1.3458, say at 1.3465-1.3470, and another one is below 1.3395 – at 1.3380. For each position we need to attach 1 harmonic number stop-loss order. So, for bullish positions, the stop loss will be at 1.3438, while for a bearish one it is at 1.3415. We will use here the classical approach to trading ranges – set target as the width of the range – 63 pips. Upward target will be at 1.3521 (63 pips), downward – 1.3332:
Chart #3 | 30-min EUR/USD
4. Wait news release moment:
Commander in Pips: You’re right. We can’t hit the bull eye every time. Still, if you apply our rule, that we’ve appointed earlier to place targets not at precise level but slightly ahead of it – then everything is OK.
By the way, do you know that this NFP was extremely bullish for USD? They have released more than 1.5 times better than expected…
Commander in Pips: See the followed plunge? This is real reaction to the NFP release. The upward move is a closing of bearish positions by large traders who has expected to see a bear surprise… But you have made your money particularly on that move. Now, probably you understand why I’ve called this way of news trading as “occasional” – you just do not need to understand the fundamentals of the move – you need to be in right place at right time. That’s all! That is what all this stuff is about!
Commander in Pips: Hold on, son – I’m not finished with this one. Let’s speak about scenarios of that trade. The current scenario that we’ve shown is most preferable for you:
First scenario (most preferable):
Entry stop has been triggered, stop-loss remains untouched, target has been hit;
Second scenario – positive in general:
First Entry stop has been triggered but later you were stopped out. Luckily second entry has been triggered also and opposite target has been reached. Although you’ve caught stop-loss on the first trade, profit from the second one has let you to remain with some profit still. Hence this is a rule – always make advance calculations so, that potential profit was at least 2 times higher than the stop-loss.
Third scenario – totally negative:
I think you already understand about what I’m speaking – you have been stopped out twice at both legs, or at least once, but the second entry order has not been triggered, or target has not been achieved. Here is most negative scenario for you. Although it could let you to stand at breakeven or even with small profit (if, say, second trade has not achieved the target, but still show some profit), most times you will get loss.
This is very typical for unimportant news data or when surprise is quite shallow. That’s why, you may apply second strategy of unbiased news trading:
Second strategy – fast hands trading
The core of this trade is the same as for the first one – it’s still “occasional”. At the same time there is an important difference – you enter not prior but after the news release. The major task for you here is to assess surprise. The faster you will assess it – the more pips you will earn. Since you will know the direction of surprise – you also will know the direction of entering long or short. Here is just two preparations should be made before release:
1. The same work with target estimation;
2. Some (surprise level)/(potential move) ratios that will let you assess target properly. For instance, you may estimate how the market reacts on different value of surprises based on historical data. As a result you should have for every major data table like that – 10% surprise – 30 pips move; 20% - 50 pips; 30% - 65 pips; 50% or higher – 120 pips.
3. Then you have to calculate, potential values of, say NFP that will correspond to these surprises. This is necessary for fast reaction of real data. For example, let suppose, that consensus forecast for NFP is 80K. You now that 20% surprise is 96 K, 30% - 104K and 50% - 120K. So, if actual the NFP will release at 115K you will be able to quickly assess that the probable move will be at least 65 pips. If you will start to calculate right at release time – you will miss whole move. All numbers are occasional, just for illustration.
4. When you see actual numbers, you know in what direction to enter – just pull the trigger and track your position. Place a stop-loss order. Close the position when your profit will reach the number approximately that is in your surprise scale sheet.
Commander in Pips: That’s right. But still, after that market has worked out this surprise in a way how it has to. Still, you’re absolutely right – that is a major risk. You never know if there will be an opposite move before the moment when the market will start to move according to the surprise or not, and how strong it will be. So this is some kind of mastership and more a art than a science. To take some pause right after release, or not? Or pull the trigger fast?
Still when data has already come out you know the surprise direction and in most cases, despite on possible preliminary opposite move due position closing, the market will outwork this surprise. When to enter, how to enter – this is some kind of knowlege that comes from experience.
Also be extra careful, since during some US data there could be other countries releasing data that could skew the effect of a surprise from US. You have to take into consideration all aspects.
So, that is all about news trading – choose your position, son.
Directional data trading
Commander in Pips: Let’s speak a bit more about the first type of trading, that assumes a directional view on some macro data, and hence, on its new release. For simplicity let’s discuss the same retail sales. As we’ve said we have to have some predefined view on expected data. But that is not enough. As we’ve said, even if retail sales will be good, there will appear the other question – how good, and why? We know that the “growth of economy” is good, while “recession in economy” is bad, the same we can say about retail sales – growth in retail sales is good while reducing of retail sales is bad. But not all things are so simple.
In fact, it is just called “directional data trading”, while in reality this data trading is mostly based on fundamental analysis. Sometimes when we see that some data, let it be the same retail sales, comes in better than expected, we do not see any positive reaction on dollar. Instead of solid down EUR/USD move it turns to some flat action or showing an unconfident move down. Why? It could happen, because even positive current retail sales data does not change the overall trend of the US economy. Particularly this number can’t prove to investors that the US economic environment has changed. This is almost like a move in parallel channel. In bearish parallel channel there are moments when price shows an upward move, but it does not change the overall bearish direction. The same is here.
Second reason is a period itself. For instance, we look at November and December retail sales releases. Even tremendous growth could be not sufficient for a solid reaction on markets, since Thanksgiving day, Black Friday shopping and the Christmas shopping rush could lead to a significant splash in retail sales. Such nuances exist for most data.
To successfully trade on data directionally you have to see the larger picture. Study the dynamic of retail sales for extended period, so you are able to compare year to year growth and the overall trend. It’s better if you will have some regression model of forecasting retail sails, based on its link with other data, so that retail sales are in a row with the overall economy and so on. In other words, for directional data trading, you must understand how particularly this data will be built into the overall picture. Will it have influence or not on the overall tendency? For instance, for changing the fundamental situation you need really outstanding numbers. In this case – whatever upside surprise will happen – it will not launch a significant move on markets.
So, I suppose, you’ve got the idea, so let’s focus on some examples…
Here is a typical preparation work on the release date. First, you have to look at the overall trend in Retail Sales. Since this release for September, there were no significant holidays that could lead to a jump in sales. From that point of view everything is clear.
Now you have to investigate fundamental aspects of the current situation in the economy. You see that there was some reversal point in retail sales. Also you see the upward tendency in other data – personal consumption, reduction in unemployment, GDP growth. That coincides with your observation of changing in retail sales trend during the previous year. Also you see repeating growth in retail sales on a year to year basis and see that GDP has reached the pre-crisis numbers adjusted for inflation. So, your view on retail sales is moderately bullish. Probably your regression forecasting model tells that the real number should be slightly greater than expected.
From that conclusion you understand, that even small upward surprise will not lead to strong strengthening in the USD and you may count on only a small move. That’s why you apply intraday strategy.
Let’s just assume (although it is not) that this is EUR/USD chart right at release moment of Retail Sales:
Chart #1 | Hourly EUR/USD
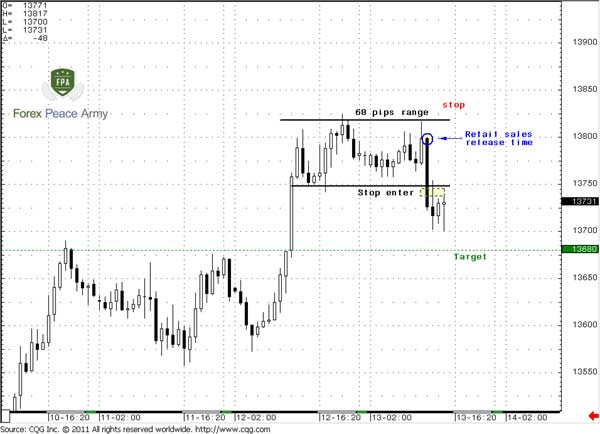
Since you know the direction (down of EUR/USD), you still have to do some technical work, since you have to estimate an entry point and potential target. Observation of price action during previous hours before release will help you. Since you do not expect a significant move, just light reaction on data, you apply an hourly chart. Here we see that the market stands in a rectangle and apply classical rule of trading it – move after breakout should be equal to the width of rectangle.To avoid double losses, you place Stop entry order at the downward breakout of the rectangle, stop above the upper border, target – at 1.3680 – 68 pips lower of lower border.
At the release moment the market shows a solid move down and triggers your entry order. You may want to shift your stop loss order inside the rectangle right above the high of the thrusting bearish candle.
This way of data trading gives you some psychological advance, since you will not be forced to act during the release and halve already made all preparations in advance. In the moment of release you will be just watching the development of the situation.
Some time later, you’ve got your profit taking order. So, your trade was successful this time.
Chart #2 | Hourly EUR/USD
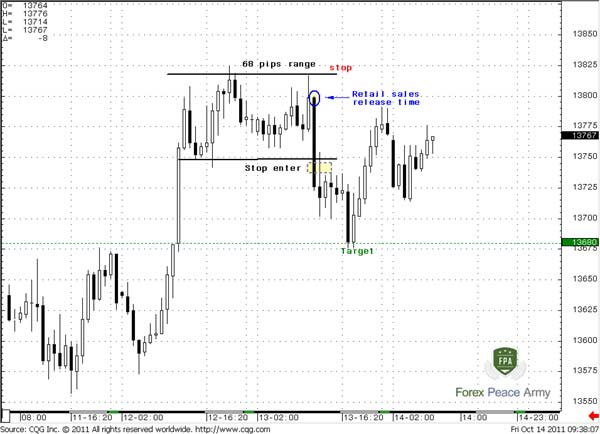
But major idea of that example is:If you plan to trade news directionally, you have to look deeper inside the numbers to understand the overall process and information for a particular report, not just compare it with consensus forecast. Otherwise, you may fall to very unpleasant trades.
Hopefully we have Peter O who can lead us through this process unharmed.
Occasional news trading
Commander in Pips: I hope you don’t mind that I’ve called that way of news trading with some sarcasm. Of course, this is not “occasional” trade, it’s intended one, but I call it like that just to appoint important moment that shows us the difference from a directional news trade. In this type of news trading we do not have any predefined view on news. We don’t care – will they show upward surprise or downward surprise. All that we are caring about is that they will show any surprise, and how large it will be – the larger surprise all the better. Our main task here is to pull the trigger in time and have detailed trading plan as for negative and for positive surprise in the data prior to release time.
Since surprise is greater with greater data type, say NFP, such kind of “important” data quite suitable to trade them in “occasion” mode – in most cases they will show significant surprise.
Pipruit: All right, all right – how to trade?
Commander in Pips: We will show you one of the possible ways and mention another one, but these strategies do not limit all possible ways of news trading. They are just applied more often than the others.
First strategy – two-side trading (spot straddle trading)
1. Look at price action just before the release time. Very often due to expectations of release, the market stands in the range. The tighter the range is - the stronger move could happen at breakout.
2. Place two stop entry orders on breakout in different directions with target equals the range width (classical approach) or some other way (extensions, harmonic patterns etc). You may apply the harmonic number for a particular currency. For EUR/USD this number is approximately 20 pips.
3. Place stop-loss order for buy entry 1 harmonic number lower than the upper border and for sell entry – 1 harmonic number higher than the lower border of the range.
If your broker allows you – you may place OCO orders, if not – manage them manually.
Ok, let’s say we’ve done all this stuff, and now at the eve of the most recent 7th of October NFP release. On chart #3 we see that some hours prior the release, the market stands in a 63 pips range. The upper border stands at 1.3458, the lower at 1.3395. So, we have to place our stop entry orders – one is above 1.3458, say at 1.3465-1.3470, and another one is below 1.3395 – at 1.3380. For each position we need to attach 1 harmonic number stop-loss order. So, for bullish positions, the stop loss will be at 1.3438, while for a bearish one it is at 1.3415. We will use here the classical approach to trading ranges – set target as the width of the range – 63 pips. Upward target will be at 1.3521 (63 pips), downward – 1.3332:
Chart #3 | 30-min EUR/USD
4. Wait news release moment:
Chart #4 | 30-min EUR/USD
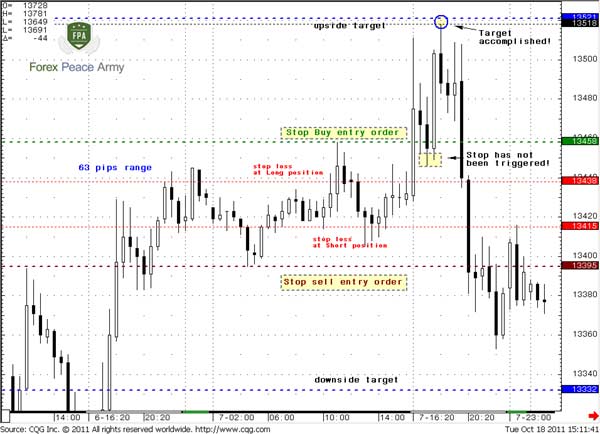
Ok, what do you see?Pipruit: Wow! Look’s like the strategy has worked perfectly. We’ve entered at stop buy around 1.3465-1.3470, then retracement has come, but it has not triggered our stop-loss order and the market has run right to our target. But, sir, it has not quite reached it for 3 pips…
Commander in Pips: You’re right. We can’t hit the bull eye every time. Still, if you apply our rule, that we’ve appointed earlier to place targets not at precise level but slightly ahead of it – then everything is OK.
By the way, do you know that this NFP was extremely bullish for USD? They have released more than 1.5 times better than expected…
Pipruit: And why in this case we see such a strong upward move on the EUR/USD?
Commander in Pips: See the followed plunge? This is real reaction to the NFP release. The upward move is a closing of bearish positions by large traders who has expected to see a bear surprise… But you have made your money particularly on that move. Now, probably you understand why I’ve called this way of news trading as “occasional” – you just do not need to understand the fundamentals of the move – you need to be in right place at right time. That’s all! That is what all this stuff is about!
Pipruit: I see… And what is the second strategy?
First scenario (most preferable):
Entry stop has been triggered, stop-loss remains untouched, target has been hit;
Second scenario – positive in general:
First Entry stop has been triggered but later you were stopped out. Luckily second entry has been triggered also and opposite target has been reached. Although you’ve caught stop-loss on the first trade, profit from the second one has let you to remain with some profit still. Hence this is a rule – always make advance calculations so, that potential profit was at least 2 times higher than the stop-loss.
Third scenario – totally negative:
I think you already understand about what I’m speaking – you have been stopped out twice at both legs, or at least once, but the second entry order has not been triggered, or target has not been achieved. Here is most negative scenario for you. Although it could let you to stand at breakeven or even with small profit (if, say, second trade has not achieved the target, but still show some profit), most times you will get loss.
This is very typical for unimportant news data or when surprise is quite shallow. That’s why, you may apply second strategy of unbiased news trading:
Second strategy – fast hands trading
The core of this trade is the same as for the first one – it’s still “occasional”. At the same time there is an important difference – you enter not prior but after the news release. The major task for you here is to assess surprise. The faster you will assess it – the more pips you will earn. Since you will know the direction of surprise – you also will know the direction of entering long or short. Here is just two preparations should be made before release:
1. The same work with target estimation;
2. Some (surprise level)/(potential move) ratios that will let you assess target properly. For instance, you may estimate how the market reacts on different value of surprises based on historical data. As a result you should have for every major data table like that – 10% surprise – 30 pips move; 20% - 50 pips; 30% - 65 pips; 50% or higher – 120 pips.
3. Then you have to calculate, potential values of, say NFP that will correspond to these surprises. This is necessary for fast reaction of real data. For example, let suppose, that consensus forecast for NFP is 80K. You now that 20% surprise is 96 K, 30% - 104K and 50% - 120K. So, if actual the NFP will release at 115K you will be able to quickly assess that the probable move will be at least 65 pips. If you will start to calculate right at release time – you will miss whole move. All numbers are occasional, just for illustration.
4. When you see actual numbers, you know in what direction to enter – just pull the trigger and track your position. Place a stop-loss order. Close the position when your profit will reach the number approximately that is in your surprise scale sheet.
Pipruit: Aha. But sir, if we will look at our charts #3 and #4, we see some confusing price action. You’ve said that actual NFP was 1.5 times better than expected, so this was a solid upward surprise. So we could count on downward move and should enter short. But the market has shown strong upward move…
Still when data has already come out you know the surprise direction and in most cases, despite on possible preliminary opposite move due position closing, the market will outwork this surprise. When to enter, how to enter – this is some kind of knowlege that comes from experience.
Also be extra careful, since during some US data there could be other countries releasing data that could skew the effect of a surprise from US. You have to take into consideration all aspects.
So, that is all about news trading – choose your position, son.
Comments
Table of Contents
- Introduction
- FOREX - What is it ?
- Why FOREX?
- The structure of the FOREX market
- Trading sessions
- Where does the money come from in FOREX?
- Different types of market analysis
- Chart types
- Support and Resistance
- Candlesticks – what are they?
- Mysterious Fibonacci
- Introduction to Moving Averages
- Bollinger Bands
- Leading and Lagging Indicators
- Basic chart patterns
- Pivot points – description and calculation
- Elliot Wave Theory
- Intro to Harmonic Patterns
- Divergence Intro
- Harmonic Approach to Recognizing a Trend Day
- Intro to Breakouts and Fakeouts
- Again about Fundamental Analysis
- Cross Pair – What the Beast is That?
- Multiple Time Frame Intro
- Market Sentiment and COT report
- Dealing with the News
- Let's Start with Carry
- Let’s Meet with Dollar Index
- Intermarket Analysis - Commodities
- Trading Plan Framework – Common Thoughts
- A Bit More About Personality
- Mechanical Trading System Intro
- Tracking Your Performance
- Risk Management Framework
- A Bit More About Leverage
- Why Do We Need Stop-Loss Orders?
- Scaling of Position
- Intramarket Correlations
- Some Talk About Brokers
- Forex Scam - Money Managers
- Graduation!