Part II. Buy or Sell?


Pipruit: Oh, this should be interesting.
Commander in Pips: I hope so. Although to analyze just a single chart is not simple work at all, we will try to go a bit further. Tell me, what you see on followed chart:
Chart #1 | EUR/USD 60-min and 7X5 DMA
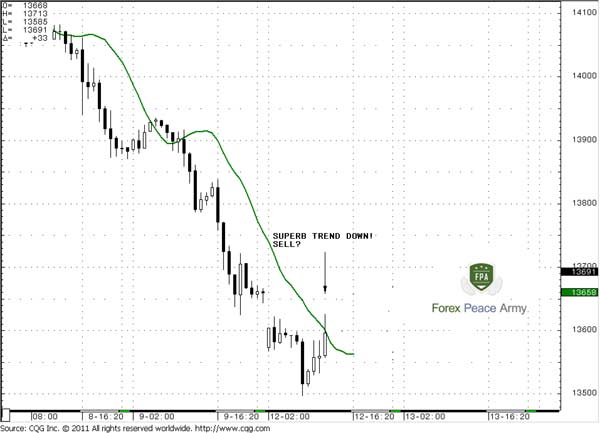
Let’s suppose that you’re hourly chart trader. Here is what you see as on chart #1. What kind of trade do you prefer in such environment?Pipruit: Well, I see an excellent thrust down, 7X5 holds trend very well. Now the market touches MA again, so, it’s time to sell, I suppose.
Chart #2 | EUR/USD 60-min and 7X5 DMA
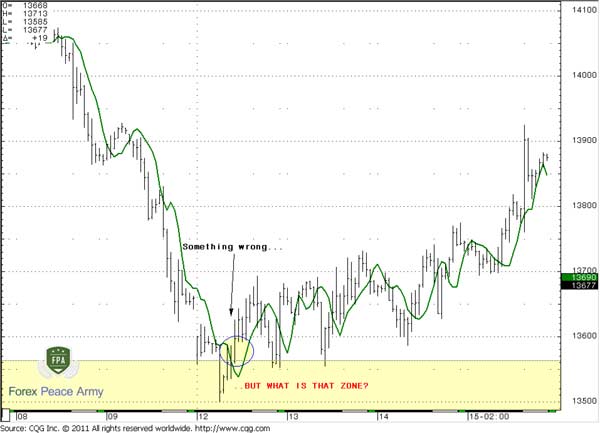
Pipruit: Hm. Curious. Looks like I’ve entered right at the moment of trend shifting. Well, this could happen sometimes. And what is that yellow zone that you’ve marked on the chart?
Commander in Pips: Well, yes, this could happen. But if you apply multiple time frames, you never enter short here. Here is why:
Chart #3 | EUR/USD Weekly
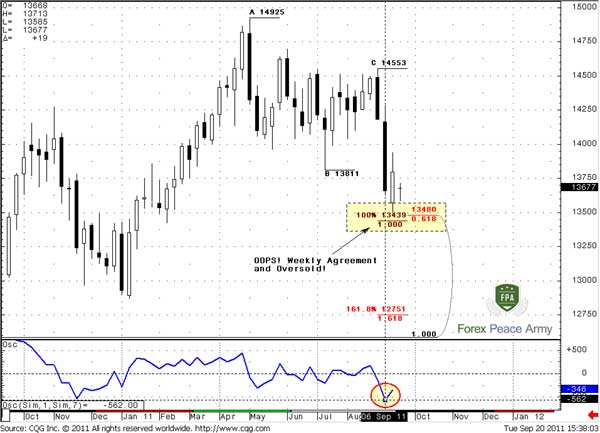
Market has reached Weekly Agreement support at weekly oversold – to enter short right here was suicide. After the has touched this level it has jumped up for about 400+ pips, because this was not just a deal of the daily chart but mostly weekly.
Market has reached Weekly Agreement support at weekly oversold – to enter short right here was suicide. After the has touched this level it has jumped up for about 400+ pips, because this was not just a deal of the daily chart but mostly weekly.
Pipruit: Wow. If I had seen the weekly chart, I hardly would enter short with such conditions – a better decision was to wait for a pullback…
Commander in Pips: That’s right. Although all trends were bearish, another part of our analysis is overbought/oversold analysis and Fib work. And they tell you, that you need to wait for some pullback. Since this “some” pullback is on weekly timeframe – you can see the measure of it. Impressive…
Here we’ve investigated the typical newbie’s mistake – to focus just on a single time frame. That’s why they are very often confused about why the market suddenly stops and reverses miserably in the other direction. As a rule this happens right after the moment of entering the trade.
Here we trying to save your money, so that this lesson will not appear to be too expensive to you, since you will understand it anyway (that you have to look at higher time frames) but it could cost to you much better without FPA advice.
Applying multiple time frames will save more money than any other tool of analysis. Also it will allow you to capture more profit, since you will know where you are in the big picture.
Example of multiple time frame application
Ok, now it’s time to show it in practice - how to make analysis using multiple time frame. This example will be a bit simple, because we have not passed other important material. At the end of our school, where we will study how to create a trading plan, there will be a more sophisticated example. Here we just want you to show the principle. After this example we will point out major rules, just to brush your brains, since you will have a lot of confusion when you will start to deal with multiple time frames. These rules will help you in this work. They are extremely important in applying multiple time frames.
So, let’s assume that you do not have a lot of time to trade and the hourly chart is most suitable for you, because the 4-hour or daily is too long and boring, while 5-min is too fast and you are under stress when you trade it (and can’t assess situation and make decisions in time). All that stuff you should get from demo trading, as we’ve discussed.
As a newbie trader you focus just on a single pair, say EUR/USD. Once, when you have finished all other businesses and finally are ready to dive in trading you’ve seen the following picture:
Chart #4 | EUR/USD 240-min
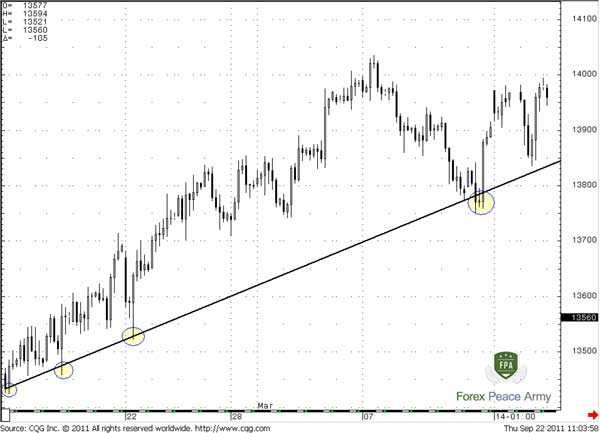
What decision you will make, looking at this chart?Pipruit: Well, probably what I should is to search for buying opportunity.
Commander in Pips: Right, you should not even try to enter short. Here is why we need higher time frame. It gives us overall context – should we search for buy trade, sell or stay flat. But not only for that, as you will see later.
The next step is to zoom into your preferable trading frame – 1 hour. Since the most common way to enter the market with an upward trend is to use the support of the trend line, you have to wait for when it will happen…
Pipruit: I would like to add some indicator. Personally, I like Stochastic, can we do that?
Commander in Pips: Of course you may, even you have to add what you are really need to. Here is your chart, so what you going to do?
Chart #5 | EUR/USD 60-min and Smoothed 8-3-3 Stochastic
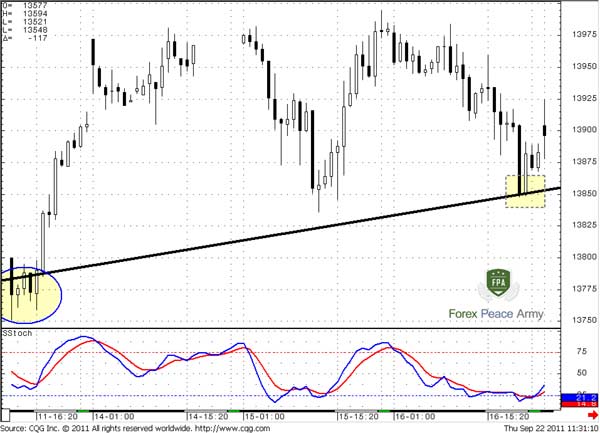
Pipruit: Well, it’s obvious that I could not catch the first touch of trend line, but I do not want it, since we’ve said that the more safe way to enter market is using of retracement. Also I see that stochastic gives Buy signal – lines have crossed in oversold zone and come out from there. That’s give me some confidence that probably I can enter long. So, my decision is try to enter long from some retracement of the current upward pullback. But looks like I need a smaller time frame chart for that…
Commander in Pips: Sure, here is your 15-min chart with MACD:
Commander in Pips: Ok let’s see what has happened….
Commander in Pips: Of course you may, even you have to add what you are really need to. Here is your chart, so what you going to do?
Chart #5 | EUR/USD 60-min and Smoothed 8-3-3 Stochastic
Pipruit: Well, it’s obvious that I could not catch the first touch of trend line, but I do not want it, since we’ve said that the more safe way to enter market is using of retracement. Also I see that stochastic gives Buy signal – lines have crossed in oversold zone and come out from there. That’s give me some confidence that probably I can enter long. So, my decision is try to enter long from some retracement of the current upward pullback. But looks like I need a smaller time frame chart for that…
Commander in Pips: Sure, here is your 15-min chart with MACD:
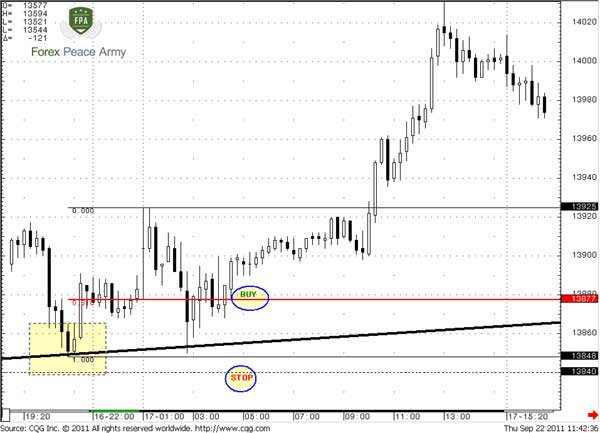
Chart #6 | EUR/USD 15-min and MACD
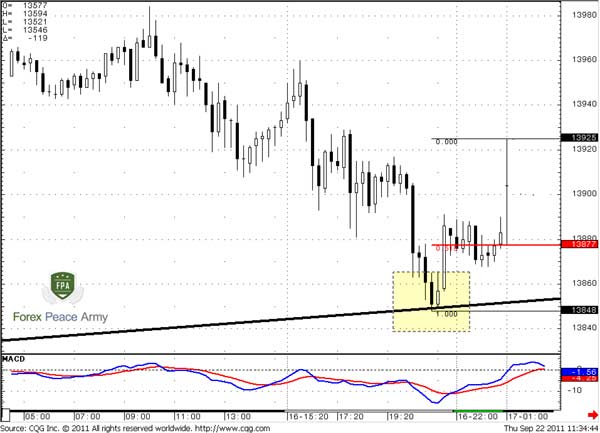
Pipruit: Oh, it’s a pity that I’ve skipped nice 0.382 retracement enter right after initial jump from the trend line. But still, I hope that the market will show another retracement and it should be deep, since the previous move down was solid in terms of the 15-min chart. Probably I will try to buy from 0.618 support and place my stop just below the lows – around 1.3840…
Pipruit: Oh, it’s a pity that I’ve skipped nice 0.382 retracement enter right after initial jump from the trend line. But still, I hope that the market will show another retracement and it should be deep, since the previous move down was solid in terms of the 15-min chart. Probably I will try to buy from 0.618 support and place my stop just below the lows – around 1.3840…
Commander in Pips: Ok let’s see what has happened….
Chart #7 | EUR/USD 15-min
Now in terms of 4-hour chart:Chart #8 | EUR/USD 240-min
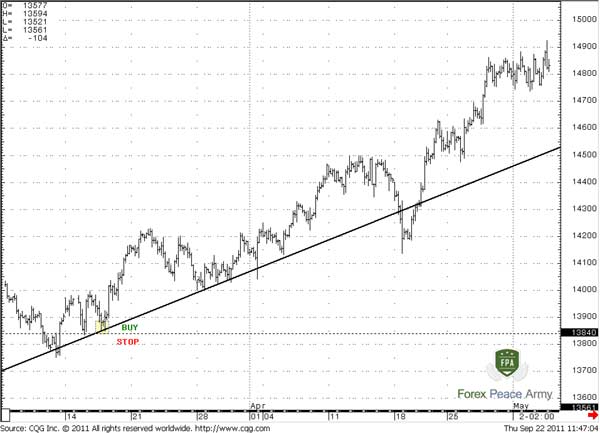
Pipruit: Cool! I think I’ve got it!
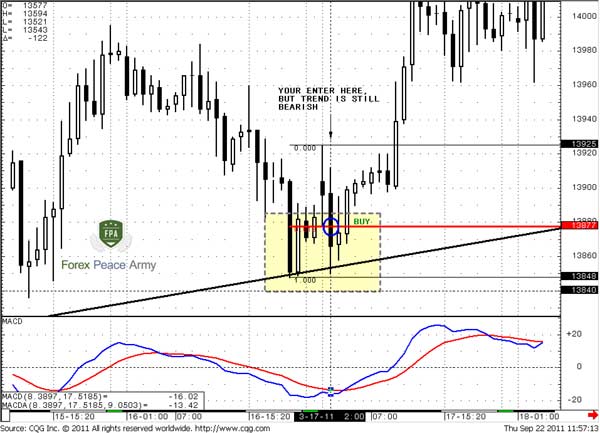
Commander in Pips: See? It’s not so difficult. The major thing here is to understand why we need 2 or better 3 time frames to trade, since each time frame has its own purpose in our overall strategy. Let’s appoint that purpose in major rules, but before that I want to show you a small nuance that you’ve missed when making that trade. It could allow you to enter with more safety. Pay attention to hourly chart #9 – this is your entry in terms of the 60-min chart. See, your enter a bit for luck, since the trend holds bearish when you’ve entered the trade. Yes, you have reasons to enter – support of trend line, initial pullback and Stochastic on the 4-hour time frame, but the hourly trend has not supported that. So, you probably had some hesitation about will trend line hold or not, or, maybe, will the market show some fake out and touch your stop or not.
Commander in Pips: But all the other stuff you did very well. Nice work. Now let’s shift to rules…
Commander in Pips: See? It’s not so difficult. The major thing here is to understand why we need 2 or better 3 time frames to trade, since each time frame has its own purpose in our overall strategy. Let’s appoint that purpose in major rules, but before that I want to show you a small nuance that you’ve missed when making that trade. It could allow you to enter with more safety. Pay attention to hourly chart #9 – this is your entry in terms of the 60-min chart. See, your enter a bit for luck, since the trend holds bearish when you’ve entered the trade. Yes, you have reasons to enter – support of trend line, initial pullback and Stochastic on the 4-hour time frame, but the hourly trend has not supported that. So, you probably had some hesitation about will trend line hold or not, or, maybe, will the market show some fake out and touch your stop or not.
Chart #9 | Your Enter at EUR/USD 60-min
To prevent that, I want to show you another way to enter, that I use. Pay attention to chart #10:Chart #10 | Preferable way to enter at EUR/USD 60-min
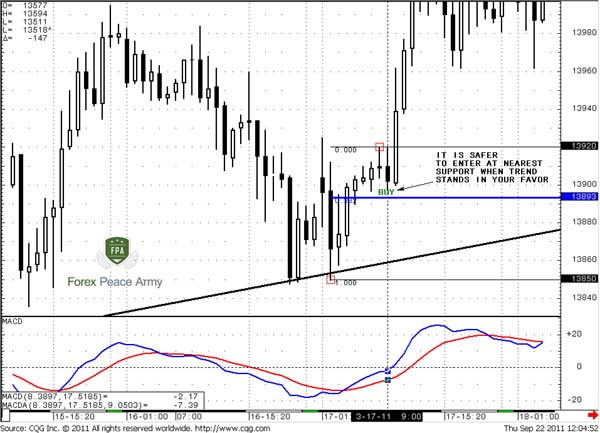
See – it’s safer to enter from nearest 0.382 Fib support when trend confirms your long trade. This eliminates any suspicions and indecision about fake outs or breakouts of trend line.
See – it’s safer to enter from nearest 0.382 Fib support when trend confirms your long trade. This eliminates any suspicions and indecision about fake outs or breakouts of trend line.
Pipruit: Thank you Sir for that valuable add-on. I will remember that.
Commander in Pips: But all the other stuff you did very well. Nice work. Now let’s shift to rules…
Comments
R
RJBSSFX
12 years ago,
Registered user
Hi Sive!
How to acquire the instruments that you are using .
Is there any way we could download it from any recommende free sites . It is a great help in getting trough the lessons if we have the same instruments as the teacher. Students will better grasp the knowledge .
Thanks
RJ
How to acquire the instruments that you are using .
Is there any way we could download it from any recommende free sites . It is a great help in getting trough the lessons if we have the same instruments as the teacher. Students will better grasp the knowledge .
Thanks
RJ

Sive Morten
12 years ago,
Registered user
> Hi Sive!
How to acquire the instruments that you are using .
Is there any way we could download it from any recommende free sites . It is a great help in getting trough the lessons if we have the s..
Hi RJ,
what particular instruments are you talking about? Some indicators exist in our course and you may download them, such as DOSC Indicator and 2-line MACD.
I
Irena
12 years ago,
Registered user
> See – it’s safer to enter from nearest 0.382 Fib support when trend confirms your long trade.
Sive - please confirm - this Fib support if from what move? Thanks!
Irena
Sive - please confirm - this Fib support if from what move? Thanks!
Irena
Sive Morten
12 years ago,
Registered user
Hi Irena,
right from initial move off trend line, that marked by small red squares.
right from initial move off trend line, that marked by small red squares.
D
dave edwards
12 years ago,
Registered user
Sive,
You are an excellent teacher. Many thanks for all the lessons thus far. a big thank you to the FPA as well!
Kind regards
dave edwards
You are an excellent teacher. Many thanks for all the lessons thus far. a big thank you to the FPA as well!
Kind regards
dave edwards
G
george mwangi
11 years ago,
Registered user
Greetings from Kenya Sive,
is it possible to get video tutorials ?
Regards
G.
is it possible to get video tutorials ?
Regards
G.
Sive Morten
11 years ago,
Registered user
> Greetings from Kenya Sive,
is it possible to get video tutorials ?
Regards
G.
Hi George,
If you're speaking about this educational course, well, ufortunately it does not assume any videos.
But, you can watch real daily video analysis. Here is an archive:
Sive's Analysis Archive
And new videos appear each day in my root thread.
O
One-fm
5 years ago,
Registered user
Thanks for this, Sive.
Table of Contents
- Introduction
- FOREX - What is it ?
- Why FOREX?
- The structure of the FOREX market
- Trading sessions
- Where does the money come from in FOREX?
- Different types of market analysis
- Chart types
- Support and Resistance
- Candlesticks – what are they?
- Mysterious Fibonacci
- Introduction to Moving Averages
- Bollinger Bands
- Leading and Lagging Indicators
- Basic chart patterns
- Pivot points – description and calculation
- Elliot Wave Theory
- Intro to Harmonic Patterns
- Divergence Intro
- Harmonic Approach to Recognizing a Trend Day
- Intro to Breakouts and Fakeouts
- Again about Fundamental Analysis
- Cross Pair – What the Beast is That?
- Multiple Time Frame Intro
- Market Sentiment and COT report
- Dealing with the News
- Let's Start with Carry
- Let’s Meet with Dollar Index
- Intermarket Analysis - Commodities
- Trading Plan Framework – Common Thoughts
- A Bit More About Personality
- Mechanical Trading System Intro
- Tracking Your Performance
- Risk Management Framework
- A Bit More About Leverage
- Why Do We Need Stop-Loss Orders?
- Scaling of Position
- Intramarket Correlations
- Some Talk About Brokers
- Forex Scam - Money Managers
- Graduation!