Part III. Some Rules and Advanced Talks

1. Don’t use more than 3 (preferably 1-lower and 1-higher) and no less than 2 (preferably and 1-higher) time frames constantly in your day to day trading.
- Monthly, Weekly, Daily;
- Weekly, Daily, Hourly;
- Weekly, Daily, 4-hour;
- Daily, hourly, 5-min or Daily, 4-hour, 30 min;
- 4-hour, 30-min, 5-min or 4-hour, 1-hour, 5-min;
- 30-min, 5-min, 1-min
Personally, my preferred composition is Daily, hourly and 5-15 min charts. So, let’s take a look what the purpose of different time frames in this selection:
For Daily-hourly-(5-15)-min selection:
3. All stuff at higher time frame is stronger than on the lower time frames – support, resistance, overbought, oversold etc…but simultaneously wider.
4. Despite whatever selection you trade – you have to look at monthly and weekly time frames. Ignore the trend, but pay attention to support/resistance levels, overbought/oversold and patterns;
5. The daily chart is the major chart for this selection, since it gives you the context – enter long, short or stay flat. Here is you have to pay attention to trend direction (buy or sell), support/resistance, overbought/oversold and patterns;
6. Hourly chart – your preferred time frame. Here you have to watch for the trend, but only as confirmation of entry levels, support/resistance levels, patterns and profit targets. Ignore oversold and overbought.
7. We use 5-15 min chart only for confirmation of particular entry points – ignore trend, support/resistance and oversold/overbought. Use patterns that confirm the entry point.
Advanced comments – trend compounding
Commander in Pips: If you have worked a bit with multiple time frames, you probably have some questions about trend estimation and combination. I mean how to combine MACD on Daily time frame and hourly time frame. We assume that we work at the sameDaily-hourly-5-15 minselection.
1. Our context and our trend is a daily trend indicator, let’s say MACD. It tells us where we want to go – Long or short. For simplicity let’s assume that we want just to ride the trend and no patterns are forming currently on the market. It is preferable, that the market stands in thrusting mode. Look at chart #1:
Chart #1 | EUR/USD Daily
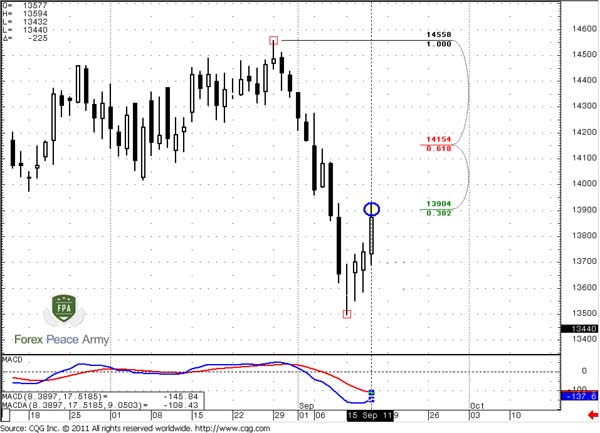
So we see all that we want from perfect move – market in thrusting down move, MACD shows bear trend, hence we want to enter short. Now market has reached Fib resistance and we want to estimate where we could jump in.2. For that purpose we use hourly chart:
Chart #2 | EUR/USD 60-min
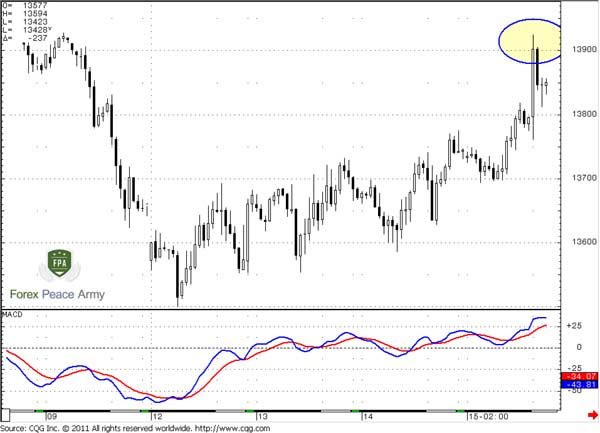
Here we see that MACD in Buy mode, but we know that market stands at resistance. Here we have to watch over two events. First, look at the daily trend that it will not turn bullish. In this case our context for short selling will vanish. Second is to watch over the hourly trend – when it will turn bearish, we can use the nearest hourly Fib resistance to enter short. Now, it’s still bullish. This is tells us that the market could show deeper retracement and currently is not the time yet to enter short.So, our task is to wait for when hourly trend will turn bearish, while the daily trend will hold bearish all the time:
So what do we have:
1. Your context is higher time frame. It tells us where to enter – long or short. If the market is in a thrusting move – this is much better.
2. You use your preferred time-frame trend to filter the entry points. If the hourly trend shows bullish trend, while daily shows bearish – you have to wait for a deeper up move to a deeper resistance level. The major issue here is that the daily trend has to not break up.
3. If the daily trend still holds, then the market has reached some resistance, and the hourly trend also turns south – this is a moment to enter. Wait for the nearest retracement on the hourly chart to enter short.
Here is how it works… But again – here we discuss purely riding the trend technique, and assume that the market is neither at oversold nor at overbought and no patterns take part in our trading – purely the trend.
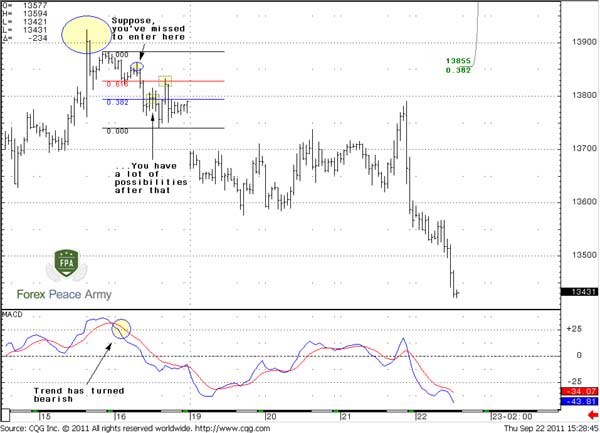
Chart #3 | EUR/USD 60-min
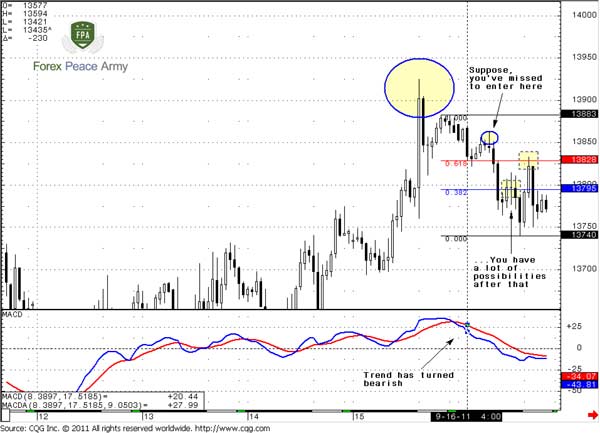
Ok, finally we’ve got that! The hourly trend has turned bearish. Let’s suppose that you’ve missed the entry right at nearest retracement after that has happened. If this is your case, then don’t be frustrated. Since both trends are bearish now, you may use nearest Fib resistance to enter short from the most recent swing. As you can see, later the market has gifted you with a 0.618 retracement. Let’s see what has happened after that… Look, the market just collapsed down. Where to exit and take profit is a very pleasant question after that, isn't it? You may apply any target – this is not the question of the current chapter.So what do we have:
1. Your context is higher time frame. It tells us where to enter – long or short. If the market is in a thrusting move – this is much better.
2. You use your preferred time-frame trend to filter the entry points. If the hourly trend shows bullish trend, while daily shows bearish – you have to wait for a deeper up move to a deeper resistance level. The major issue here is that the daily trend has to not break up.
3. If the daily trend still holds, then the market has reached some resistance, and the hourly trend also turns south – this is a moment to enter. Wait for the nearest retracement on the hourly chart to enter short.
Here is how it works… But again – here we discuss purely riding the trend technique, and assume that the market is neither at oversold nor at overbought and no patterns take part in our trading – purely the trend.
Chart #4 | EUR/USD 60-min
Comments
M
mmtto
12 years ago,
Registered user
Hi Sive,
Thank you for the lesson.
I have a question regarding the patterns that you use on 5-15min chart for confirmation of entry point. Do these patterns include candlestick patterns?
Thank you.
Thank you for the lesson.
I have a question regarding the patterns that you use on 5-15min chart for confirmation of entry point. Do these patterns include candlestick patterns?
Thank you.

Sive Morten
12 years ago,
Registered user
> Hi Sive,
Thank you for the lesson.
I have a question regarding the patterns that you use on 5-15min chart for confirmation of entry point. Do these patterns include candlestick patterns?
Thank ..
Hi mmttoo
In this chapter we mostly speak about how to combine opposite trends on different TF. Could you please specify a bit more where particularly I'm speaking about patterns here, just for my better understanding and to give you precise answer.
If you're asking in general then yes, they could be candlesticks, classical (like H&S for instance), harmonic patterns, specific as DiNapoli directional patterns. Using patterns shifts entry technique on different way, since you will need to wait trend shifting in your favor. Also you will place stop differently, compares to stops that you could place based purely on trend.
M
mmtto
12 years ago,
Registered user
Hi Sive,
Thank you for the reply.
I was referring to your explanation on the rules regarding multiple timeframe trading.
Quote: “7. We use 5-15 min chart only for confirmation of particular entry points – ignore trend, support/resistance and oversold/overbought. Use patterns that confirm the entry point.”
Do you consider candlestick patterns on 5-15min timeframe to be reliable signals for confirmation of entry point?
Thank you.
R
ron777
12 years ago,
Registered user
Optimal sessions preferred?
Quote: Hi Sive,
This is great information. Question: is it best to consider a trade off the 1 hour time frame in any session; or London/ NY?
Quote: Hi Sive,
This is great information. Question: is it best to consider a trade off the 1 hour time frame in any session; or London/ NY?
Sive Morten
12 years ago,
Registered user
> Hi Sive,
Thank you for the reply.
I was referring to your explanation on the rules regarding multiple timeframe trading.
Quote: “7. We use 5-15 min chart only for confirmation of particular ent..
Oh, I see... Personally, I prefer harmonic patterns as butterflies, 3-Drives etc, classical reversal patterns and DiNapoli Directional patterns.
The reason for that is 5-15 charts are rather noisy and apply there just candlestick patterns could lead to multiple failures. I prefer some more extended patterns.
One pattern, that could be also treated as candlestick (engulfing) is Wash&Rinse that is very usefull on this time frames. If you do not know about it - read chapter about classical support and resistance lines.
> Quote Hi Sive,
This is great information. Question: is it best to consider a trade off the 1 hour time frame in any session; or London/ NY?
Session overlapping is a great time through the day, but you can't trade always during this time, if you live, say, in Japan. So, applying of this framework is possible during any time through the day at any liquid market. Overlapping time could possibly give a bit more possibilities, since market is more active.
M
mmtto
12 years ago,
Registered user
Noted with appreciation.
P
pragmatic
11 years ago,
Registered user
Hello Sive!
I am trying to place my savings on the right currency and I find that the knowledge you disseminated here is invaluable. Maybe you have some suggestions for me.
Due to the (un)fortunate fact that I live in Romania, I make RON. The interest is about 5.5, so pretty good. The bonds are 5.5 also and RON is much appreciated these days. I want to sit on RON as much as USDRON declines. The moment of turn around might be close. So here is the problem:
Because I am talking about unleveraged savings, I am looking at Monthly TF. I have as Monthly Confluence Support as Monthly Oversold approaching. Also, there is 25x5 crossing point in that same area. Pretty strong, isnt it?
Weekly TF shows nice harmonic ABCD right below that strong area (few pips). ABCD is not ideal because BC is just 38.2 retracement.
I dont know when to buy. I dont have the chance to move stops because the bank has huge spread, so my only chance is good, solid turn around of trend.
What shall I look for: M trend Bulish or Weekly trend Bulish. Or shall I look for reversing paterns on Weekly?
I will try to attach chart.
Thank you very much!
https://www.forexpeacearmy.com/community/attachments/doc835-pdf.8027/
https://www.forexpeacearmy.com/community/attachments/doc836-pdf.8028/
Sive Morten
11 years ago,
Registered user
Hi Pragmatic,
I'm not pretending on absolute opinion, but at my look - probably makes sense to wait when market will hit 3.2-3.25 area. Here is monthly oversold at K-support and Agreement with weekly AB=CD + 25x5 support and previous swing high. Nice chances that there some pullback could follow.
That could be weekly B&B or DRPO from this area... But how strong and far this pullback will be - difficult to say.
S
SteogForex
8 years ago,
Registered user
Hi Sive,
Thanks for the lessons.
Please since you are using 60M TF for your entry I assume you will exit the trade same day unless you set your exit point when you are entering the trade. But assuming this is not what you are doing; how do you decide when to exit a trade? I am having problems with exit, most of the time I turn profitable trades to losses.
Stephen
O
One-fm
5 years ago,
Registered user
Great job
Table of Contents
- Introduction
- FOREX - What is it ?
- Why FOREX?
- The structure of the FOREX market
- Trading sessions
- Where does the money come from in FOREX?
- Different types of market analysis
- Chart types
- Support and Resistance
- Candlesticks – what are they?
- Mysterious Fibonacci
- Introduction to Moving Averages
- Bollinger Bands
- Leading and Lagging Indicators
- Basic chart patterns
- Pivot points – description and calculation
- Elliot Wave Theory
- Intro to Harmonic Patterns
- Divergence Intro
- Harmonic Approach to Recognizing a Trend Day
- Intro to Breakouts and Fakeouts
- Again about Fundamental Analysis
- Cross Pair – What the Beast is That?
- Multiple Time Frame Intro
- Market Sentiment and COT report
- Dealing with the News
- Let's Start with Carry
- Let’s Meet with Dollar Index
- Intermarket Analysis - Commodities
- Trading Plan Framework – Common Thoughts
- A Bit More About Personality
- Mechanical Trading System Intro
- Tracking Your Performance
- Risk Management Framework
- A Bit More About Leverage
- Why Do We Need Stop-Loss Orders?
- Scaling of Position
- Intramarket Correlations
- Some Talk About Brokers
- Forex Scam - Money Managers
- Graduation!