Part II. Technical analysis

Commander in Pips: Today we will turn to technical analysis in general without any particular things – just discuss what technical analysis is, and what basis does it stand upon.
Although you’ve previously said that you “heard that technical analysis is a simplest amongst all types of analysis” I do not agree with you. The point is that technical analysis includes so many different subtypes that you can’t even imagine how many kinds there are. And to investigate all of them, to check them in real practice, to use them freely and easily with a high level of efficiency – it’s very difficult. But, you’re right in one thing – each subtype of technical analysis demands less time for understanding and application than, for instance, fundamental analysis. But each subtype is very different from the other ones and the major problem here is to find the type that is will be absolutely suitable for you personally. And that could demand as much time as study fundamental analysis, for example.
Pipruit: Thanks, Sir. I think that I have to remember that.
Commander in Pips: That is a good decision, Son. Now let’s talk about the foundation of technical analysis.
Traders who dedicate themselves to technical analysis most part of time deal with price movements. The major reason for that is that technical analysis suggests that historical price movement allows you to determine potential price action. Here we can extract major basics of technical analysis:
1. Analyzing the historical price movements and taking into consideration the current trading environment allows determine potential price action. Here is an old phrase that comes to mind - that history has a tendency to repeat itself again and again. In fact all this is about the subject of technical analysis. If price has shown some areas that it couldn’t break for significant period of time to the upside (resistance) or to the downside (support) – traders will surely note that and adjust their trading strategy based on this information. Technical analysis studies not only particular levels, but some historical price movement patterns, and technical traders and analysts believe that these patterns will repeat in the future and price will behave in the same way. Traders create their trading ideas that are based on the concept of repeating of these price patterns.
Here is an example of a NZD/USD chart – look, how the 0.4857 area has acted since 1998
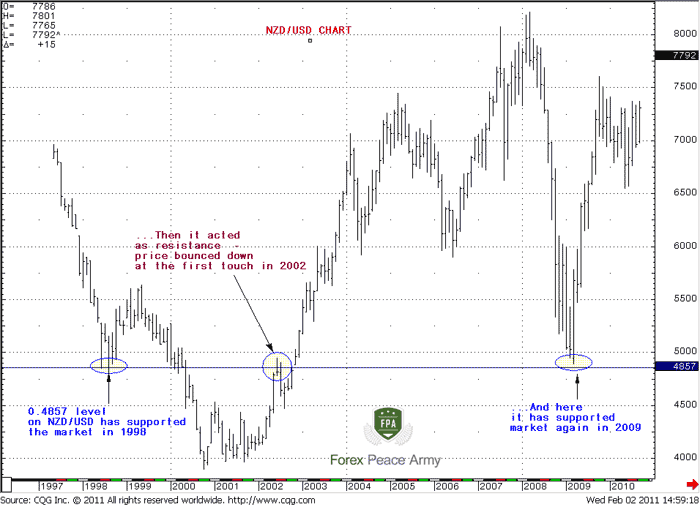
2. Current price includes all information that exists on the market right in the current moment of time. Here you have to understand that with this statement we do not want to say that this is really so, we just talk about qualities and basics of technical analysis. Where does this statement lead us? Well, if price includes all available and possible information about an asset (in our case this is some currency rate), then all that we need to make a decision about trade is the current price behavior.
3. There is a suspicion that technical analysis has a tendency to be a self-fulfilling prophesy. Just imagine that you see some well-recognizable pattern, and everybody else sees it. So, if many-many traders will open the same position due to this pattern, then the price will really move according to this pattern. That is a self-fulfilling event. But it’s worth saying here, that currently there are a lot of technical strategies that exist on the market and some of them are particularly sophisticated to apply, so, this statement is just partially true. Besides, it will be useful for you to know this extremely important market rule: If something on the market is obvious – this is obviously wrong. Remember when we talked about “Easy money” in a previous chapter. Let me explain this statement a bit. If everybody sees some reversal pattern on the market, you should understand that market-makers and the largest traders also see it, and they see in advance where the public will place stops and how it intends to act due to this pattern. Do you really think that they will not use it to rob you? You do? Well it’s very naive. That’s why some classical patterns that had worked perfectly in the 60s and 70s now fail more often than they work. There is a limited amount of money on the market and majority should stay in loss but minority in profit. That is the law, otherwise, the markets will just stop to function.
4. Technical analysis is generally associated with price charts. Partially, because historical and current price action is much easier to observe in charts than in numbers. Besides, technical analysis actively applies different indicators that are derived from and linked with price level. So, to see some levels that market couldn’t break, patterns and indicators are much easier with charts, rather than with any other way.
5. Results and decisions that could be made with technical analysis are very subjective. Let’s assume that all our pipruits have the same degree of knowledge of technical analysis. Now, if we ask them to analyze some chart and tell us the decision – buy or sell, you’ll see very different conclusions about that. Although there are quantitative methods of technical analysis that exist also.
6. Although technical analysis has many different subtypes and methods, there are still some general concepts exist, such as classical analysis, wave theory, Fibonacci numbers application to markets and large number of indicators (moving averages, stochastic, etc). Almost all subtypes of technical analysis are based on single or several general concepts.
Pipruit: Cool. But now I think that Technical analysis is not as easy as I’ve thought before. Better me start with fundamental analysis, I think.
Commander in Pips: Oh, don’t worry. It doesn't matter which is better to start with, because you will pass through all of them, and you will have to study hard to know all three types. Ha ha!
Pipruit: Thanks for pepping me up, Sir.
Comments

Hamza Samiullah
7 years ago,
Registered user
Well detailed elaboration...
Table of Contents
- Introduction
- FOREX - What is it ?
- Why FOREX?
- The structure of the FOREX market
- Trading sessions
- Where does the money come from in FOREX?
- Different types of market analysis
- Chart types
- Support and Resistance
- Candlesticks – what are they?
- Mysterious Fibonacci
- Introduction to Moving Averages
- Bollinger Bands
- Leading and Lagging Indicators
- Basic chart patterns
- Pivot points – description and calculation
- Elliot Wave Theory
- Intro to Harmonic Patterns
- Divergence Intro
- Harmonic Approach to Recognizing a Trend Day
- Intro to Breakouts and Fakeouts
- Again about Fundamental Analysis
- Cross Pair – What the Beast is That?
- Multiple Time Frame Intro
- Market Sentiment and COT report
- Dealing with the News
- Let's Start with Carry
- Let’s Meet with Dollar Index
- Intermarket Analysis - Commodities
- Trading Plan Framework – Common Thoughts
- A Bit More About Personality
- Mechanical Trading System Intro
- Tracking Your Performance
- Risk Management Framework
- A Bit More About Leverage
- Why Do We Need Stop-Loss Orders?
- Scaling of Position
- Intramarket Correlations
- Some Talk About Brokers
- Forex Scam - Money Managers
- Graduation!