Part III. Advanced talks on Fibonacci Retracement


Pipruit: Well, this is simple:
Pipruit: Because in the rule of estimation of swing high in previous part you’ve said – “we will treat as swing high a candlestick/bar that has at least two lower highs on both sides of itself – from left and from right.”
Commander in Pips: That’s correct. I like that you’ve remembered that, but why is this point does not suitable for you as X?
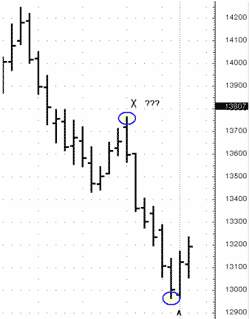
Pipruit: Well, because we’ve said, that in down thrust “X” point should be the highest level and “A” will always be the lowest one and it has to stand later in time than X point – be to the right side from X on the chart.…
Commander in Pips: You’re wrong…partially. You’ve said all correct about “A” point – it indeed will always be the lowest price in a down thrust. But you’re absolutely wrong about X-point. I never told that it should be the highest level – read carefully again: …swing high a candlestick/bar that has at least two lower highs on both sides of itself – from left and from right
Pipruit: You’re right, Commander, so which one is correct?
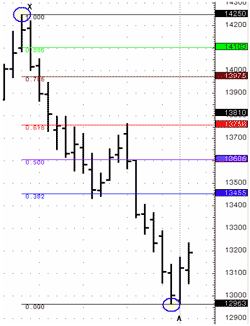
Commander in Pips: Both. But to understand why it so important, lets use for the moment just the major levels – 0.382 and 0.618. Now I ask you to draw Fibonacci retracement as from yours X point as from mine one and let’s see what will occur…
Commander in Pips: Since, as we’ve said A-point should be the lowest one - there couldn’t be two lowest levels. It means that A point will be the same for both X points. Let’s name them “Xp” (X Pipruit) and “Xc” (X Commander).
Commander in Pips: Let’s see… Hm, looks nice, I also add just a single notification for you, to avoid some confusion about A point. So, what do you see here, something special…?
Commander in Pips: Let’s see… Hm, looks nice, I also add just a single notification for you, to avoid some confusion about A point. So, what do you see here, something special…?
Commander in Pips: Right. This method was invented by Joe DiNapoli and he calls such coincidence as “Confluence area”. In our case this is Confluence resistance, but if it will build from up thrust, then it will be Confluence support.
Commander in Pips: Because it creates an area that is much stronger than just a single level.
Commander in Pips: Well, Confluence definitely could not appear from the same levels – such as 0.382-0.382, or 0.5- 0.5 etc… Although I suspect, that Confluence of 0.5-0.786 levels could create stronger support that single level, DiNapoli does not clarify any other combinations as Confluence – only 0.382-0.618 combination is treated as Confluence.
Commander in Pips: Both. But to understand why it so important, lets use for the moment just the major levels – 0.382 and 0.618. Now I ask you to draw Fibonacci retracement as from yours X point as from mine one and let’s see what will occur…
Pipruit: And what level should I use as A point?
Commander in Pips: Since, as we’ve said A-point should be the lowest one - there couldn’t be two lowest levels. It means that A point will be the same for both X points. Let’s name them “Xp” (X Pipruit) and “Xc” (X Commander).
Pipruit: Ok, I’m done:
Pipruit: Well, I see that 0.618 level from your Xc point and 0.382 from mine Xp almost coincide at the same level.
Commander in Pips: Right. This method was invented by Joe DiNapoli and he calls such coincidence as “Confluence area”. In our case this is Confluence resistance, but if it will build from up thrust, then it will be Confluence support.
Pipruit: And why is it so big deal about it?
Commander in Pips: Because it creates an area that is much stronger than just a single level.
Pipruit: And could Confluence be created by, say, matching of 0.382-0.382 levels, 0.382-0.50, 0.618-0.5 and others combinations from different X points?
Commander in Pips: Well, Confluence definitely could not appear from the same levels – such as 0.382-0.382, or 0.5- 0.5 etc… Although I suspect, that Confluence of 0.5-0.786 levels could create stronger support that single level, DiNapoli does not clarify any other combinations as Confluence – only 0.382-0.618 combination is treated as Confluence.
Pipruit: And how close 0.382 and 0.618 level have to be to each other? Do they have to match pips to pips?
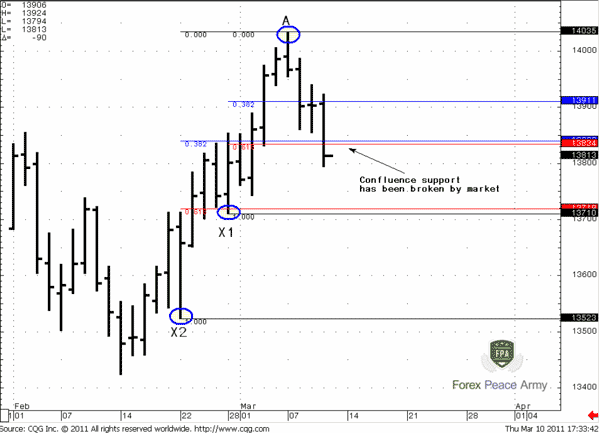
Commander in Pips: Well they could, but this is very rare case. They should be with relatively tight difference to each other. But this will depend on time frame – what will be tight in terms of monthly time frame – could be very wide in terms on 60-min time frame. So here is example of Confluence support now:
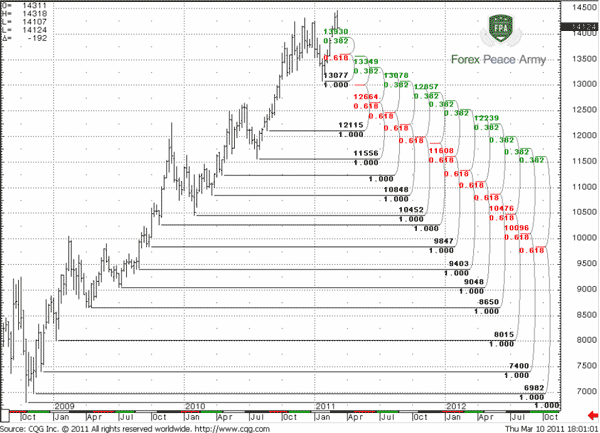
Commander in Pips: You’re right. But if we will draw all levels from our 4 X points, this will be very messy picture. I will draw them with applying Joe DiNapoli software, that allows clearly see all X point and levels:
Commander in Pips: And this is just a half of the thrust! But it does not mean that you always have to draw all levels.
Commander in Pips: You don’t need all the levels at once. You should take into consideration only those that could impact your potential trade. But you have to start from monthly or even quarterly chart, just to understand where you are in a big picture and could any high time frame Fibonacci levels influence on your potential position.
Commander in Pips: Well they could, but this is very rare case. They should be with relatively tight difference to each other. But this will depend on time frame – what will be tight in terms of monthly time frame – could be very wide in terms on 60-min time frame. So here is example of Confluence support now:
Chart #1 EUR/USD daily – Confluence support has been broken by price action
Pipruit: Cool. But Commander, here I see at least two more potential points that could be used as X… Is it normal? How many X points could be at all?
Chart #2 0.382 and 0.618 Fibonacci levels by DiNapoli software markings (DiNapoli Levels)
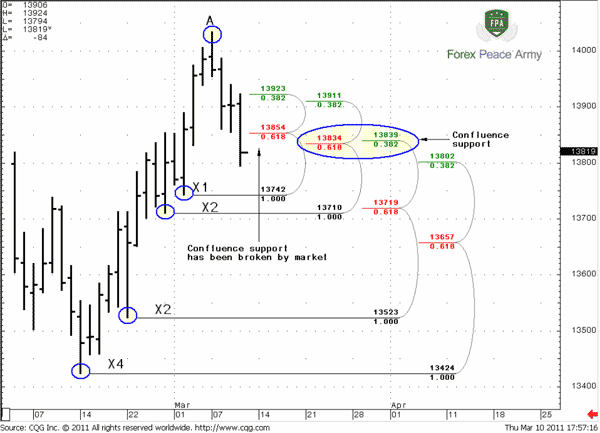
Pipruit: Commander – you’ve scared me. Very-very much!Commander in Pips: And this is just a half of the thrust! But it does not mean that you always have to draw all levels.
Pipruit: So, how we should apply it then?
Commander in Pips: You don’t need all the levels at once. You should take into consideration only those that could impact your potential trade. But you have to start from monthly or even quarterly chart, just to understand where you are in a big picture and could any high time frame Fibonacci levels influence on your potential position.
Pipruit: I see.
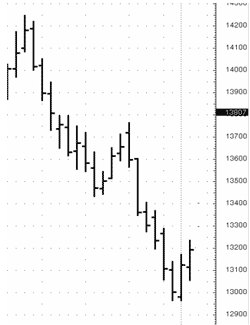
Commander in Pips: Now let’s continue further. Here we will study some theoretical examples that will help you clearly understand how to correctly obtain advanced Fibonacci retracement levels. Show me X and A points here:
Commander in Pips: That’s right, and now here:
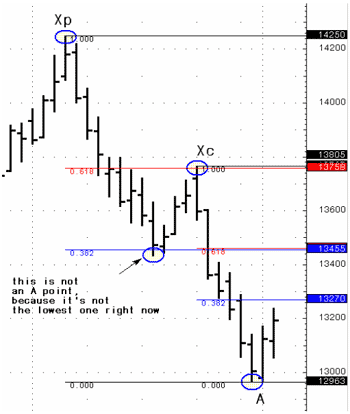
Commander in Pips: Well, your answer is correct, but not fully. Here is the correct answer, and you tell me, why is it correct:
Commander in Pips: Ok, I’ll help you a bit. First of all, I suppose that it’s all clear about your X and A points, right? So, tell me why I’ve marked X’ point and not X1
Commander in Pips: Definitely. So, as we have X’ point, we should have an “A” point for it also…
Commander in Pips: You understand right.
Commander in Pips: Well, in this case for both X points there will be only single highest “A” point, that will stand to the right from them and we will return to situation, that we’ve just discussed:
Commander in Pips: As you wish:
Commander in Pips: And why is A and X’2 at top?
Commander in Pips: And why is A and X’2 at top?
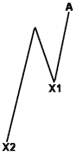
Commander in Pips: Now let’s continue further. Here we will study some theoretical examples that will help you clearly understand how to correctly obtain advanced Fibonacci retracement levels. Show me X and A points here:
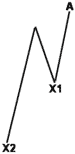
Pipruit: Hm, it doesn’t look difficult – almost the same, just in other way. Well, the first X2 point will be the initial low – that’s obvious, the second X1 point will be a bit higher. “A” point should be the highest price to the right from X2 and X1 – this should be the highest price of this pattern. Well, I think it will look as follows:
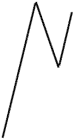
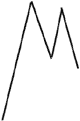
Commander in Pips: That’s right, and now here:
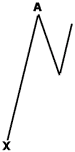
Pipruit: Well, X point will be initial low again. “A” should be highest point to the right. The most recent price is lower than previous high, so, this is not the “A” point for our “X”. I think something like that:
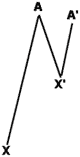
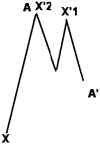
Commander in Pips: Well, your answer is correct, but not fully. Here is the correct answer, and you tell me, why is it correct:
Pipruit: Well, I don’t know, it looks difficult
Commander in Pips: Ok, I’ll help you a bit. First of all, I suppose that it’s all clear about your X and A points, right? So, tell me why I’ve marked X’ point and not X1
Pipruit: Well, because we have to have the same “A” point to mark X’s as X1, X2 and etc. They have to link with the same “A” point. But here A point stands to the left from X’, so it’s not correct (it should be the highest price to the right, i.e. later in time) and “A” point couldn’t be used for building retracement. But still, X’ point corresponds with conditions – “…swing low a candlestick/bar that has at least two higher lows on both sides of itself – from left and from right
Commander in Pips: Definitely. So, as we have X’ point, we should have an “A” point for it also…
Pipruit: Right, and the only point that is suitable for it is A’. I think I understand it. So, we have two different swings here – X-A, and X’-A’. If we assume that this is daily time frame, then, I probably will use X’-A’ if I’m intraday trader…
Commander in Pips: You understand right.
Pipruit: But Commander, and if after some time price will move higher, and A’ move above A?
Commander in Pips: Well, in this case for both X points there will be only single highest “A” point, that will stand to the right from them and we will return to situation, that we’ve just discussed:
Pipruit: Cool! And do you have some more tasks with that?
Commander in Pips: As you wish:
Pipruit: Well, I see the same swing X-A, that we’ve already discussed and some downside move. Well, if we will treat it as downswing, then we will get the following picture:
Pipruit: Well, A is A-point for X – initial swing up. And X’2 is first X point for swing down X’-A’. X’1 is the second point. It comes that previous A-point could simultaneously be an initial X point for smaller down thrust. At least all these markings correspond to the rules that you’ve given…
Commander in Pips: Don’t be afraid - you‘ve done well. I suppose these will be the last ones:
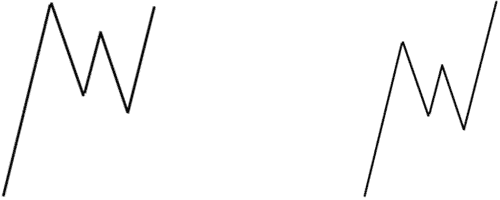
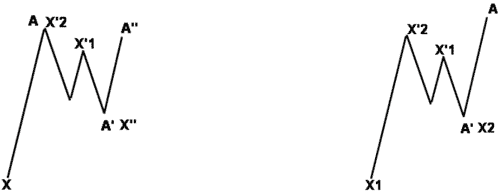
Commander in Pips: Very well, but don’t you see something, say, “unnatural” in these markings? Although you’ve marked them correctly, there are some needless things. Personally, I’ve marked them as follows:
Commander in Pips: Very well, but don’t you see something, say, “unnatural” in these markings? Although you’ve marked them correctly, there are some needless things. Personally, I’ve marked them as follows:
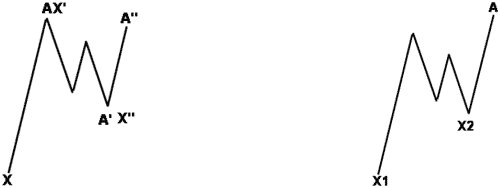
Commander in Pips: Absolutely, because all retracement levels that could be obtained from them, have been already broken by price action. Look – on the left picture – I’ve erased X’1-A’ swing, because X’’-A’’ move totally broke all possible levels of X’1-A’. So the same with the right picture – X2-A swing totally erased all possible levels from X’2-A’ swing. So what for overload our chart with needless details? We should look only at those swings levels from which are still valid and could influence at our potential position. For instance, take a look at left picture again – I’ve remained intact X’-A’. Why?
Commander in Pips: Definitely.
And the last one here – there could be hidden “X” points that are not correspond with our rule. But, nevertheless, they should be applied. With details you can read about it in DiNapoli’s book. Here we can only say that they are low or high of the thrusting bar (or some thrusting move) and gaps.
Also take a note, that the importance of different “X” points will be also different. The “X” points of thrusting moves are more important, than “X” points from consolidations. The more important the “X” point – the stronger Fibonacci levels obtained from it.
Commander in Pips: Don’t be afraid - you‘ve done well. I suppose these will be the last ones:
Pipruit: Ok, let’s see:
Pipruit: Hm, I see that you’ve just erased some markings, so you do not take these swings into account?
Commander in Pips: Absolutely, because all retracement levels that could be obtained from them, have been already broken by price action. Look – on the left picture – I’ve erased X’1-A’ swing, because X’’-A’’ move totally broke all possible levels of X’1-A’. So the same with the right picture – X2-A swing totally erased all possible levels from X’2-A’ swing. So what for overload our chart with needless details? We should look only at those swings levels from which are still valid and could influence at our potential position. For instance, take a look at left picture again – I’ve remained intact X’-A’. Why?
Pipruit: May be because A’’ point is a bit lower than X’ and some deep retracement levels 0.786 or 0.886 from X’-A’ swing are still valid and could lead to resistance?
Commander in Pips: Definitely.
And the last one here – there could be hidden “X” points that are not correspond with our rule. But, nevertheless, they should be applied. With details you can read about it in DiNapoli’s book. Here we can only say that they are low or high of the thrusting bar (or some thrusting move) and gaps.
Also take a note, that the importance of different “X” points will be also different. The “X” points of thrusting moves are more important, than “X” points from consolidations. The more important the “X” point – the stronger Fibonacci levels obtained from it.
Comments
F
FOREXHAWK
12 years ago,
Registered user
queery concerning lesson chapter 10 part 3
Hi Sieve
Cant praise you enough for the excellent Forex course. May I raise two questions please
In Chapter 10Part 3 chart 1 eur/usd daily
Point X2 does not appear to have 2higher lows on the left side Why is this shown as a swing low X point.
Point X1 shows lower highs on 2 bars at each side of swing low X1 could you explain this please.
in the next chapter chapter 10 Part 3 using Joe Dinapolis software the third point is marked as 1.3523/1000 X2 should this be X3 or have i missed something
I am mindful of the hard work you have put into this course and do not wish to find fault in the event of an error, but merely wish to be sure I have understood thew material correctly. I think your brilliant top notch.

Sive Morten
12 years ago,
Registered user
> Hi Sieve
Cant praise you enough for the excellent Forex course. May I raise two questions please
In Chapter 10Part 3 chart 1 eur/usd daily
Point X2 does not appear to have 2higher lows on the ..
Hi,
Concerning X2 and X3 - you're right, that's just a typo, thankfully not a crucial...
Swing low does not have to own 2 higher lows from the each side, but just one higher low from the left and one higher low from the right - that is exist here.
But since you've decided, that it should be two lows from each sides of swing low - may be I've written something wrong somewhere?
E
ertore
12 years ago,
Registered user
Excellent explanation about advance Dinapoli retracement levels. Thanks Sive for this could explanation.
S
stywny
12 years ago,
Registered user
Fibo
Hi All,
Sive, thank you for great tutorial.
Have fast coded, inspired by this lesson, primitive fibo indi for MT4, which I'm sharing. Is always better as ploting fibos one by one - here are 8 in 1 ;-)
Best.
Hi All,
Sive, thank you for great tutorial.
Have fast coded, inspired by this lesson, primitive fibo indi for MT4, which I'm sharing. Is always better as ploting fibos one by one - here are 8 in 1 ;-)
Best.

Soji4x
12 years ago,
Registered user
Fib retracement is da bomb!
I scrolled back to read this lesson on Fibonacci retracement 2 days ago, and i sat wit my trade paltform to apply it yesterday.. i ended up raking in profits upon profits (trading mainly the GBP/USD on a 1-hr chart). :D
Closed Transactions:
Ticket Open Time Type Lots Item Price S / L T / P Close Time Price Commission R/O Swap Trade P/L
1212675198 2011.09.22 11:12 sell 0.02 gbpusd 1.54579 1.54150 1.54000 2011.09.22 12:27 1.54150 0.00 0.00 8.58
1212679821 2011.09.22 12:15 sell 0.04 gbpusd 1.54110 1.54600 1.53800 2011.09.22 15:33 1.53800 0.00 0.00 12.40
1212681276 2011.09.22 12:29 sell 0.02 gbpusd 1.54225 1.54600 1.54020 2011.09.22 14:20 1.54020 0.00 0.00 4.10
1212681842 2011.09.22 14:20 sell 0.02 gbpusd 1.53980 1.54400 1.53700 2011.09.22 15:34 1.53700 0.00 0.00 5.60
1212684241 2011.09.22 13:14 sell 0.02 eurusd 1.34578 0.00000 1.34420 2011.09.22 13:40 1.34420 0.00 0.00 3.16
1212689540 2011.09.22 14:35 sell 0.02 eurusd 1.34565 1.35070 1.33920 2011.09.22 15:56 1.33920 0.00 0.00 12.90
1212689660 2011.09.22 14:37 sell 0.02 eurusd 1.34584 1.34550 1.34300 2011.09.22 21:06 1.34550 0.00 0.00 0.68
1212689662 2011.09.22 14:37 sell 0.02 eurusd 1.34598 1.34550 1.34300 2011.09.22 21:06 1.34550 0.00 0.00 0.96
1212693180 2011.09.22 15:34 sell 0.03 gbpusd 1.53760 1.54000 1.53500 2011.09.22 15:43 1.53500 0.00 0.00 7.80
1212698421 2011.09.22 16:24 sell 0.03 gbpusd 1.54000 1.54300 1.53400 2011.09.22 17:59 1.53400 0.00 0.00 18.00
1212703947 2011.09.22 17:37 sell 0.03 eurusd 1.34700 1.34500 1.34000 2011.09.22 21:05 1.34500 0.00 0.00 6.00
1212709014 2011.09.22 19:28 sell 0.05 gbpusd 1.53600 0.00000 1.53360 2011.09.22 22:24 1.53360 0.00 0.00 12.00
1212711432 2011.09.22 20:05 sell 0.03 gbpusd 1.53710 0.00000 1.53550 2011.09.22 20:47 1.53550 0.00 0.00 4.80
1212712139 2011.09.22 20:03 sell 0.03 gbpusd 1.53780 0.00000 1.53550 2011.09.22 20:47 1.53550 0.00 0.00 6.90
1212716259 2011.09.22 21:37 sell 0.05 gbpusd 1.53800 1.53699 1.53600 2011.09.22 21:58 1.53600 0.00 0.00 10.00
1212716510 2011.09.22 21:30 sell 0.05 gbpusd 1.54000 1.53699 1.53600 2011.09.22 21:58 1.53600 0.00 0.00 20.00
1212719166 2011.09.22 22:20 sell limit 0.05 gbpusd
M
mrVynes
12 years ago,
Registered user
Hi,
These exercise images are assuming that the A point (to extreme right) reached some level, right? Otherwise it may still be rising and therefore cannot be established as a "level" yet. I know this is for the sake of illustration, but when it comes to describing a concept to a noob(like me) it might be confusing...unless I'm not seeing the big picture here..
Thanks for this stuff, really appreciate it...
R
rucailo
7 years ago,
Registered user
Hi Sieve,
I am a bit confused, can you please explain me what is the difference between retracement and reversal?
thanks in advance!
I am a bit confused, can you please explain me what is the difference between retracement and reversal?
thanks in advance!
R
rucailo
7 years ago,
Registered user
N
> Hi Sieve,
I am a bit confused, can you please explain me what is the difference between retracement and reversal?
thanks in advance!
Forget it, I re-read the chapter and is clear and understood,
Thanks!!
> Hi Sieve,
I am a bit confused, can you please explain me what is the difference between retracement and reversal?
thanks in advance!
Forget it, I re-read the chapter and is clear and understood,
Thanks!!

Hamza Samiullah
6 years ago,
Registered user
Exellent work..
T
Tjasa
5 years ago,
Registered user
> Hi,
Concerning X2 and X3 - you're right, that's just a typo, thankfully not a crucial...
Swing low does not have to own 2 higher lows from the each side, but just one higher low from the left and one ..
Hi!
So by saying that ''swing high a candlestick/bar that has at least two lower highs on both sides of itself – from left and from right'' you mean ONE lower high on the right and ONE on the right? So, altogether are two? Cuz I also understood that on each side there have to be two...and all the examples are like that...probably coincidence?
Table of Contents
- Introduction
- FOREX - What is it ?
- Why FOREX?
- The structure of the FOREX market
- Trading sessions
- Where does the money come from in FOREX?
- Different types of market analysis
- Chart types
- Support and Resistance
- Candlesticks – what are they?
- Mysterious Fibonacci
- Introduction to Moving Averages
- Bollinger Bands
- Leading and Lagging Indicators
- Basic chart patterns
- Pivot points – description and calculation
- Elliot Wave Theory
- Intro to Harmonic Patterns
- Divergence Intro
- Harmonic Approach to Recognizing a Trend Day
- Intro to Breakouts and Fakeouts
- Again about Fundamental Analysis
- Cross Pair – What the Beast is That?
- Multiple Time Frame Intro
- Market Sentiment and COT report
- Dealing with the News
- Let's Start with Carry
- Let’s Meet with Dollar Index
- Intermarket Analysis - Commodities
- Trading Plan Framework – Common Thoughts
- A Bit More About Personality
- Mechanical Trading System Intro
- Tracking Your Performance
- Risk Management Framework
- A Bit More About Leverage
- Why Do We Need Stop-Loss Orders?
- Scaling of Position
- Intramarket Correlations
- Some Talk About Brokers
- Forex Scam - Money Managers
- Graduation!