Part I. Harmonic Approach to Recognizing a Trend Day

Commander in Pips: One of the important things on market is to catch the market’s sentiment – both for long term and for the current trading session. With sentiment, we understand here contraction or expansion of the market. Contraction is range trading, while an expanding market means a trending market. Knowing the current trading environment is particularly important, because applying the wrong strategy will lead to loss. Definitely speaking, if we use a trending strategy on a ranging market or a ranging strategy on a trending one – we will hardly succeed. Very often, many traders scream that their strategy is bad and does not work anymore. Although a strategy could really be bad, very often a good one stops working due o wrong application. As we use different tools for cooking and car repairing , there are different strategies we have to be apply depending on the market environment.

Pipruit: So, we will need some indicators to estimate it, right?
Commander in Pips: The point is that very often traders make countertrend trades. They decide that the market is oversold and it is time to buy or overbought and it’s time to sell. During trending sessions, this could lead to huge financial losses and negatively impact the trader’s mind-set. The major mistake that they do is to always act as in previous trading sessions, when the market contracted. They think that while it worked great previously it will work with the same efficiency in the future despite the different nature of the current trading session. That is a serious mistake. We have to act differently, depending on the current session’s mood. Still, trending days are not very common to see. In a usual trading month there would be no more than 2-5 trending days on average.
Pipruit: I see. So, it looks like this is very important, especially for countertrend traders. If they will see the trend day – it’s better to join it, or at least stand aside and do not try to go against it. This will definitely save a lot of money and nerves.
Identifying a trend day
As you remember, earlier we defined a trend as creating higher highs and higher lows for an uptrend and lower highs and lower lows for a downtrend. Such kind of price action could be seen on any timeframe. Still, larger trends on longer time frames start from smaller ones on lower time frames. The major property of a trend for any trading period is that the market usually opens on the low/high for that period and closes in the opposite side if up/down trend really has started.
Identifying a trend day continued
The major deceit and cunning from the market in a trending environment is that most people think that market has risen too high or it has fallen too low depending on the direction of the trend. They think that this is 100% excellent possibility to enter against the trend, because market just can’t move any further, since it has passed so large a distance already. As a rule this way of thinking leads to solid losses. In a trending period the market could go further…much further. If you’re an intraday trader and trade some short-term periods, say 5-15 min charts, you should be aware of the start of a trend in any time of the day, so as to finishing of the trend soon. Other words, trends could be short-terms or long-term. Sometimes a trend holds during whole trading session or even longer, but sometimes it takes just some part of a trading session.
1. Open gap. This is not very typical for Forex market, since it 24-hours trading and it has no close during the week and more common, say, for settlement commodities sessions or equities. But on Forex this situation could appear on Sunday (or Monday, depending on what time zone you live in), when the market really opens after the weekend. A gap is a difference between the closing price of the previous trading session and the opening price of the next trading session:
Chart #1 | 60-min EUR/USD Gap at Monday’s open
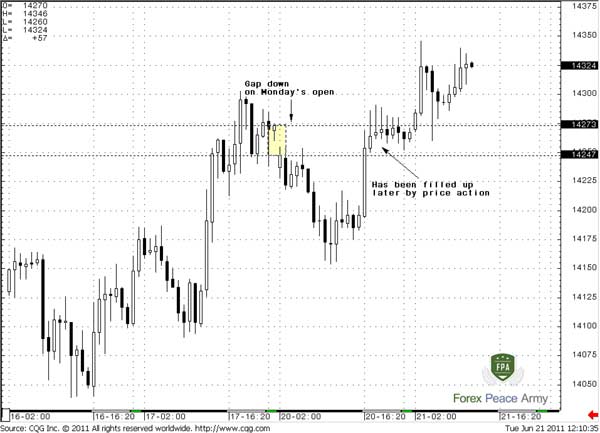
Later price has returned in that area and filled up the gap – this is the most common scenario. But on commodities and equity markets, gaps could stay unfilled for a long period of time and create strong areas of support or resistance.
So if we drop our time frame to a 5-min chart, then this gap will be early notification of a potential short term down trend:
Chart #2 | 5-min EUR/USD down trend has started from gap on Monday
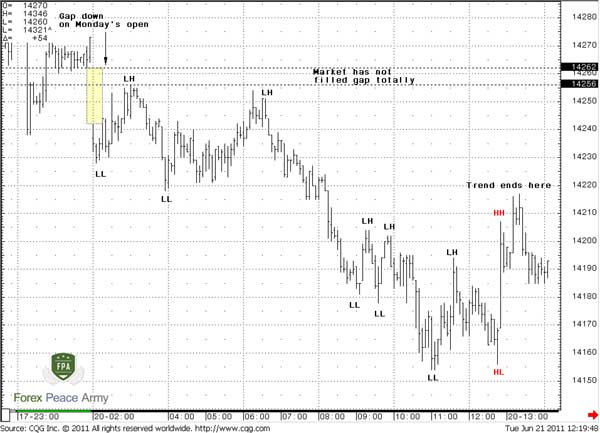
But most important, is that price has not filled up the gap totally. See – it has tried to return back and fill it, but couldn’t do this. This is the first notification of a potential trending day. Appearance of a gap tells us that there is some imbalance in price.
Chart #2 | 5-min EUR/USD down trend has started from gap on Monday

2. Acceleration to new low after the day’s open. Well, on chart #2 this is not seem perfect. Still we can see that market shows nice long bars to the new low (second LL) of the day while holding the gap unfilled. Here is one important rule:
“If the market shows a nice long thrust bar down to new lows and then shows a strong reverse move up and fills the gap – then a trending day probably will not happen.”
The same is true in up trends. So, the appearance of a gap, holding it unfilled and acceleration to new lows are our early signs of a down trending session. The appearance of a gap, holding it unfilled and acceleration to new highs are our early signs of an up trending session. 3. Appearing of inside trading sessions - narrowing trading range of previous periods of larger time frames (perfect if it will be about 5 periods – whole week). Here we have to take a look at higher time frame. If you trade intraday – then you will have to look at daily time frame, trade daily – on weekly and so on. Let’s specify what is meant by “inside day”. This is the situation, when the current trading session range (from high to low) totally stands inside of the previous trading session. Other word, the high of the previous session is higher than the current one and the low of the previous session is lower. But this should not be just single inside day – it should be some confluence of those days, not necessary that all of them should be inside to each other. Just use common sense here – you have to see contraction of trading range during some period of time – about 3-5 days in a row. Look on chart #3:
Chart #3 | Daily EUR/USD - inside days and range reducing before strong trend days
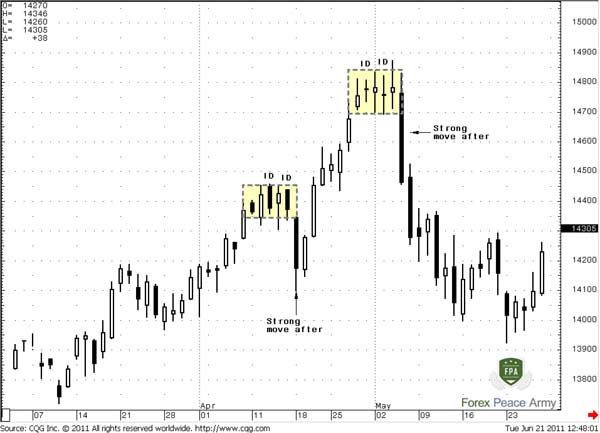
We see that ID (Inside Days) is not 5 in a row – but market drastically reduces range during the week. In the second example, right on top is even clearer situation – a lot of Doji and High waves just confirm that the market is in indecision. Both of these examples show that in such kind of environment, the market is building energy and determine the way. We do not know where the market will go – up or down, but we do know that this move should be strong. For direction estimating, we have two previous points.
Pipruit: Sir, this is very interesting. If I’ve understand all things correctly – first, we look at a higher time frame, say, daily if we trade intraday. If we see strong range contraction and some inside days then we should be ready for some trend day in either direction. Then we start to keep an eye on the beginning of trading sessions. If we see unfilled gaps, acceleration to new extremes after it, especially in the beginning of the
week, then it tells us that probably a trending day is starting. The gap should hold unfilled and some strong long bars should follow in 15-30 min after the market’s open to new extremes for high or low of the day.
Pipruit: Right.
Patterns that could be found on trend days
Next we have to discuss what to expect and how we have to act on a trend day. It’s obvious that since the trend day has started, the market will likely not show deep retracements. If there is a strong trend most retracements will not greater than 0.382. If the trend is not so unstoppable, then retracement could reach 0.5-0.618. If this is a really trending day, the market should not show retracement deeper than 0.618. Two major patterns, that you will get during trending days are AB=CD and consolidation pattern. A consolidation pattern usually takes form of classical pennant or flag. But the size of these patterns is strictly harmonic with major harmonic number of EUR/USD – 37-40 pips + 2-3 pips for entry/exit (you have to remember than entry order should be placed slightly ahead the level while stop order - beyond) Hence, retracement could be: 1. 37*0.618 ~ 23 pips 2. 37*0.5~ 18.5 pips 3. 37*0.382 ~ 14 pips. Second, you will not get many chances to enter with AB-CD pattern. It will be luck if you will get couple of them during the whole sessions. So use them! Third, price action during trending days tends to repeat the depth of retracement in value. It means that retracements should be close in term of depth – for instance 18-23 pips for consolidated patterns and 37 or 60 pips for AB=CD. If this is does not hold, then probably trend power is not perfect. Here is nice example of trending day on 5-min chart:
Chart #4 | Trending day on 5-min EUR/USD
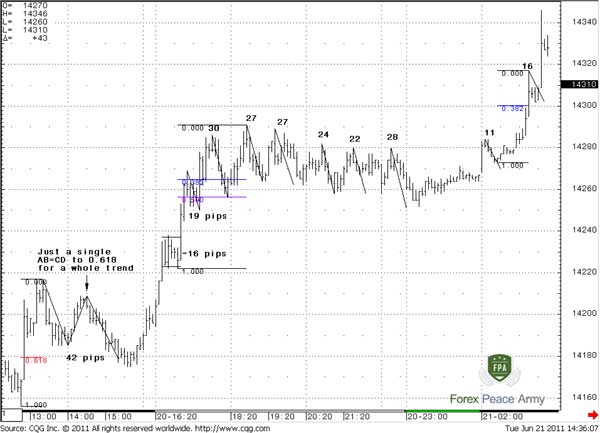
See – we have just single AB=CD pattern with 1 harmonic value retracement to 0.618 right in the beginning of the trending period. That’s very common. All other retracements holds 0.382-0.5 support levels and not exceed 0.618*37-40 pips ~23-25 pips. Although we can see 27-28 pips retracements inside the consolidation. But think to yourself – this is just 3-4 pips difference! Other retracements were even lower, as we said 14-18 pips. That is quite common for a trending day – harmonic retracement not deeper than 0.382-0.5 Fib retracements.
Pipruit: But commander, I do not see the gap here.
Some prompts from higher time frames
Also you can get some confirmation of trending day from a higher time frame. Look at the followed picture:
Chart #5 |60-min EUR/USD
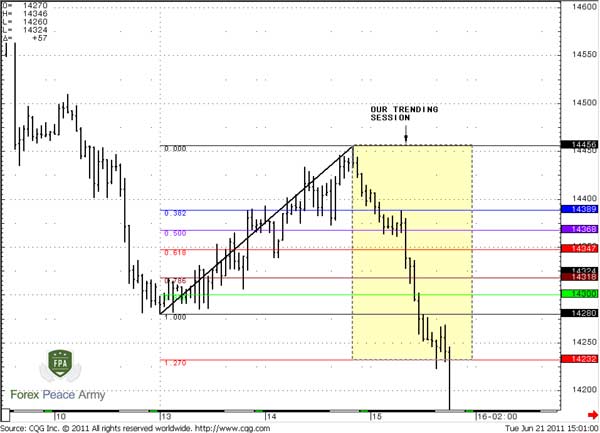
Since we trade on 5-min chart, our trading session will be the 15th of June, in the yellow rectangle. Of course we do not know that this really strong move down will happen. All that we do know is the Fib support levels. But here is a clue. The point is that in a trending environment the market has very typical style of behavior around Fib levels of higher time frames. Let’s drop the time frame and look at rectangle on 5-min chart:
Chart #6 | 5-min EUR/USD
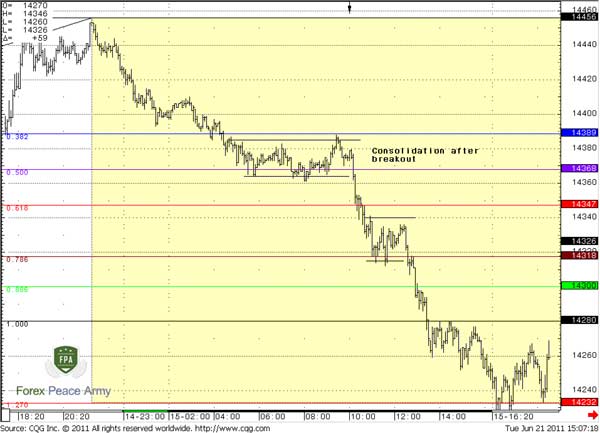
First of all we see the same accelerations to the down side and 11-18 pips retracement. Only single AB-CD, relatively pure, around 0.5 Fib level. But the most interesting is that the market shows consolidations after breakouts of significant levels. See – it breaks 0.382 and turns to consolidation between 0.382-0.5, further breaks 0.618 – consolidation right above 0.786. Second is retesting of broken levels with AB-CD patterns - for example, retesting of 0.382 before breakout of 0.5. This kind of price action, when market after breakout of some level stands above the next level tells that move will continue so as retesting of broken levels from another side.
Pipruit: And so what?
Trading trending days
For discussion of the trading process we will use the same chart as #4 but with necessary markings of trading process. The common major feature of trading trending days is to use harmonic numbers. Since we know that if this is a real trending day, the market should not show retracement deeper than some harmonic number (or its fraction), because we do know that any move in the market greater than some harmonic number is not just occasional. So, if market shows during, as we suggest, the trending day a move against us for more than harmonic number – it will quickly tell us that this is probably not the trending day. Also it gives us a huge advantage in placing very tight stops for same reason – the market should not move against us greater than harmonic number. The major task though is to find a balance, what fraction of the harmonic number to use – so, that we can enter the market from one point of view, and to not take too much risk from the other point of view. Since this is a trending day we have to use some shallow fraction of the harmonic number to be possessed in the trades. Speaking about our example, and because we will trade on 5-min chart, we will use 0.382*37 = 14 pips retracement to enter. Stop will never be placed beyond 37-40 pips, i.e. 1 harmonic number from the swing high. Other words, not farer than 40-14 = 26 pips from our entry point. Cool, right? Now, what do we want on trending day, since market opens near the low and should close near the highs? We want to hold some position right through all day, to get sufficient profit. Second, we want reduce risk and simultaneously use different possibilities that could appear during the trading session.
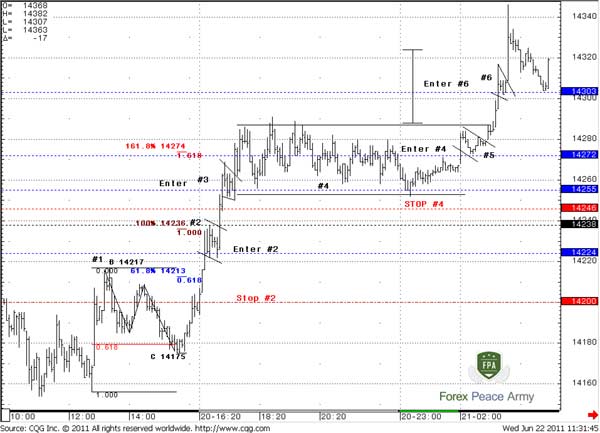
Chart #7 | 5-min EUR/USD

That is our working chart. Here we see different patterns that I’ve marked with numbers: #1 - initial AB=CD pattern; #2, 3, 5, 6 – consolidation patterns, i.e. classical flags and pennants; #4 – sideways consolidation. As we said, we will apply 14 pips retracement entry level and 26 pips stop order initially to any position, due to the properties of harmonic number and trending day. So, how we will act here:
#1 – although this is excellent AB=CD that shows perfect 0.618 retracement from initial move up, we probably couldn’t catch it, because this is first pattern in the beginning of the trend. But it has different importance. Usually, when market turns momentum the first retracement is AB=CD. That is a prompt that further price movement could be significant. Also it gives us a Gartley 222 and a larger AB=CD that allows us to estimate the targets at 1.4236 and 1.4274.
#2 – That is our first entry possibility. We expect some retracement, since the market has reached 1.0 Fib extension target at 1.4236. Our entry level is 1.4224 – 14 pips lower from the recent highs at 1.4238. Initial stop will be placed at 1.42 – 24 pips lower – all is according to our initial trading plan. We do not change anything. Enter, as usual with harmonic patterns, we’ve made with double position. Also pay attention that our stop is below previous swing high, where initial AB=CD has started – that’s additional support. The major observation could be done, based on type of price move to 1.4238. See – market accelerates right to 1.4236 and has not shown any retracement, when hit 0.618 extension target at 1.4213. This tells us, that we can count on move till 1.618 at 1.4274. Take a look at how harmonic numbers work on trending days – we’ve entered right at the low of flag pattern. Our first target on the first half of the position – 24 pips up = 1.4248. When th market continues to move up, we move stop loss on the other half right below the low of flag #2 – almost at breakeven point. Hence we lock in profit the rest of this position and can initiate any other, since our risk now is zero.
#3 – Here we repeat all the same, that has been done with #2 point. Our entry Long will be at 1.4255, since the high was at 1.4269. Initial stop will be placed at 1.4230 (in the middle of flag #2 – does not shown on the chart). When market continue up further – you may exit at 1.4274, since this is 1.618 target or wait a bit longer and exit at 1.4281, because this is 26 pips from our entry point. To be absolutely honest, probably it makes sense to skip that trade, or take some risk with placing tighter stop, because if your profit objective is 1.4274, then your potential loss is greater than profit. That’s not good. Form the other side, the market could not reach 1.4281, since target is 1.4274. If you still decide to trade it – you may place a tighter stop. As we can see here – you will get the profit, but this is just current case. In general, better to use risk/reward ratio no less than 1, as we do. So, exit the first half at 1.4281 and place a tight stop just below the low of flag #3 for both halves of positions – from enter at #2 and from enter at #3.
Chart #7 | 5-min EUR/USD
#4 – When market has reached highs after 1.618 target and turns to retracement, we, again, enter 14 pips lower at 1.4272 with stop 1.4246. Here we should wait a bit, since the market has turned to sideways action, but our stop has not been triggered. Target of the first half of position is 26 pips higher – 1.4298 – right at the up border. Second target you may estimate by yourself – either just use a trailing stop and hold the second half of position or use the classical approach – target is a width of the rectangle, so as we done here… But any scenario is acceptable.#5 - We skip this pattern, since retracement was even less than 14 pips. But it gives us important clue. According to classical technical analysis school - if market forms flag right below up border of sideway consolidation this is an early notification of breakout. So, we wait….
Chart #7 | 5-min EUR/USD
#6 – Enter at 1.4303 – 14 pips lower than the high. Stop should be at 1.4277 – just below the upper border of sideways consolidation - excellent place for stop, by the way. Here we also drag stops of positions from #2, #3 and #4. Initial target is 1.4303, then stop to all rest positions drags to the low of #6 pennant. Later you can see that the market retests this level and stops are triggered. Alternatively, you can exit at target of rectangle – it has shown on the chart. So, you have at least four halves of positions that equal 2 your lots that you can hold through the whole trending day with no risk.
Pipruit: That’s amazing, Sir, really cool stuff.
Pipruit: When you say about “lot”, “half of position” – about what particular size are you speaking?
Pipruit: 5000*2%/(0.0026*100 000) = 0.38 standard lot. Ok, so, the halves, that you’ve spoken about are 0.19 lot, right?
Commander in Pips: Bingo!
Pipruit: And the last question – you’ve used 14 pips retracement to estimate entry point, since this is 0.382*EUR harmonic number. And can I use, say 0.5 or even 0.618 retracement*harmonic number?
Pipruit: …or no entries at all, if the trend is really strong…
Comments

Hamza Samiullah
6 years ago,
Registered user
Good work
O
One-fm
5 years ago,
Registered user
Thanks
Table of Contents
- Introduction
- FOREX - What is it ?
- Why FOREX?
- The structure of the FOREX market
- Trading sessions
- Where does the money come from in FOREX?
- Different types of market analysis
- Chart types
- Support and Resistance
- Candlesticks – what are they?
- Mysterious Fibonacci
- Introduction to Moving Averages
- Bollinger Bands
- Leading and Lagging Indicators
- Basic chart patterns
- Pivot points – description and calculation
- Elliot Wave Theory
- Intro to Harmonic Patterns
- Divergence Intro
- Harmonic Approach to Recognizing a Trend Day
- Intro to Breakouts and Fakeouts
- Again about Fundamental Analysis
- Cross Pair – What the Beast is That?
- Multiple Time Frame Intro
- Market Sentiment and COT report
- Dealing with the News
- Let's Start with Carry
- Let’s Meet with Dollar Index
- Intermarket Analysis - Commodities
- Trading Plan Framework – Common Thoughts
- A Bit More About Personality
- Mechanical Trading System Intro
- Tracking Your Performance
- Risk Management Framework
- A Bit More About Leverage
- Why Do We Need Stop-Loss Orders?
- Scaling of Position
- Intramarket Correlations
- Some Talk About Brokers
- Forex Scam - Money Managers
- Graduation!