Part II. Dollar Index – continued…

https://www.federalreserve.gov/pubs/bulletin/2005/winter05_index.pdf

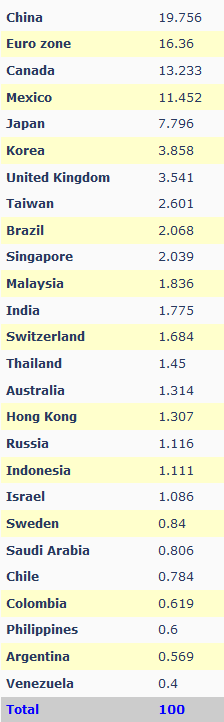
So, here is a table of Index for 2012 (as of October 2011):
FRB: H.10 Release--Currency Weights
In fact this index is based on the competitive quality of US goods. The major difference with the ICE index, is that the current one includes more countries in calculation, even some emerging countries. Probably it better reflects the real value of the US dollar in the modern financial world, especially if we will take into consideration the growing power of emerging markets.
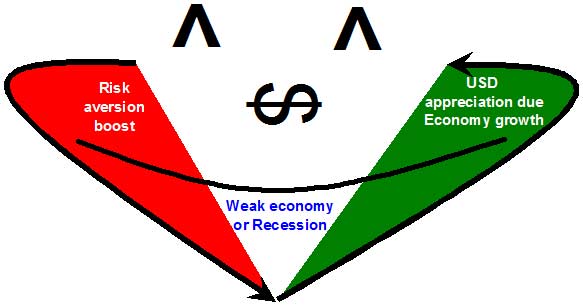
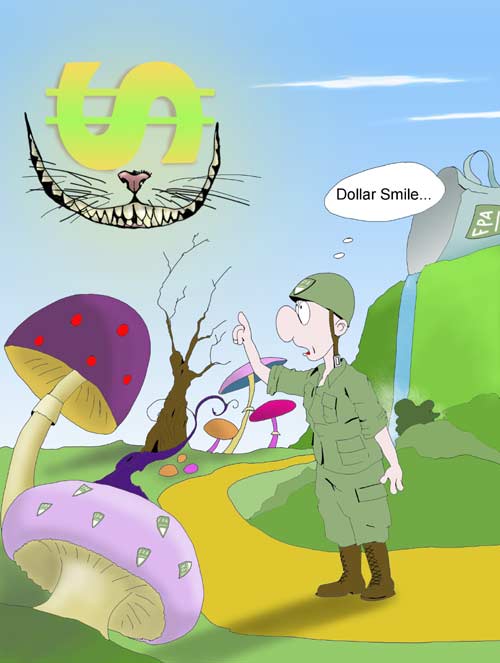
Dollar Smiley
Pipruit: Sir, that’s very interesting about the Index dollar and all this stuff, but keeping in mind all things that we’ve discussed in recent time – I mean fundamental analysis, carry and index, I’ve come to some conclusion...
Commander in Pips: Well, that’s interesting to hear….
Pipruit: Well, my theory has three phases and is based on some thoughts about investors behavior in different situations. The first phase is a dollar growth (and USDX, I suppose), that is based on risk aversion. You’ve said once, that the USD is one of the safe havens, so when problems have started – investors start to buy dollars to get return OF the investments rather than return ON the investments. This capital flow then forces the USD to rise.
When this overflow comes to an end and all who wants to buy US Dollars have done this – Then the second stage comes. This stage is dollar decreasing, since the economy falls into recession.
The third stage comes when the US economy starts to grow and gradually leave recession and turns to growth. At that stage investors reduce their risk aversion, take it more and start to invest money in US assets. This increase demand for US Dollars and forces USD to rise. A bit later Fed starts to to raise rates and that also supports the dollar’s growth.
What do you think about this stuff?
Pipruit: Are you kidding?
Commander in Pips: No, I’m speaking absolutely seriously. Still I have to upset you.
Pipruit: Why?
Commander in Pips: This theory has been invented a bit earlier that you’ve done it – by a wise man from Morgan Stanley and his name is Stephen Jen. He has called this theory the “Dollar Smile theory”. Now this theory is very popular and is treated as classical.
Pipruit: Looks funny.
Commander in Pips: Thanks, but theory is quite serious and you’ve understand it quite right. Let’s pass through it again:
Phase 1 – Risk aversion boost
Economy starts to show the first warning signs of potential serious problems. Investors become worried and with that start to move their assets into safe-haven currencies. Initially it develops slowly but then faster and faster. In a row with USD – CHF and JPY also could start to rise. Since they think that the current situation in the economy is unstable or even on the edge – they prefer to get return “of investments” at all, rather than to get return “on the investments”. Durung such stages of the economy, the major task is to save what you have, rather than to earn more. Due to thess reasons the dollar starts to appreciate and it rate is growing.
Phase 2 – Weak economy of recession
When the rush gradually calms down, the economy gives clear signals of slowdown or even recession, The Fed starts to decrease interest rates, the dollar starts to fall. Demand for the greenback is weak.
Phase 3 – Economic growth
Gradually, the situation becomes better, fundamental data starts to show improving of the economic environment. The real economy sector start to think about expansion again and increases production, demand on credits and loans starts to grow; financial participants’ appetite for risk starts to increase. Since overall optimism picks up and the market is ready to invest and take more risk – the dollar starts its appreciation. Later, when the first signs of inflation growth start appearing, the Fed launches a rate hike cycle – this plays also in favor of the greenback.
Pipruit: Sir, and can’t we see it currently? I mean, the recent crisis has started in 2008, can we see Dollar Smiley on US DX now?
Commander in Pips: Let’s take a look…
Chart #1 | Monthly USDX
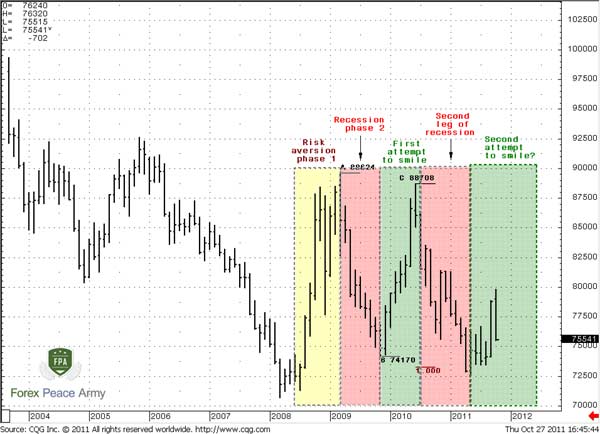
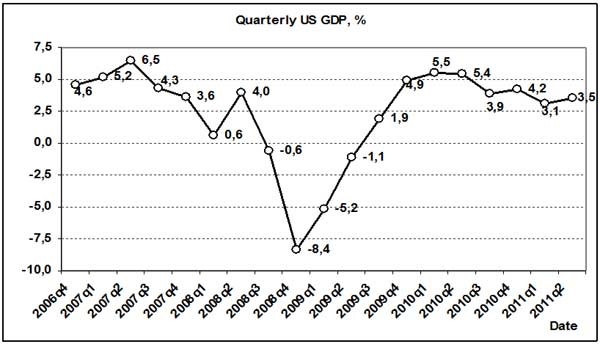
Well, we clearly see risk aversion that was confirmed by the plunge in US GDP and interest rate decreases in 2008. Since GDP and the overall economy has fallen in recession – the dollar has turned south.Strong and deep recessions almost never finish with “V” bottoms, so that has happened again. Although the GDP holds relatively well, but lower than before the crisis – there were other problems, such as unemployment, weak real estate markets etc. So the market has shown an attempt to “smile” on USD Index, but later the second phase of recession has come to create a “W” bottom reversal.
Also I’ve added AB-CD pattern, so that we can treat whole this pattern as W-shape recession bottom – probably it’s quite correct. From that point of view, the “real smile” is only ready to start. So we are standing at the eve of the second attempt to “smile” and probably it has more chances to succeed… Only time will tell us…
Anyway, this is good and important theory and you better to keep it in mind.
Comments
U
Urum
12 years ago,
Registered user
Hey Sive, where can we get dollar index charts? There isn't one in metatrader generally

Sive Morten
12 years ago,
Registered user
> Hey Sive, where can we get dollar index charts? There isn't one in metatrader generally
Hi Urum,
Dollar Index futures trades on ICE exchange. May be they have some interactive chart there.
Hi Urum,
Dollar Index futures trades on ICE exchange. May be they have some interactive chart there.
O
One-fm
5 years ago,
Registered user
This is insightful.
Table of Contents
- Introduction
- FOREX - What is it ?
- Why FOREX?
- The structure of the FOREX market
- Trading sessions
- Where does the money come from in FOREX?
- Different types of market analysis
- Chart types
- Support and Resistance
- Candlesticks – what are they?
- Mysterious Fibonacci
- Introduction to Moving Averages
- Bollinger Bands
- Leading and Lagging Indicators
- Basic chart patterns
- Pivot points – description and calculation
- Elliot Wave Theory
- Intro to Harmonic Patterns
- Divergence Intro
- Harmonic Approach to Recognizing a Trend Day
- Intro to Breakouts and Fakeouts
- Again about Fundamental Analysis
- Cross Pair – What the Beast is That?
- Multiple Time Frame Intro
- Market Sentiment and COT report
- Dealing with the News
- Let's Start with Carry
- Let’s Meet with Dollar Index
- Intermarket Analysis - Commodities
- Trading Plan Framework – Common Thoughts
- A Bit More About Personality
- Mechanical Trading System Intro
- Tracking Your Performance
- Risk Management Framework
- A Bit More About Leverage
- Why Do We Need Stop-Loss Orders?
- Scaling of Position
- Intramarket Correlations
- Some Talk About Brokers
- Forex Scam - Money Managers
- Graduation!