Part VI. Combination of Fibonacci levels with candle patterns

Commander in Pips: Here is the GBP/USD weekly chart and the 2008 collapse. Let’s assume that after such strong move down you intend to enter short, but don’t know yet, from which level to do that:
Chart #1 GBP/USD Weekly | 2008 Collapse
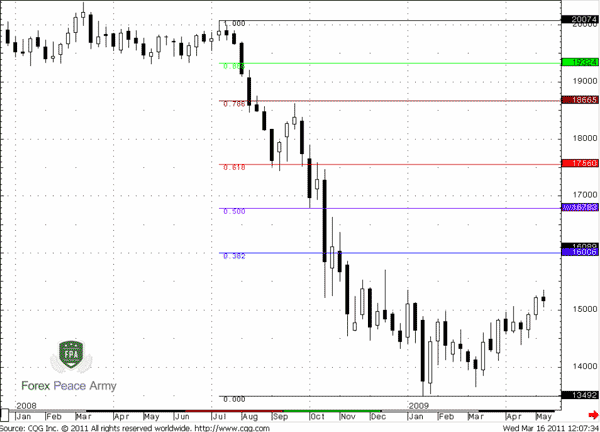
Pipruit: Well, after such strong move down, I think I prefer to enter from 0.382 level. But here I do not see any confirmations from any trend line or resistance lines that we’ve discussed in previous part. So, my confidence with 0.382 level is not so strong.Commander in Pips: Right. So, let’s see what has happened, if you’ve entered short from 0.382 level. Share your thoughts about the candles that you see around 0.382 level:
Chart #2
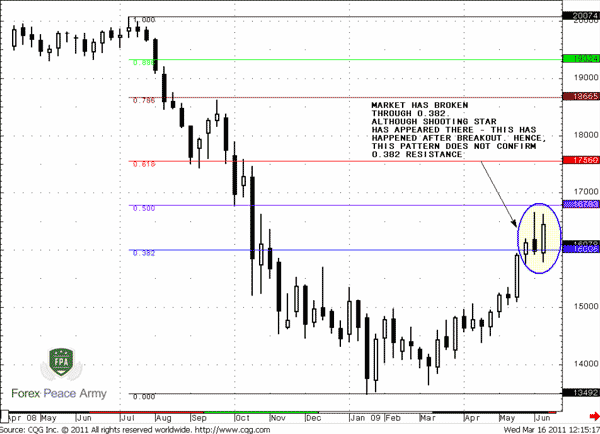
Pipruit: Ok. First, I see strong white candle that is almost Marubozu - it has very small shadows. This candle assumes continuation of the move up and this fact forces me to wait and not to enter right from 0.382 resistance. Then I see, that this has happened – the market has passed through this level with a small white candle. Then I see the appearance of a Shooting Star pattern, but now I do not have necessary context for entering from Fibonacci levels, because this pattern has appeareded somewhere between the 0.382 and the 0.5 area. We need a resistance that has been confirmed by a candlestick pattern. So, I think that I will stay flat.
Commander in Pips: Excellent analysis – couldn’t do better by myself. So, let’s go further:
Chart #3
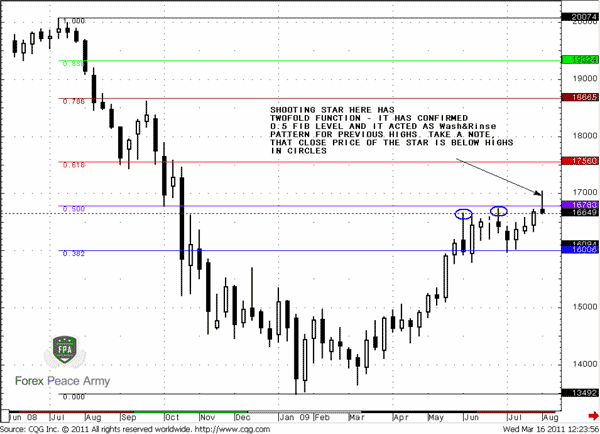
Pipruit: And here, Commander, I think we finally get what we want – a Shooting Star pattern, that confirms resistance of 0.5 Fib level. Also it acts as a Wash & Rinse of previous highs and 0.5 level itself. You’ve warned me about this possible scenario, and as I already know – W&R itself is a pattern. So, I think I enter short here with stop loss above the high of Shooting Star – according to rule of trading candlestick patterns.
Commander in Pips: Well, at least your explanation is very logical and you have a reason to enter Short. Here is what has happened then:
Chart #4
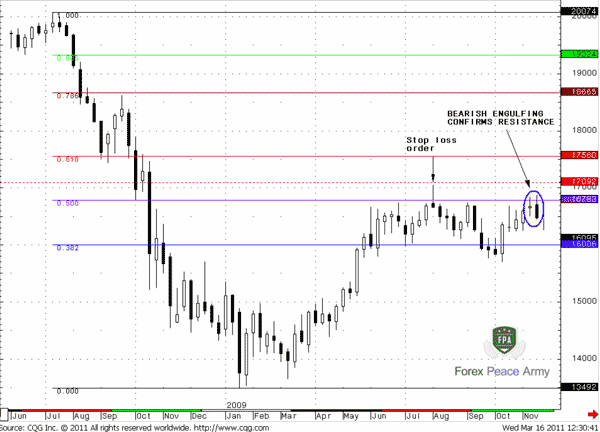
Pipruit: Wow, Commander – I see that our Shooting star later has become a second candle of an “Evening star”. A bit later I see the appearance of a Bearish Engulfing pattern that confirms resistance. My pattern has been triggered and my stop is still untouched.
Commander in Pips: Yes, all things look nice yet. Your position is in profit. And here is a final chart:
Chart #5
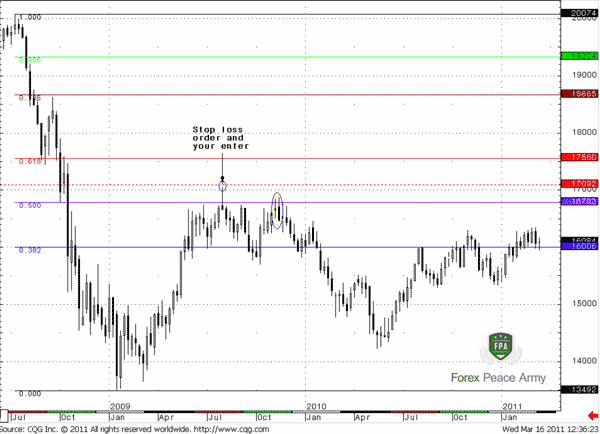
Pipruit: Cool! Finally, I’ve made a profit, although on paper. Still, Commander, this is just a hindsight view? I suppose that it will be much difficult to do in real time…
Pipruit: Cool! Finally, I’ve made a profit, although on paper. Still, Commander, this is just a hindsight view? I suppose that it will be much difficult to do in real time…
Commander in Pips: You’re absolutely right about that. But I moved the chart gradually, so it was almost the same as real life. Besides, our purpose here is to teach you – what to watch for and how perceive very shallow nuances that could give you extremely important prompts, that other traders do not see or do not pay attention to.
Pipruit: I understand. Commander and where is a better way to close the trade?
Commander in Pips: It doesn’t matter here, but there are a lot of levels, where you can do that by applying your current knowledge – the first area is the 0.382 level where the market has formed bullish engulfing near the end of 2009, then a bit later you can see a Hammer-Doji in January 2010 and then in April 2010 a lot of bullish patterns side by side – Hammer and two Inverted Hammers.
Pipruit: Right. I see. So, is it proper way to combine all tools? I mean Fibonacci levels with support resistance, trend lines and Candlestick patterns?
Commander in Pips: Of course. It’s not just that it could be done – it has to be done, when the market shows you these possible combinations. For instance, if you see that at some Fib support, say, 0.618 coincides with an obvious trend line, and the market forms Bullish Engulfing, that is also a Wash&Rinse pattern – this is a good context for entering Long.
Here is another important note. In fact, using Fibonacci work we try to find an area where the market could turn in the continuation of its previous thrust. So, that’s why usually we will be watching for Candlestick Reversal patterns around these areas. When you see any – you can act in two ways. Enter right after the completion of pattern, or use the more conservative approach – wait when market will trigger it according the rules that we’ve discussed already. Using candlestick patterns around Fibonacci levels allows you not to enter from a level blindly - this gives you more confidence with this particular level.
Still, as with candlestick patterns, as with Fib levels as with both – they could still fail. That’s why we need apply efficient money management system, but this question we will be discussed in later chapters.
Pipruit: I expected to hear precisely this answer. I understand that combining is just increasing the probability to success, but doesn’t give 100% warranty that we will get profit.
Commander in Pips: Absolutely.
Comments
W
waleed_1980
11 years ago,
Registered user
ur too great
thanks for ur nice and useful information
thanks for ur nice and useful information

Hamza Samiullah
6 years ago,
Registered user
Nice ....
Table of Contents
- Introduction
- FOREX - What is it ?
- Why FOREX?
- The structure of the FOREX market
- Trading sessions
- Where does the money come from in FOREX?
- Different types of market analysis
- Chart types
- Support and Resistance
- Candlesticks – what are they?
- Mysterious Fibonacci
- Introduction to Moving Averages
- Bollinger Bands
- Leading and Lagging Indicators
- Basic chart patterns
- Pivot points – description and calculation
- Elliot Wave Theory
- Intro to Harmonic Patterns
- Divergence Intro
- Harmonic Approach to Recognizing a Trend Day
- Intro to Breakouts and Fakeouts
- Again about Fundamental Analysis
- Cross Pair – What the Beast is That?
- Multiple Time Frame Intro
- Market Sentiment and COT report
- Dealing with the News
- Let's Start with Carry
- Let’s Meet with Dollar Index
- Intermarket Analysis - Commodities
- Trading Plan Framework – Common Thoughts
- A Bit More About Personality
- Mechanical Trading System Intro
- Tracking Your Performance
- Risk Management Framework
- A Bit More About Leverage
- Why Do We Need Stop-Loss Orders?
- Scaling of Position
- Intramarket Correlations
- Some Talk About Brokers
- Forex Scam - Money Managers
- Graduation!