Part I. Intermarket Analysis - Commodities


Pipruit: Ok, let’s get started…
Pipruit: Is it like EUR/USD and Dollar index in previous charter?
Commander in Pips: Right, since they move in opposite direction but their charts are almost a mirror of each other – they have solid negative correlation. Maximum correlation is 100% or -100%. It could be achieved, say, if you will find correlation of EUR/USD with itself. This will be 100%, since those charts are equal. Usually two different assets do not have 100% or -100% correlations, but when correlation reaches +/- 70-95% it treated as significant. The major idea of correlation is “How changes in one of the assets explain changes in the other one.” This thought is implied mathematically. But for us the major thought to understand the moment that the larger correlation is – the more “similar” assets move. If it is positive – they move in the same direction, if negative – in the opposite direction.
Now let’s return to the link between Gold and the USD – they have a solid negative correlation. There are two explanations that exist for that. The first one is fundamental. When the global economy falls into turmoil and different crisis, or some geopolitical catastrophe happens – investors try to save their money and want to invest them in some real asset. No doubt that gold is such asset. During such moments investors are doubting any paper money, even the US Dollar and invest in really safe assets – precious metals, and mostly in Gold. When the economy starts to repair and grow, investors become more confident with the future and safety of their assets even outside of gold and they start to invest them in other assets, buying currency first. So, gold is starting to decline and the US Dollar – to grow.
The second explanation is quite simple. The point is that we can treat gold as a currency pair, since it trades on Chicago Mercantile Exchange in USD – we might say that this is Gold/USD. It’s obvious that when USD moves down, gold price in USD moves up and vice versa.
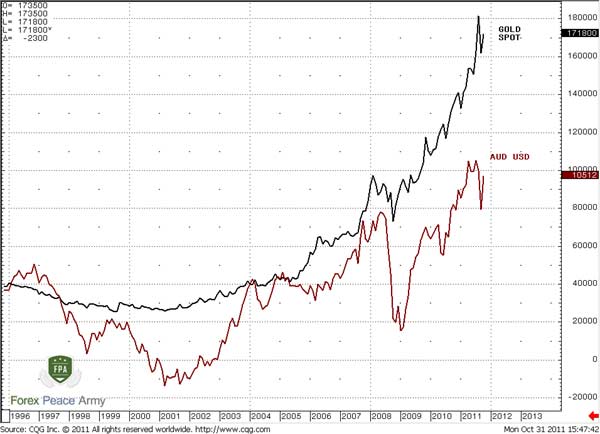
To look at visual correlation it’s better to compare Gold price with either Dollar Index or with some currency that depend of Gold. One of such country is Australia – second major Gold producer in the world and, single representative in major pairs. The value of export of Gold is about 215 Tones. At the current price it’s about 11 Billion Dollars in 2010. So, AUD/USD has not a bad link with Gold, although, you may find that even EUR/USD and USD/CHF also have impressive correlations:
Chart #1 | AUD/USD and Gold Spot monthly chart
It looks a bit different with the Dollar Index, since AUD/USD and Dollar index are not the same, as you understand:
Chart #2 | Dollar Index and Gold Spot monthly chart
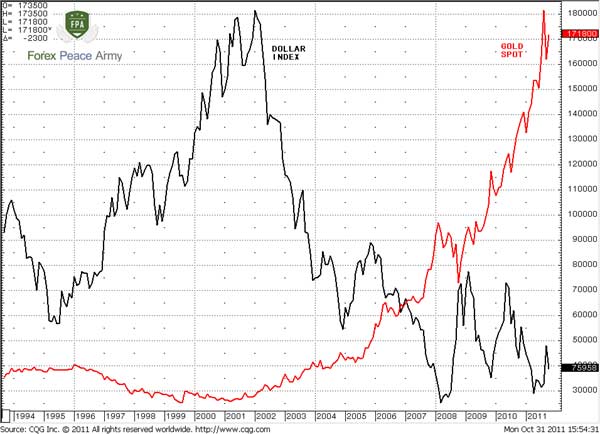
Although major breakeven points coincide, still the Dollar Index has more choppy action. And, here is the last one comparison – with CHF/USD pair:Chart #3 | CHF/USD and Gold Spot monthly chart
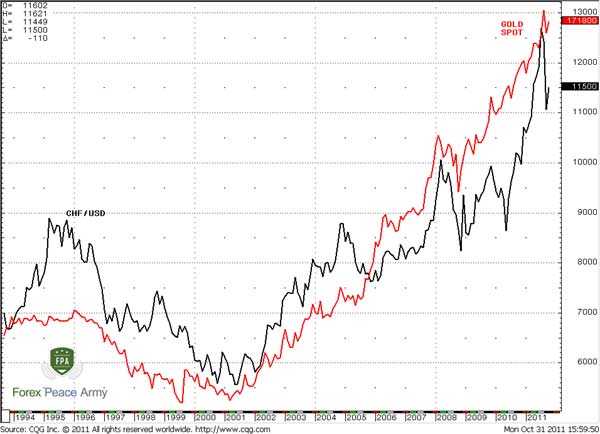
Pipruit: Wow, I mostly like this one – they are almost repeating each other. Why is that?
Commander in Pips: Well, the Swiss Franc is one of the safest and most reliable currencies in the world and it also could be treated as a safe-haven. Although it’s not as safe as gold, but still it could give you additional return, since you can buy CHF and invest in Swiss Bonds, while you can't do this with Gold. The point is that Swiss currency is backed by Gold reserves for 25%!
Speaking in terms of correlation, the CHF has correlation with gold around 91.7% since 2000! I mean CHF directly, if you will plot USD/CHF (common pair for spot forex) then it will have negative correlation of the same value – “-91.7%.
Just for comparison, the Dollar Index has just -0.74% correlation with gold, while AUD/USD pair - 87.3%. Also significant is the correlation with the Canadian Dollar – around 82.9%.
Pipruit: But how we can apply this?
Commander in Pips: This analysis is very useful from a fundamental point of you for long-term traders. For instance, you see, that the world's economic data starts to gradually improving, but you can’t find the moment when to enter a long-term trade. One of the possible ways is to track divergence between Gold and gold-linked currencies. If, for instance on a monthly chart, some currency creates a new top, but gold does not support it – then probably you can try to enter, at least partially. This calls as “intermarket divergence”. We’ve discussed it on the Dollar Index also. But remember – this should not be done blindly – this is a technical issue and it will give you just a moment to use as an entry point, but not a full context to enter. You must have a solid foundation to enter into a long term trade and this should not be just divergence, even on a monthly chart.
For instance, currently we see solid divergence of the Dollar Index and Gold. From one point of view – it could be a signal, since the dollar does not become weaker, while Gold becomes stronger. But this could happen just because Gold becomes more expensive, even in terms of current dollar value. As you can see divergence itself can’t resolve this question. If, say we will see in nearest future regular positive and strong macro data on US economy – that will be the clue that probably this divergence could lead to a reversal.
Crude Oil
Commander in Pips: The same logic could be applied to this commodity also. May be you know what country amongst the majors is the largest Crude oil exporter?
Pipruit: Well, I don’t know exactly, but just one rise in my mind – Canada, may be, because hardly this is Britain, Switzerland or the EU.
Commander in Pips: Well, you’re absolutely right. As of 2009 Canada is 6th world largest producer with around 3.3 million barrels per day. Although this is not so impressive, as Russia with 10.12 million barrels per day, but there is another reason why it is so important for us. What reason?
Pipruit: Well, maybe due to geographical closeness to the US, Canada supplies all crude oil to US?
Commander in Pips: Absolutely. Canada is the largest Crude oil supplier to the US and 99% of its total export comes to the US. This is about 1.938 million barrels per day, according to EIA. Canada links with oil and USD as stronger as no other major country and its currency. Hence, we can count on some correlation between CAD and oil prices. Since Crude oil is even more important for the world economy than gold – in fact this is the blood of the economy. Crude oil forces to move and run almost all machines in the world directly or indirectly – this is the world’s major energy source.
The second reason is that Canada’s economy mostly depends on export and crude oil is a significant part of it. That’s why Canadian currency shows sensitivity to crude oil price changes.
Chart #4 | CAD/USD and Crude Oil futures monthly chart
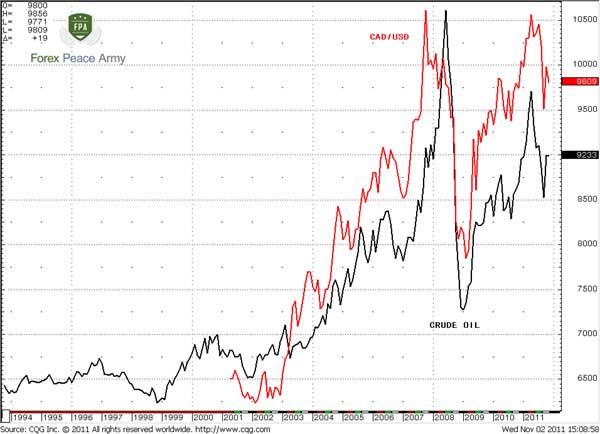
Commander in Pips: Now, if we calculate correlation then will get impressive number – 90.26%! But this correlation comes not just because Canada is an export country, but because it export 85-90% to the US. That’s why the Canadian economy strongly depends on the US and their consumer strength. If demand in the US falls, then Canadian producers will start to reduce oil production. This will hit the CAD, because export revenues will be smaller and hence, budget profit lower. Quite the opposite happens when demand is growing. That’s why Crude inventories - Oil storage data from US that is usually released on Wednesdays is very important.Pipruit: But Sir, it could change just for some millions of barrels? Why it is so important, if this is smaller than the daily consumption in US?
Commander in Pips: The reason in tendency. This data is very similar to weekly claims. Who cares that Initial claims rise just for 5,000 people – this is very few in the scale of the whole country. But this could be as 5K on current week, 7 K on next one and so on. Then, when you will compare two numbers, say in the beginning of the quarter and at the end of it – you’ll see the tendency. The same is with the weekly crude inventories. If week by week, reserves are falling – it means that consumption is growing.
Currently many forex brokers allow you to day trade commodities and have the ability to look and analyze charts. But it they don’t, you may use the same Commodity Futures & FOREX Charts | Commitments of Traders Database
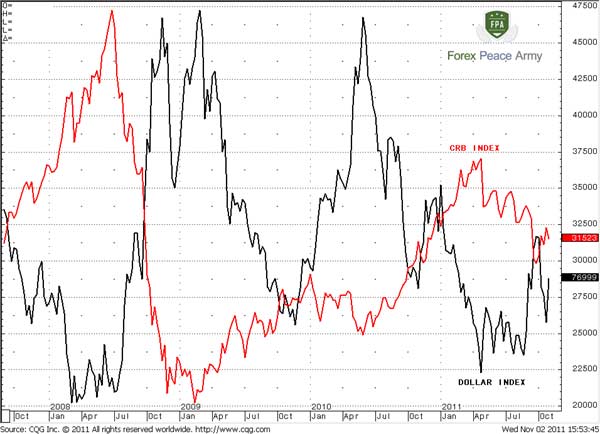
And the last thing - just to finish with commodities… As with the forex market, an index exists on the commodities markets. This is the Commodities Research Bureau Index – this index includes the prices of all major commodities – energies, metals, food, industrials etc… In fact the CRB Index is a barometer of Commodities just as as the Dollar Index is a barometer of the forex market in general and Dollar value in particularly. On the following chart you may see that there is rather strong negative correspondence between these two indexes:
Chart #5 | CRB and Dollar Indexes – weekly chart
Comments
Table of Contents
- Introduction
- FOREX - What is it ?
- Why FOREX?
- The structure of the FOREX market
- Trading sessions
- Where does the money come from in FOREX?
- Different types of market analysis
- Chart types
- Support and Resistance
- Candlesticks – what are they?
- Mysterious Fibonacci
- Introduction to Moving Averages
- Bollinger Bands
- Leading and Lagging Indicators
- Basic chart patterns
- Pivot points – description and calculation
- Elliot Wave Theory
- Intro to Harmonic Patterns
- Divergence Intro
- Harmonic Approach to Recognizing a Trend Day
- Intro to Breakouts and Fakeouts
- Again about Fundamental Analysis
- Cross Pair – What the Beast is That?
- Multiple Time Frame Intro
- Market Sentiment and COT report
- Dealing with the News
- Let's Start with Carry
- Let’s Meet with Dollar Index
- Intermarket Analysis - Commodities
- Trading Plan Framework – Common Thoughts
- A Bit More About Personality
- Mechanical Trading System Intro
- Tracking Your Performance
- Risk Management Framework
- A Bit More About Leverage
- Why Do We Need Stop-Loss Orders?
- Scaling of Position
- Intramarket Correlations
- Some Talk About Brokers
- Forex Scam - Money Managers
- Graduation!