Part II. Mechanical System Creation Framework


1. Develop the common idea of your trading system. That will narrow the search for the necessary tools. For instance, if you intend to create a “follow the trend” system, you may need MA, MACD, ADX or SAR or some other trend indicators. If you would like to create some breakout systems – probably you will need Bollinger Bands or Detrended oscillator (for volatility breakout). If you would like to trade some patterns – you need an application that will recognize them and so on. This will help you just to stay focused;
2. Determine on what time frame you intend to trade (apply your trading system). Our previous chapters will help you to do that – what kind of trader you are, what is your risk threshold and so on;
3. Create the tools’ list that could help you to estimate what you want to do. For instance, you would like to create a “following the trend” system. So, here you have to specify which indicators and tools could help you. One obvious decision is those that we’ve already mentioned today – MA, MACD and other trend indicators. The most simple are different MA, of course and their combinations. If you forget how they could be used for trend identification – read the corresponding chapter in our School;
4. Estimate tools, that could let you get some confirmation signal. You have tools or indicators that show you potential trend shifting moments, but you also want to get as much confidence with that as you can. You want to check the surety of each signal somehow, because you also want to avoid failure signals and whipsaw action, or at least to minimize these. For instance you may combine some MA or two MAs crossing as indicators for trend estimation and MACD or some oscillators, say RSI or Stochastic as confirmation indicators;
5. Assess your risk threshold. You have to define how much you are ready to lose in a single trade. This will help you to estimate stop order placement and adjust trading lot size. One thing that you should take into account is that the market needs some space to breath, so do not lock it too tightly with your stop. It is better to reduce trading lot size and place stop a bit farther. First, this will give room for the market to breath and second, you will be confident that if the market has triggered such a far stop, then probably the situation is really changing. In other words you will avoid occasional fakes and unwelcome stop outs.
6. Define how you will enter and exit from the trade – both with profit as well as with loss. This is very important. Will you enter immediately as a signal comes, or you will wait 1-3 bars in the direction of signals, or maybe you will wait for the first retracement to enter. Or maybe you will anticipate the close price of the current bar and take as early of a signal as you can (although we do not recommend it). This depends on your trading style. The same is with your exit point – will you use just a reverse signal and reverse your position, or you will use some predefined move target, maybe fib extensions, overbought/oversold conditions – there are a lot of options here. You even can use just equal distance of moving in your favor in every trade. Also your system has to match risk criteria. For instance, if it generates, say, a Buy signal, it has to check the area where the stop loss order has to be placed and the distance to it with your loss limit. If this distance is greater, then the system should reduce lot size or skip the trade. As you can see there are a lot of nuances here…
7. Create a flow graph. Try to pass through the system manually first. You have to follow to your system, and you trust it to generate the signals, that you intend to follow. That’s why it is so important to make a flow graph and understand how the system will follow and “think” according to your rules. This will help you to eliminate some obvious mistakes.
8. Test your system with hardware. There are two ways of testing it as to follow it in real trading.
You can do it manually or automatically. You can do it manually if you are not so friendly with programming. This could be done as follows:
- Find a historical chart for a significant period of time.
- Move to the first candle, from which you intend to start the system
- Then move candle by candle and fix in an Excel sheet all information according to your system – where you enter, place stop, profit and actual exit (with profit or loss). The major requirement here is to be honest with yourself. It’s better to understand that your system is junk on historical data, rather than on real account and lose the rest of the money that you still have…
- If back testing has given you acceptable results – you have to trade with this system in real-time on a demo account, probably 2-3 months will be acceptable, if you have chosen as your preferable time frame daily or lower;
- If trading on demo leads to a good result, you may shift to a real account.
If the computer is your friend and you are a second Bill Gates, then you can try to program your system with a built-in language, say in MT 4 software. In this case you will spend most of your time on programming, rather than on testing. This method has huge advantage:
- When a system’s program is prepared, the back testing procedure (at least running through historical period) is much faster than with the manual approach;
- You may delegate the possibility to make trades and place orders to the system directly;
- You may apply fine tuning to the parameters of the system, adjust risk and money management parameters very fast and see the results. Manual adjustment will force you to pass manually through the same historical chart again and again – this will demand a lot of time.
- Automated testing of the system excludes all human being biases mistakes and other errors.
During testing on a historical chart pay attention to price action – whether it trending or ranging and take a look how your system works in these two different environments. The results chart of your system performance should not repeat the price chart and should not have any significant drawdown. Your assets should increase gradually without significant falls and jumps both in a period of ranging markets as well as in a period of trending – both down and up trends. These are the initial signs of a good system. Second, during the testing period, the system should generate at least 30-40 trades. If it will generate 100 or more – all the better.

Commander in Pips: Here we will try to create some trading system. Since we do not have time for its programming and testing on computer – we will do it manually. Also, just to not make it too complicated, we will apply relatively simple rules. This is just an example, and I do not know if this system will be profitable in the long run. Also we will not make any back testing, adjustments or fine tuning of this system. Our task here is just to show how to make a detailed specification or algorithm of a system. Let’s go with our plan that we’ve just discussed:
1. Develop the common idea of your trading system.
We will not search something “really special” – our system will be built on MA crossing.
2. Determine at what time frame you intend to trade (apply your trading system).
Our trading period will be based on the daily chart.
3. Create the tools’ list that could help you to estimate what you want to.
We will use DMA and Oscillator. I offer you to use simple 7x5 DMA as a signal line. If you remember 7x5 DMA means 7-period Moving Average shifted forward for 5 periods. Since our system will be based on MA trading we could treat it as “swing trading system”. But still we will add some feature – we will use Oscillator for estimation of oversold and overbought conditions to place orders and to filter signals.
4. Estimate tools, that could let you get some confirmation signal.
Since our system mostly based on trend catching, we will try to use MACD as a confirmation indicator of trend shifting.
5. Assess your risk threshold
We will not risk more than 100 pips in every trade. Applying 2% rule, we might say that if your account is 5000 USD, you have to trader with 0.05 standard lot or less, if 10 K USD – 0.1 lot or less.
6. Define how you will enter and exit from the trade – as with profit as with loss.
Here is our trading algorithm:
Enter Long:
- MACD (8.3897;17.5185;9.0503) stands bullish at close;
- Price has penetrated and closed above 7x5 DMA on previous day;
- Oscillator (1;7) stands between (-248 ;241) – we treat it as market neither at oversold nor at overbought;
- Place stop-loss order at 100 pips. Move stop loss at breakeven after 40 pips move in favor of opened position.
Enter Short:
- MACD (8.3897;17.5185;9.0503) stands bearish at close;
- Price has penetrated and closed below 7x5 DMA on previous day;
- Oscillator (1;7) stands between (-248 ;241) – we treat it as market neither at oversold nor at overbought;
- Place stop-loss order at 100 pips. Move stop loss at breakeven after 40 pips move in favor of opened position.
Exit rules
1. Oscillator (1;7) reaches -248 or 241. (profit taking);
2. Price crosses 7x5 DMA in opposite direction;
3. Price reaches stop loss order.
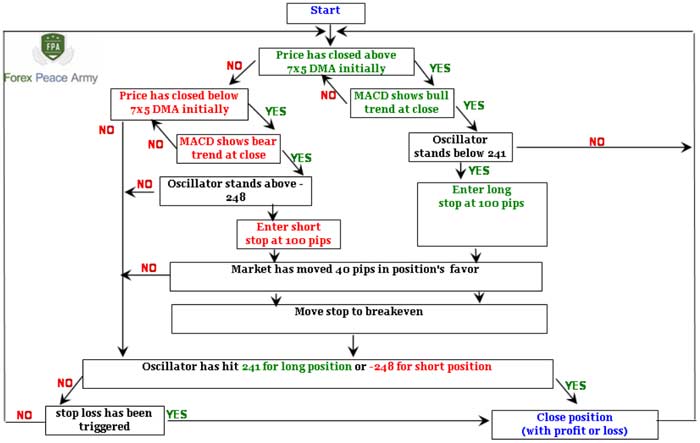
Create a flow graph. Try to pass through the system manually first
Here is our flow graph. I do not pretend on absolute perfection, somebody of you definitely will make this more effective and optimized, this is just an example. This algorithm has two advantages. First, at any situation it will show you what you have to do. Second, it is adopted to make a program.
Test your system with hardware.
We will not test it with hardware, because it will be very difficult to show it in writing and describe the process, but we will pass through it manually and watch what will happen. Our start point is 1.42 area on daily time frame in May. I will show you testing with details initially. We will assume that our trading prices are close prices at corresponding days. During rest of the period we will show just results:
Chart #1 | EUR/USD Daily and All Necessary Indicators
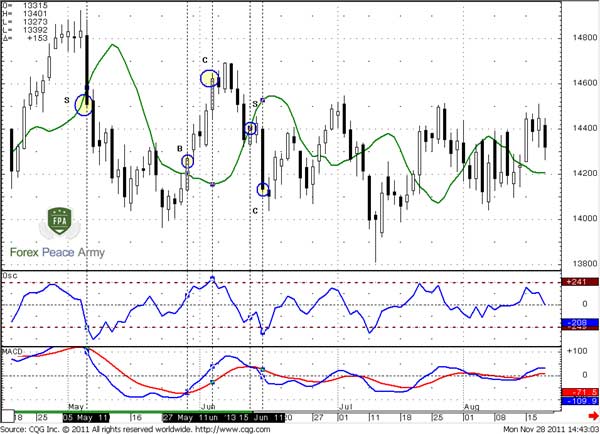
1. Our first signal at 05 May, 2011. We do not take this signal, since oscillator at -248 – market is oversold.2. Next signal is on 27 May, 2011. We’ve entered and exit 11 June, since oscillator has hit 241 level of overbought. Our stop has not been triggered, profit 354 pips;
3. 13 June 2011 Sell signal at 1.4394 (stop was not triggered; high on next day was at 1.4456). Exit 15 June at 1.4132 due to oscillator signal. Profit 262 pips;
4. The next trade will be on 29 June at 1.4416 (not shown). On the next day our stop loss was moved to breakeven, since market has passed 40 pips in our favor. But this trade has not led to profit, since position was not closed due oscillator (it has not quite reached 241 level), so our stop has been triggered.
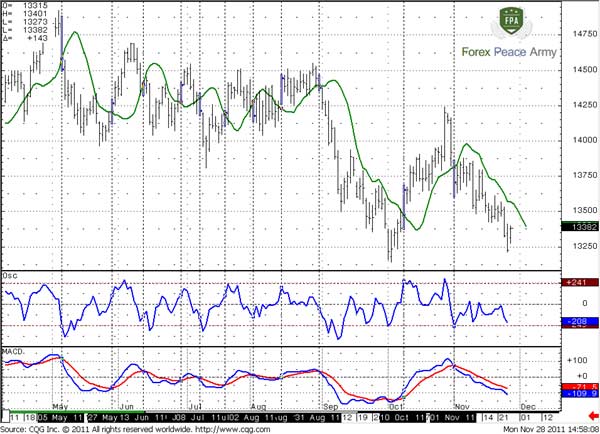
5. And so on… Here is a second chart, if you want to pass through this system:
Chart #2 | EUR/USD Daily - All Necessary Indicators and Trades
Pipruit: Cool! I really start to like this stuff. With your example this is much easier to understand. Still, I want to ask you something.
Pipruit: If I’m not friendly with programming. Can I trade mechanically but manually?
Commander in Pips: I understand what you are speaking about. The answer is yes, but this process still demands discipline. You should not force a real number to be what you want to make a trade happen. Say, if oscillator stands at 240 – you should not close position, because your level is 241. Ok, this is a bit overacting example, but you get it. Probably it makes sense to have a table for every trading day:
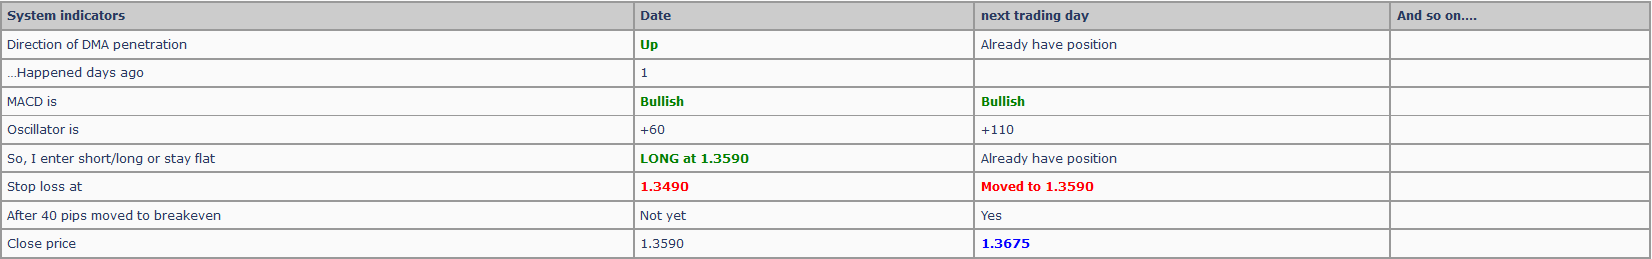
So, this stuff let you become a habit with hard rock discipline. This is like social revue – just mark yes/no in corresponding lines and you will see do you have to enter or not just yet. This could be done even in excel, when you enter numbers and it will show you actual result – buy, sell or stay flat (with multiple “IF-THEN” function).
So, this stuff let you become a habit with hard rock discipline. This is like social revue – just mark yes/no in corresponding lines and you will see do you have to enter or not just yet. This could be done even in excel, when you enter numbers and it will show you actual result – buy, sell or stay flat (with multiple “IF-THEN” function).
Commander in Pips: Yes, this system is simple, and so what? What is better – to make money with a simple system, or lose money with a sophisticated system?
Commander in Pips: That’s it. The point is that most systems that work are relatively simple. They just have some feature that adds unique qualities particular to it. If you think that applying a spaghetti chart with some hundreds of indicators makes system better, then you’re wrong. There are hard-programmed “black box” systems, that probably make money, but I’m not very comfortable with them. In this case you have to rely on something that you do not understand and can’t control. All that you can do is just trust the programmers and their promises. This is also the reason why I suppose it is better to make systems by yourself. At least create and algorithm and pay for it’s programming. Here you still know the principle how your system works.
Commander in Pips: Not all of your trades by some system will be successful. In general, if your system generates 50-60% of profitable trades and avoids large drawdowns – it is not a bad one.
Commander in Pips: I understand what you are speaking about. The answer is yes, but this process still demands discipline. You should not force a real number to be what you want to make a trade happen. Say, if oscillator stands at 240 – you should not close position, because your level is 241. Ok, this is a bit overacting example, but you get it. Probably it makes sense to have a table for every trading day:
Pipruit: Yes, I will definitely do that if I start with systems… Commander, don’t you think that this system is too simple?
Pipruit: Well, I will choose the former.
Commander in Pips: That’s it. The point is that most systems that work are relatively simple. They just have some feature that adds unique qualities particular to it. If you think that applying a spaghetti chart with some hundreds of indicators makes system better, then you’re wrong. There are hard-programmed “black box” systems, that probably make money, but I’m not very comfortable with them. In this case you have to rely on something that you do not understand and can’t control. All that you can do is just trust the programmers and their promises. This is also the reason why I suppose it is better to make systems by yourself. At least create and algorithm and pay for it’s programming. Here you still know the principle how your system works.
Pipruit: Probably you’re right.
Comments
S
Sazu
12 years ago,
Registered user
Greetings Sive, Just a simple question. Is there really a Bot that actually works and if so who or what is it's name? I have yet to find one that does work and based upon the FPA findings am Leary that one actually does exist!
I have heard all the claims that are being made by the developers and such, but have to this day not found one that produces the results they claim. My background before I got involved in FX was a automated testing engineer for financial software among others. In the years that I have been testing all failed to produce positive results close to what was stated.
Thanks for your great efforts and knowledge.
G
geodepe
12 years ago,
Registered user
Typos:
"Here our task not",
"or you will ",
"follow to your system",
"as to follow it"
"Here our task not",
"or you will ",
"follow to your system",
"as to follow it"

Rage
12 years ago,
Registered user
Hello Sive, might I mention that when creating a bot instead of trading it manually or back testing you can use "Print" statements instead of buy or sell statements on bots created in MT4 that will write to Experts logs. Using this it's possible to see how the bot traded on actual data without committing to placing the bot on a demo account. If I may.......to Sazu's question they have a "Automated Trading Championship" whereby bots created compete against each other for overall profitability. Just google "Automated Trading Championship".

AsstModerator
12 years ago,
Registered user
> Typos:
"Here our task not",
Task not what your country can do for you - task what you can do for your country.
If I ever get caught up on all the other things I do around here, I'll make a second pass through all the FMS lessons to clean them up a little more.
"Here our task not",
Task not what your country can do for you - task what you can do for your country.
If I ever get caught up on all the other things I do around here, I'll make a second pass through all the FMS lessons to clean them up a little more.
A
Amon Mitch
12 years ago,
Registered user
Dear Sive,
I wanted to code an small EA that does the example in this thread, but I wonder what Oscillator (1;7) is!
I wanted to code an small EA that does the example in this thread, but I wonder what Oscillator (1;7) is!

Sive Morten
12 years ago,
Registered user
> Dear Sive,
I wanted to code an small EA that does the example in this thread, but I wonder what Oscillator (1;7) is!
Hi Amon Mitch.
Well, that could be interesting. You can download this indicator here - right below the major lesson:
https://www.forexpeacearmy.com/forex-books/107/chapter-12-part-vi-detrended-oscillator-and-momentum-indicator
M
Marky$
11 years ago,
Registered user
Hi Sive,
I've developed some strategy and backtested it.
Could you take a look at results and comment them, please.
It has textbook parameters of Risk/Reward ratio 1:3 and 2% risk per trade.
I'm worried about Relative drawndown.
The Win Ratio and Profit Factor aren't impressive. But I've read in some books that they aren't most important. The most important is Expected payoff.
The results are for one and a half of year back from now. The overall return looks quite good. I've started it in a real time on demo account. If it will work in that way in real time I gonna start it on a live account and look for sweet home on the Caribbean :)
https://www.forexpeacearmy.com/community/s3/attachments/6/6974-565bcc7872a23f0b3eb3278f4844d8ab.jpg
Sive Morten
11 years ago,
Registered user
> Hi Sive,
I've developed some strategy and backtested it.
Could you take a look at results and comment them, please.
It has textbook parameters of Risk/Reward ratio 1:3 and 2% risk per trade.
I'm worr..
Hi Marky, looks nice - may be you will place it on real-time testing on FPA site (does FPA now accept demo accounts for trading systems)?
Table of Contents
- Introduction
- FOREX - What is it ?
- Why FOREX?
- The structure of the FOREX market
- Trading sessions
- Where does the money come from in FOREX?
- Different types of market analysis
- Chart types
- Support and Resistance
- Candlesticks – what are they?
- Mysterious Fibonacci
- Introduction to Moving Averages
- Bollinger Bands
- Leading and Lagging Indicators
- Basic chart patterns
- Pivot points – description and calculation
- Elliot Wave Theory
- Intro to Harmonic Patterns
- Divergence Intro
- Harmonic Approach to Recognizing a Trend Day
- Intro to Breakouts and Fakeouts
- Again about Fundamental Analysis
- Cross Pair – What the Beast is That?
- Multiple Time Frame Intro
- Market Sentiment and COT report
- Dealing with the News
- Let's Start with Carry
- Let’s Meet with Dollar Index
- Intermarket Analysis - Commodities
- Trading Plan Framework – Common Thoughts
- A Bit More About Personality
- Mechanical Trading System Intro
- Tracking Your Performance
- Risk Management Framework
- A Bit More About Leverage
- Why Do We Need Stop-Loss Orders?
- Scaling of Position
- Intramarket Correlations
- Some Talk About Brokers
- Forex Scam - Money Managers
- Graduation!