Part V. Rectangles


Chart #1 | 4-hour GBP/USD. Rectangle
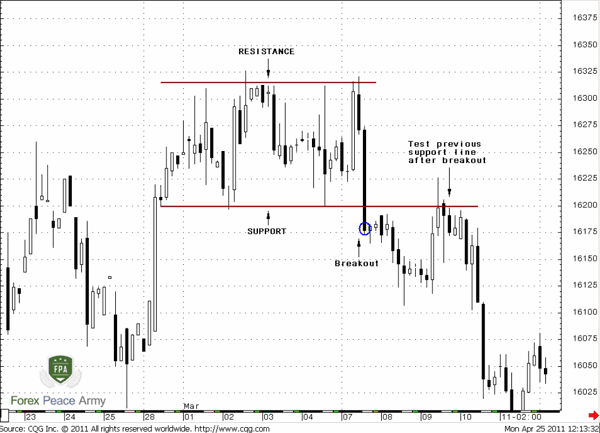
So, here we can see a rectangle that leads to reversal on the market. But there are continuation rectangles as bullish as bearish exist also. A rectangle mostly an “indecision” pattern, and the major importance here belongs to the direction of breakout and price ability to hold in this direction.
Pipruit: Ok, I see.
Commander in Pips: Now a couple of words about bullish and bearish rectangles.
Bearish rectangle forms when some downward price’s move precedes the appearance of the rectangle. Then price consolidates for some time inside the rectangle body before th down move will continue. This happens, because sellers need to take a pause – may be some sellers partially fix profit; others use small pullbacks to enter the market. Intraday speculators use these moves to earn some short-term profit. But then when market makes a decision, all participants finish with arrangement of their positions and the market continues the move down.
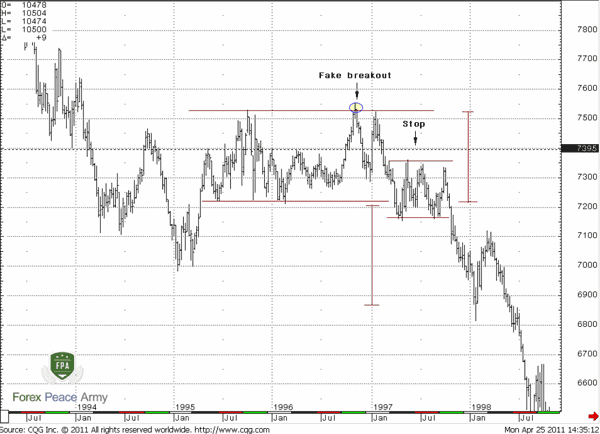
Commander in Pips: As you can see on chart #2 it’s hard to see a perfect rectangle. More often you will meet blur and choppy consolidation. Here by the way you can see that after a large rectangle, the market was trapped in a smaller one.
Chart #2 | Weekly CAD/USD. Bearish Rectangle
Bullish rectangle
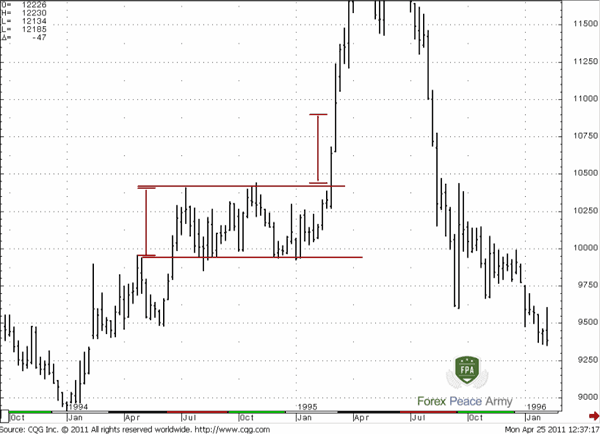
Commander in Pips: You can see on chart #3 – the context for its appearing is the same. The market shows a nice move up and then turns to some consolidation to take a breath. Then it shows an excellent breakout and continues its move up.
Chart #3 | Weekly JPY/USD. Bullish Rectangle
Commander in Pips: Now let’s discuss how to trade rectangles and some nuances of their trading.
Trading Rectangles
1. The target of rectangle, almost as with a wedge pattern, usually equals the height of rectangle itself in the direction of breakout. So, I’ve marked for you this distance on charts #2 and #3 and the market easily has reached it. Some traders use as a target double the height of rectangle. But the one height is the nearest target, the most probable one;
2. As we can see rectangles could be a continuation or a reversal. In reality we don’t know it in advance. That’s why it safer to wait until a breakout will happen and only after that pull the trigger. Although sometimes the market gives an early signs of its intentions.
3. The market very often shows fake breakouts of Rectangles. In classical books it is called a “bear trap” if it was a failed downward breakout or a “bull trap” if it was upward breakout failure. By the way, you can see a “bull trap” on Chart #2. This is some kind of Wash&Rinse. If the market shows a breakout failure and returns back into the body of rectangle – usually with great probability the market will reach the opposite border of rectangle. So, you may open positions in the opposite direction to a fake breakout when the market will return inside the rectangle’s body with a stop beyond the extreme of the breakout. Say, on chart #2 you could enter Short after the market has closed inside the body of the rectangle with stop above the high in circle. Near the lower border of the same chart you may see shallow “bear trap” that also has led to a move to the upper border of rectangle.
Usually it could happen if some Fib extension that based on ABC pattern inside rectangle gives 0.618 or 1.0 extension targets slightly outside the border of rectangle.
4. It is better does not try to anticipate the direction of a breakout and enter on some retracement after a breakout has happened. For instance, as on chart #1 – here you can see a nice retracement back to the lower border of the rectangle. Stop should be placed above the middle of the rectangle range, or even above the highs that point on the middle of the range – like on chart #2. Here is black dash line shows not only middle of rectangle but also it builds on highs that mark this middle.
5. Also you may apply the same rules of trading as with a wedge pattern. It will allow you to open a position before breakout, if and only if the market shows you clear signals – some patterns inside the rectangle, support of trend, if market couldn’t reach the opposite border of rectangle and returns right back etc.
6. If the market moves above/below the middle of rectangle and consolidates near upper/lower border, then it is more probable that a breakout will happen in the direction of this border – up/down. On chart #2 you can see that after the big rectangle, the market turns to a small one, but couldn’t move above the middle of big rectangle. This should tell you two important moments. First, the bulls are weak, since they can’t move market higher, second, the market is building up energy, because now t stands in a much tighter range, it’s like a compressed spring. So, we know that the energy is high, and the market tends to decompressing, and we know that this release should be down, because the market couldn’t move above the middle of big rectangle.
I hope these simple rules will help you to deal with rectangles. Market behavior is very logical. If it becomes non logical, then it means that somebody skewed it. It’s better to stay aside during such moments. Also it confirms again, that a stop loss order is a must.
Bullish rectangle
Commander in Pips: You can see on chart #3 – the context for its appearing is the same. The market shows a nice move up and then turns to some consolidation to take a breath. Then it shows an excellent breakout and continues its move up.
Chart #3 | Weekly JPY/USD. Bullish Rectangle
Commander in Pips: Now let’s discuss how to trade rectangles and some nuances of their trading.
Trading Rectangles
1. The target of rectangle, almost as with a wedge pattern, usually equals the height of rectangle itself in the direction of breakout. So, I’ve marked for you this distance on charts #2 and #3 and the market easily has reached it. Some traders use as a target double the height of rectangle. But the one height is the nearest target, the most probable one;
2. As we can see rectangles could be a continuation or a reversal. In reality we don’t know it in advance. That’s why it safer to wait until a breakout will happen and only after that pull the trigger. Although sometimes the market gives an early signs of its intentions.
3. The market very often shows fake breakouts of Rectangles. In classical books it is called a “bear trap” if it was a failed downward breakout or a “bull trap” if it was upward breakout failure. By the way, you can see a “bull trap” on Chart #2. This is some kind of Wash&Rinse. If the market shows a breakout failure and returns back into the body of rectangle – usually with great probability the market will reach the opposite border of rectangle. So, you may open positions in the opposite direction to a fake breakout when the market will return inside the rectangle’s body with a stop beyond the extreme of the breakout. Say, on chart #2 you could enter Short after the market has closed inside the body of the rectangle with stop above the high in circle. Near the lower border of the same chart you may see shallow “bear trap” that also has led to a move to the upper border of rectangle.
Usually it could happen if some Fib extension that based on ABC pattern inside rectangle gives 0.618 or 1.0 extension targets slightly outside the border of rectangle.
4. It is better does not try to anticipate the direction of a breakout and enter on some retracement after a breakout has happened. For instance, as on chart #1 – here you can see a nice retracement back to the lower border of the rectangle. Stop should be placed above the middle of the rectangle range, or even above the highs that point on the middle of the range – like on chart #2. Here is black dash line shows not only middle of rectangle but also it builds on highs that mark this middle.
5. Also you may apply the same rules of trading as with a wedge pattern. It will allow you to open a position before breakout, if and only if the market shows you clear signals – some patterns inside the rectangle, support of trend, if market couldn’t reach the opposite border of rectangle and returns right back etc.
6. If the market moves above/below the middle of rectangle and consolidates near upper/lower border, then it is more probable that a breakout will happen in the direction of this border – up/down. On chart #2 you can see that after the big rectangle, the market turns to a small one, but couldn’t move above the middle of big rectangle. This should tell you two important moments. First, the bulls are weak, since they can’t move market higher, second, the market is building up energy, because now t stands in a much tighter range, it’s like a compressed spring. So, we know that the energy is high, and the market tends to decompressing, and we know that this release should be down, because the market couldn’t move above the middle of big rectangle.
I hope these simple rules will help you to deal with rectangles. Market behavior is very logical. If it becomes non logical, then it means that somebody skewed it. It’s better to stay aside during such moments. Also it confirms again, that a stop loss order is a must.
Comments

Hamza Samiullah
6 years ago,
Registered user
nice work
Table of Contents
- Introduction
- FOREX - What is it ?
- Why FOREX?
- The structure of the FOREX market
- Trading sessions
- Where does the money come from in FOREX?
- Different types of market analysis
- Chart types
- Support and Resistance
- Candlesticks – what are they?
- Mysterious Fibonacci
- Introduction to Moving Averages
- Bollinger Bands
- Leading and Lagging Indicators
- Basic chart patterns
- Pivot points – description and calculation
- Elliot Wave Theory
- Intro to Harmonic Patterns
- Divergence Intro
- Harmonic Approach to Recognizing a Trend Day
- Intro to Breakouts and Fakeouts
- Again about Fundamental Analysis
- Cross Pair – What the Beast is That?
- Multiple Time Frame Intro
- Market Sentiment and COT report
- Dealing with the News
- Let's Start with Carry
- Let’s Meet with Dollar Index
- Intermarket Analysis - Commodities
- Trading Plan Framework – Common Thoughts
- A Bit More About Personality
- Mechanical Trading System Intro
- Tracking Your Performance
- Risk Management Framework
- A Bit More About Leverage
- Why Do We Need Stop-Loss Orders?
- Scaling of Position
- Intramarket Correlations
- Some Talk About Brokers
- Forex Scam - Money Managers
- Graduation!