Part III. Parabolic SAR - Stop And Reversal

Commander in Pips: Today we will talk about the Parabolic Stop And Reversal indicator, better known as Parabolic SAR. Previously we’ve studied some indicators that could be used for identification of a moment, when new trend has possibly started. But the moment when a trend could end is also important as well. For that purpose we can use the Parabolic SAR indicator.
Pipruit: Yes, we should have good point for entry, but of the same importance is to also have good point for exit…
Chart #1 | EUR/USD Weekly and Parabolic SAR
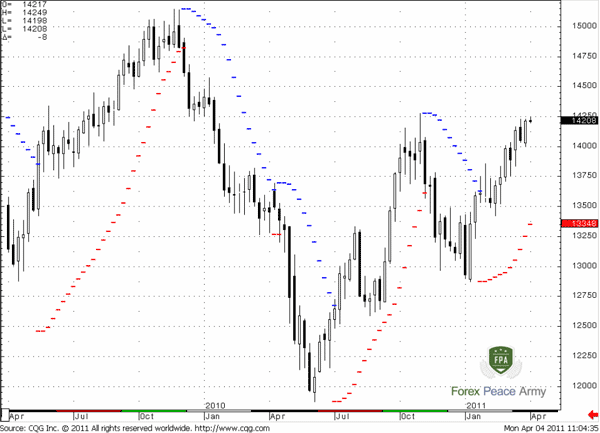
As you can see Parabolic SAR places dashes, sometimes it could be dots that indicate potential reversals in price movement. The indicator stands below candle chart in an uptrend and above it in a downtrend. A particular line (blue or red) holds in some distance from the market price action until the price will cross it. If it happens – the indicator “suggests” that the trend has shifted and it moves in opposite area. For instance if it holds above the market and indicates a down trend – after price will touch it, it moves below the market and indicates an uptrend. That’s simple. The shorter the distance between indicator’s line and price – the nearer the moment of possible trend ending the trend.Pipruit: And how is it calculated?
Pipruit: Now I’m not sure already…
SARTomorrow = SARToday+AF(EPTrade – SARToday) where:
AF begins at 0.020 (default value) and is increased by .02 each bar that a new high/low is made (depending on the trend direction) until a value of 0.20 is reached; EP = Extreme Price point for the trade made so far (if Long, EP is the extreme high price for the trade; if Short, EP is the extreme low price for the trade).
Thus, the Parabolic Time/Price System rides the trend until the SAR price is penetrated. Then the existing position is closed out and the reverse position is opened.
Pipruit: I should not ask questions like that…
- Step value – how much SAR value will increase when new extreme will appear;
- Start value of indicator;
- Max value of indicator.
Using Parabolic SAR
The application of this indicator relatively simple, because Parabolic SAR suggests that the market could be only in one condition – uptrend or downtrend. As other trend indicators it gives excellent results on trending markets with long swings and much less satisfactory results on ranging markets. The problem still, as you understand, is the same –we can’t know in advance if the market will be ranging market or trending…
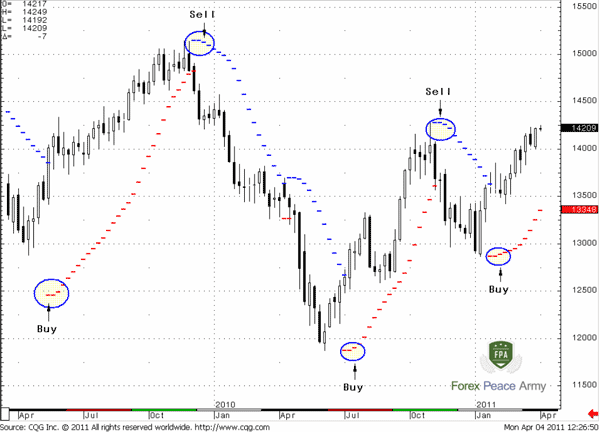
But, in general, when dashes/dots of indicator are above price – it’s a Sell signal, if dash/dots are below price action – it’s a Buy signal.
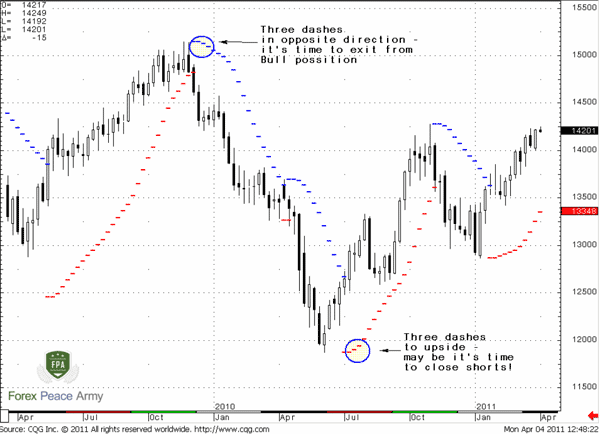
Also Parabolic SAR could be used not only for estimation of a possible starting point of a new trend, but also the point, when this trend could come to an end. We will show you how it could be done by applying three opposite dashes:
Look at chart #3. See, when three dashes have appeared in opposite direction – it’s time to exit from position. You can see it again and again. If you somehow have decided in these circumstances hold your positions despite everything – then you have been very disappointed with results… Because when Parabolic SAR has created opposite signal – market has turned to trend that is totally erased previous one. Not bad, ha?
Chart #3 | EUR/USD Weekly and Parabolic SAR
Commander in Pips: Sure, but this is the sphere of tuning work for the indicator. Again, as with others – if you like Parabolic SAR, you should experiment much to find the most useful tuning parameters for you on particular pairs and time frames, as rules that you will apply to trend shifting identification.
Commander in Pips: Sure, but this is the sphere of tuning work for the indicator. Again, as with others – if you like Parabolic SAR, you should experiment much to find the most useful tuning parameters for you on particular pairs and time frames, as rules that you will apply to trend shifting identification.
Commander in Pips and Pipruit in chorus: And you should not rely just on a single indicator.
Commander in Pips: Right, you’ve got my thought – the same as with all other indicators.
- Start value of indicator;
- Max value of indicator.
Using Parabolic SAR
The application of this indicator relatively simple, because Parabolic SAR suggests that the market could be only in one condition – uptrend or downtrend. As other trend indicators it gives excellent results on trending markets with long swings and much less satisfactory results on ranging markets. The problem still, as you understand, is the same –we can’t know in advance if the market will be ranging market or trending…
But, in general, when dashes/dots of indicator are above price – it’s a Sell signal, if dash/dots are below price action – it’s a Buy signal.
Chart #2 | EUR/USD Weekly and Parabolic SAR
Also Parabolic SAR could be used not only for estimation of a possible starting point of a new trend, but also the point, when this trend could come to an end. We will show you how it could be done by applying three opposite dashes:
Look at chart #3. See, when three dashes have appeared in opposite direction – it’s time to exit from position. You can see it again and again. If you somehow have decided in these circumstances hold your positions despite everything – then you have been very disappointed with results… Because when Parabolic SAR has created opposite signal – market has turned to trend that is totally erased previous one. Not bad, ha?
Chart #3 | EUR/USD Weekly and Parabolic SAR
Pipruit: And could we use not three but two, or, say, four dashes against the previous trend?
Pipruit: And how it could be possible?
Commander in Pips and Pipruit in chorus: And you should not rely just on a single indicator.
Commander in Pips: Right, you’ve got my thought – the same as with all other indicators.
Comments
O
Oluwaseun
8 years ago,
Registered user
Thank you Commander for this wonderful lessons

Hamza Samiullah
6 years ago,
Registered user
Excellent Work..
O
One-fm
5 years ago,
Registered user
Kudos to Commander in Pips for this great piece
Table of Contents
- Introduction
- FOREX - What is it ?
- Why FOREX?
- The structure of the FOREX market
- Trading sessions
- Where does the money come from in FOREX?
- Different types of market analysis
- Chart types
- Support and Resistance
- Candlesticks – what are they?
- Mysterious Fibonacci
- Introduction to Moving Averages
- Bollinger Bands
- Leading and Lagging Indicators
- Basic chart patterns
- Pivot points – description and calculation
- Elliot Wave Theory
- Intro to Harmonic Patterns
- Divergence Intro
- Harmonic Approach to Recognizing a Trend Day
- Intro to Breakouts and Fakeouts
- Again about Fundamental Analysis
- Cross Pair – What the Beast is That?
- Multiple Time Frame Intro
- Market Sentiment and COT report
- Dealing with the News
- Let's Start with Carry
- Let’s Meet with Dollar Index
- Intermarket Analysis - Commodities
- Trading Plan Framework – Common Thoughts
- A Bit More About Personality
- Mechanical Trading System Intro
- Tracking Your Performance
- Risk Management Framework
- A Bit More About Leverage
- Why Do We Need Stop-Loss Orders?
- Scaling of Position
- Intramarket Correlations
- Some Talk About Brokers
- Forex Scam - Money Managers
- Graduation!