Part VII. Average Directional Move Index – ADX

Commander in Pips: There are a lot of different indicators were invented during the most recent 20 years, and of course we can’t discuss all of them. So, I think, that we should finish discussion of particular indicators with this one – Average Directional Move Index, better known as ADX. This indicator also consists of a single line, and the major purpose of this indicator is the estimation of different phases of a trend. So it’s used for work with trend. The specific of ADX is that it does not show direction of trend, but only its strength. ADX is always positive and changes in 0-100 range. At the same time, this indicator rarely move above 50-60 level.
Pipruit: This is something new…
Pipruit: Thanks Commander, I owe you one.
Commander in Pips: You’re welcome. So, let’s shift directly to application of ADX:
Chart #1 | GBP/USD Weekly and ADX (10)

ADX has only single tuning parameter – the number of periods, prices of which will be used for ADX calculation. The greater this period the more lazy and smooth the ADX line and the more rarely it will show significant moves. Here on the chart we have a 10-period ADX.Chart #1 | GBP/USD Weekly and ADX (10)
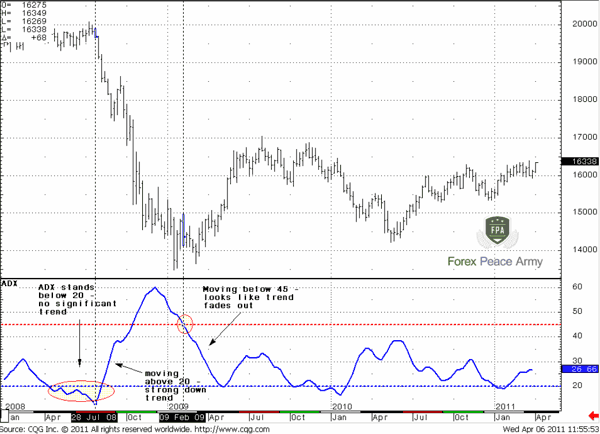
In general there are 4 signals that created by ADX Indicator:1. When ADX stands in 20-25 range, then there is no significant trend on the market. Usually it happens when market volatility is shallow and market shows sideways move or stays in the range. On our chart you can see, that in beginning of 2008 and at the end of 2009 the market stands in range, so there was not a significant trend in this period.
2. When ADX rises above 25 and shows some acceleration towards the 40-50 area, then it points to a trend acceleration and its growing power.
3. As a derivative from the previous point, the jump of ADX by more than 3 points in two side-by-side trading sessions is an early warning that a trend has appeared. This property is very useful and popular amongst traders that use ranging strategies. For instance, if ADX has jumped for 3 points – then the possibility exists that market is turning to trend action and it’s time to exit. This is like a filter to understand whether the market in ranging price action or trending;
4. When ADX starts to decrease down from the 40-50 area it points that the power of trend is becoming weaker, and it starts to exhaust. This is an early caution, that possibly it’s time for gradual exit if you still hold your position with the trend.
All these scenarios you can see on Chart #1. Pay attention, as we’ve said that ADX does not show direction of the trend, it does not give you “Buy” or “Sell” signals. It’s just tells you how strong is the trend, whatever direction it is.
ADX signals are better to use as a confirmation of some possible breakouts. If, for instance, market has shown downward break and ADX jumps at least for 3 points, and after couple of days moves above 25 – then it confirms that possibly a new bear trend has appeared. Then, you may use the nearest retracement to Fib resistance for entering a trade.
Because of the fact that ADX does not tell you whether buy or sell, it’s obvious that you should use it with other indicators. And, finally, according to last 4th point – it could give you early notification, when it starts to decrease below 40, that possibly, it is time to close your position.
Pipruit: Hm, interesting indicator. Possibly I will use it.
Commander in Pips: Yes, it could be useful. Of course you will have to experiment with them first, to study how to use it, and to find appropriate tuning parameters.
Comments
G
Gumrai
12 years ago,
Registered user
The standard ADX with the MT4 platform includes the DI+ and DI-, this can be useful as when the DI+ crosses above the DI- it indicates a bullish trend and vice versa

4xpipsense
11 years ago,
Registered user
The ADX in my mt4 chart has about 3 lines. Get confused most time.
Do any one has the type Sive is using here that has only one line?
I sincerely appreciate for the help.
Do any one has the type Sive is using here that has only one line?
I sincerely appreciate for the help.

Sive Morten
11 years ago,
Registered user
> The ADX in my mt4 chart has about 3 lines. Get confused most time.
Do any one has the type Sive is using here that has only one line?
I sincerely appreciate for the help.
Hi 4xpipsense,
read the post above. Also you may adjust it - right click - ADX Properties and just choose no color for DI' lines and you will be see only ADX indicator
Do any one has the type Sive is using here that has only one line?
I sincerely appreciate for the help.
Hi 4xpipsense,
read the post above. Also you may adjust it - right click - ADX Properties and just choose no color for DI' lines and you will be see only ADX indicator

Hamza Samiullah
6 years ago,
Registered user
Nice explanation..
O
One-fm
5 years ago,
Registered user
Another great tool to add to trading strategy. Thanks for this.
Table of Contents
- Introduction
- FOREX - What is it ?
- Why FOREX?
- The structure of the FOREX market
- Trading sessions
- Where does the money come from in FOREX?
- Different types of market analysis
- Chart types
- Support and Resistance
- Candlesticks – what are they?
- Mysterious Fibonacci
- Introduction to Moving Averages
- Bollinger Bands
- Leading and Lagging Indicators
- Basic chart patterns
- Pivot points – description and calculation
- Elliot Wave Theory
- Intro to Harmonic Patterns
- Divergence Intro
- Harmonic Approach to Recognizing a Trend Day
- Intro to Breakouts and Fakeouts
- Again about Fundamental Analysis
- Cross Pair – What the Beast is That?
- Multiple Time Frame Intro
- Market Sentiment and COT report
- Dealing with the News
- Let's Start with Carry
- Let’s Meet with Dollar Index
- Intermarket Analysis - Commodities
- Trading Plan Framework – Common Thoughts
- A Bit More About Personality
- Mechanical Trading System Intro
- Tracking Your Performance
- Risk Management Framework
- A Bit More About Leverage
- Why Do We Need Stop-Loss Orders?
- Scaling of Position
- Intramarket Correlations
- Some Talk About Brokers
- Forex Scam - Money Managers
- Graduation!