Part I. Trading sessions

Pipruit: Sir, can we finally turn to some real FOREX stuff? I’ve tired already with this “around” talks, concerning, futures/spot, banks, market makers, trading diagrams, history and other things. Although I have to say that some of these things are exceptionally important and some are interesting, but still I wish to turn to FOREX trading directly…
Commander in Pips: Yes, I think the time has come for this purpose. And we will start with the timing of FOREX. In other words, when can we trade it, and what is the difference is between different trading times.
Pipruit: Huh, you think that it’s funny, do you? Even I already know that FOREX is a 24 hour market. What the difference does it make what time of day I decide to trade it?
Commander in Pips: Oh really? You will be surprised, but FOREX has its own time structure. This means that it could move up, it could move down, but there is also a time when it could just go almost nowhere. What time do you prefer to trade?

Pipruit: Well, I prefer to see some movement, of course, better upward. But downward is not bad also.
Commander in Pips: And how do you intend to recognize the right times for market movement?
Pipruit: Well, I don’t know…
Commander in Pips: That’s why it will be the next lesson. Ok, let go through it…
Before shifting to investigating the most acceptable time for your trading, let’s take a look at the entire FOREX trading day. Market participants mark out four different parts of it. These parts are called “trading sessions”. These are: the Sydney session, the Tokyo session, the London session and the New York session. Although there are 4 trading sessions, it does not mean that each one continues for 6 hours. These sessions are crossed among themselves, or we might say, the sessions overlap each other. Furthermore, you know that during the winter time most countries have to adjust clocks for winter time, so as in other countries. That leads to some shifting in times of different trading sessions so the degree of overlapping could be different, depending on time of the year. So, let’s take a look at the timing of different trading sessions:
Summer (Northern Hemisphere)
| Time Zone | EDT | GMT |
|---|---|---|
| Sydney Open Sydney Close | 6:00 PM 3:00 AM | 10:00 PM 7:00 AM |
| Tokyo Open Tokyo Close | 7:00 PM 4:00 AM | 11:00 PM 8:00 AM |
| London Open London Close | 3:00 AM 12:00 PM | 7:00 AM 4:00 PM |
| New York Open New York Close | 8:00 AM 5:00 PM | 12:00 PM 9:00 PM |
Winter
| Time Zone | EST | GMT |
|---|---|---|
| Sydney Open Sydney Close | 4:00 PM 1:00 AM | 9:00 PM 6:00 AM |
| Tokyo Open Tokyo Close | 6:00 PM 3:00 AM | 11:00 PM 8:00 AM |
| London Open London Close | 3:00 AM 12:00 PM | 8:00 AM 5:00 PM |
| New York Open New York Close | 8:00 AM 5:00 PM | 1:00 PM 10:00 PM |
In fact, this division into different trading sessions is mostly relative. What does it mean, for example, the end of Tokyo session - all Japanese are going to bed? Of course not! This time just approximately indicates the reduction of trading activity in a particular region.
Second item – The Tokyo trading session is very similar to the Sydney one. In fact, this trading session also includes the trading times of such large participants as Hong Kong, Singapore, China, Malaysia and others. These markets are showing gradual growth in trading volumes and becoming more and more important.
Third important item - There is different winter time adjustment in the Southern and Northern hemispheres. You can see that North (New York) adjusts time for 1 hour back and South (Sidney) for 2 hours forward. This happens because seasons are opposite in different hemispheres.
Here is the same information, but in picture. The overlaps of cross-continental trading sessions (except Sydney + Tokyo) are marked on time scale:
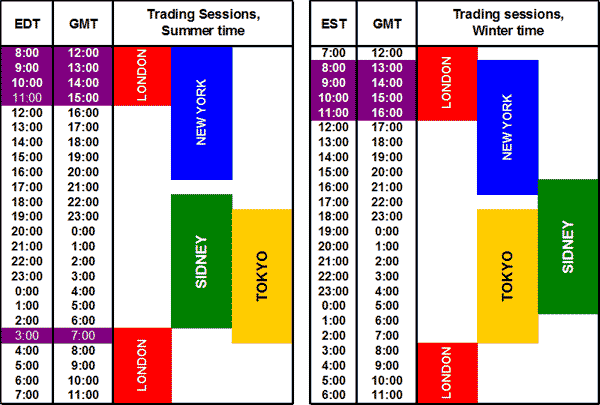
The roughest period in the market is during crossing of different trading sessions. During this time, more and more participants enter the market and trading volume increases significantly. Mostly important is the overlap of London and New York City sessions, because, as we’ve estimated, it’s more than 50% of overall daily trading volume.
Now let’s take a look at volatility – the average price range in pips during different trading sessions. Pip is equal to 0.0001 of the exchange rate:
| Pair | London | New York | Tokyo |
|---|---|---|---|
| EUR/USD | 103 | 86 | 70 |
| GBP/USD | 131 | 103 | 97 |
| USD/JPY | 68 | 60 | 50 |
| AUD/USD | 87 | 84 | 80 |
| NZD/USD | 79 | 73 | 67 |
| USD/CAD | 94 | 88 | 55 |
| USD/CHF | 104 | 85 | 63 |
Here we can see that the price movement value is also greater with those sessions that have greater trading volume. The European trading session is the most active as in terms of trading volume as well as in terms of price movement.
Comments
A
Aldo Colombo
12 years ago,
Registered user
Sessions graphs need corrections: all sessions are 9 hours long? Most (all but NY's winter's bar it seems) bars span through 10 lines, suggesting for example that Sydney's summer session opens when NY's closes, while this is not the case, there is one our gap.
Also instead of "Summer" stating "Northern Hemisphere Summer" is clearer, especially when you talk about Sydney.
Thank you, great site.
Aldo
Also instead of "Summer" stating "Northern Hemisphere Summer" is clearer, especially when you talk about Sydney.
Thank you, great site.
Aldo

AsstModerator
12 years ago,
Registered user
I added (Northern Hemisphere) in the first place Sive mentions Summer. I've also edited that chart showing trading sesssions.
Let me know if I made it worse or not. :)
Let me know if I made it worse or not. :)
A
Aldo Colombo
12 years ago,
Registered user
OK
First let me tell you I´m only learning. Now picture seems to correspond to table, at least GMT column which I checked. If this is OK then Sydney never overlaps London, but does overlap NY for an hour during NY´s winter. Tokyo only overlaps London for an hour and only in Summer. It sounds clearer to me. London-NY overlap is always 4-hour. Thanks.
Aldo
A
Amanda_pips
12 years ago,
Registered user
What is the best trading session to trade?

Sive Morten
12 years ago,
Registered user
> What is the best trading session to trade?
Hi Amanda,
I suggest you to read this chapter totally first, since it dedicated right to this question. :)
Hi Amanda,
I suggest you to read this chapter totally first, since it dedicated right to this question. :)
M
mrVynes
12 years ago,
Registered user
So by summer time is meant DST, right? Sorry, there's no DST where I'm from..just making sure, thanks!
OK never mind...I get it now..was confused coz over here "summer" refers to the temperate season :D
OK never mind...I get it now..was confused coz over here "summer" refers to the temperate season :D

Hamza Samiullah
7 years ago,
Registered user
Amazing and informative...
D
deolanre
6 years ago,
Registered user
Its getting very interesting.....Learning alot

Anthony23
6 years ago,
Registered user
The fourth chapter is by far the most enlightening in my view. I learned a lot=)
V
Vokes
5 years ago,
Registered user
Nice
G
ganesan2903
a year ago,
Registered user
EDT AND EST is opposite .Time correct but AM and Pm ooposite.tks
Table of Contents
- Introduction
- FOREX - What is it ?
- Why FOREX?
- The structure of the FOREX market
- Trading sessions
- Where does the money come from in FOREX?
- Different types of market analysis
- Chart types
- Support and Resistance
- Candlesticks – what are they?
- Mysterious Fibonacci
- Introduction to Moving Averages
- Bollinger Bands
- Leading and Lagging Indicators
- Basic chart patterns
- Pivot points – description and calculation
- Elliot Wave Theory
- Intro to Harmonic Patterns
- Divergence Intro
- Harmonic Approach to Recognizing a Trend Day
- Intro to Breakouts and Fakeouts
- Again about Fundamental Analysis
- Cross Pair – What the Beast is That?
- Multiple Time Frame Intro
- Market Sentiment and COT report
- Dealing with the News
- Let's Start with Carry
- Let’s Meet with Dollar Index
- Intermarket Analysis - Commodities
- Trading Plan Framework – Common Thoughts
- A Bit More About Personality
- Mechanical Trading System Intro
- Tracking Your Performance
- Risk Management Framework
- A Bit More About Leverage
- Why Do We Need Stop-Loss Orders?
- Scaling of Position
- Intramarket Correlations
- Some Talk About Brokers
- Forex Scam - Money Managers
- Graduation!