Part II. Trading Divergences

1. Common/regular divergences are reversal patterns, while hidden/skewed divergences are continuation ones;
2. Any divergence is not a signal, but is some sort of indicator;
3. It’s unwise to rely on any divergence and trade it solely, since divergences fail as often as they work, or even more often. Personally, I do not rely on divergences, except for just one type of it – we will discuss it advanced talks. This divergence is called “Dynamic pressure” or “Market pressure”;

5. If you use some normalized indicator, such as Stochastic and RSI for estimating divergences – wait for when it will move out from the overbought/oversold zones before treating divergence as reliable. Also it’s better to wait until lines crossover that confirms the divergence - it also applicable to MACD.
6. It is unsafe to take a position against the divergence, so if you are unsure about what to do – do nothing. This decision is as good as do anything, and much better than do something wrong.
7. In other words – do not trade every divergence that you see. Look at it as on an indicator and use it just as additional tool in overall trading context - as part of whole puzzle.
Also from a practical standpoint its better treat divergence as additional confirmation sign that appears at some strong reversal area. Say, the market has reached some daily Fib resistance or even Confluence, daily overbought and, for instance, Agreement of pivot resistance 1. Daily trend holds bearish. Right at this level on hourly or 4-hour chart you see Bearish divergence that combined with other patterns, say, H&S as we’ve seen on chart #1 in previous part. That divergence you may use as confirmation of probable reversal.

Pipruit: Thanks, Sir. I will also think about that.
Chart #1 | 60-min EUR/USD
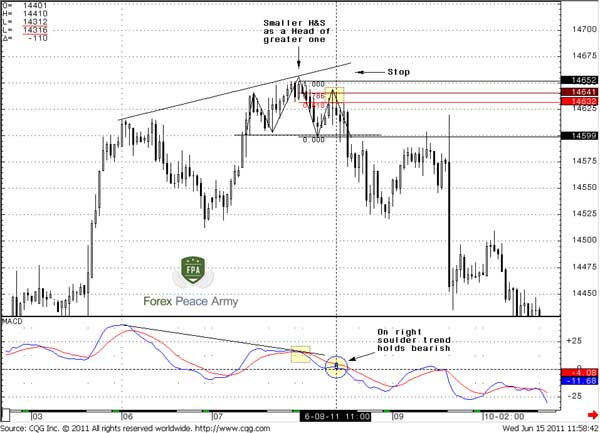
Let’s start from common Bearish Divergence on an hourly EUR/USD chart. On that day, the market has hit daily overbought and stands between 0.618 and 0.786 Fib resistance. So, as we’ve said we have some additional resistance conditions and not just hourly divergence.Applying rules in the beginning of this part, we may act as follows:
1. Initially our attention was attracted to second top of potential divergences. We do not see yet, that this is the head of larger H&S pattern, so as small H&S pattern;
2. Since the market moves down from the head of small H&S we have a confirmation from MACD – lines have crossed. This gives us confirmation of divergence and shift of the trend to bearish;
3. We’ve said, that divergence is not a signal, this is just a confirmation that probably a situation is turning to bearish, but still we do not have sufficient context to enter short;
4. When the initial pullback from the head of small H&S has finished – we could suspect that this probably will be H&S, hence we need some pullback to enter. Also it gives us clear area to place astop and what to watch in general:
- We need to see harmony in the H&S pattern. Hence, the right shoulder of small pattern should be around 0.618-0.786 retracement level from the head.
- Since our context for entering is the small H&S, we have to place stop just above the head.
5. Another confirmation of bearish bias has come from MACD. It is not just showing us divergence and a bear trend, it also shows that trend holds bearish during the right shoulder of the small H&S pattern. Hence, we can enter right from the 0.618 resistance of the head to neckline swing.
So, as you can see, we do not rely here on divergence solely. Divergence is just an indicator, because it does not give us clear areas where to enter and where to place a stop. We should analyze the situation within the overall view.
So, what we do have:
1. Daily overbought and Fib resistance;
2. Hourly bearish divergence;
3. Small H&S;
4. Hourly trend is bearish and holds bearish at entry point.
Take a note that our stop placement here is absolutely logical. If the market will erase H&S and move above the head, then trend will turn bullish and the divergence will be under question also. It is needless to say here that H&S will fail, so that area for placing stops is absolutely proper.
The current chart shows that our trade will turn to profit, but even if divergence will fail, our entry here was correct, because we had a bearish bias and acted accordingly. You have to do the same type of work any time when see divergence.
Chart #2 | 60-min EUR/USD and hidden bullish divergence
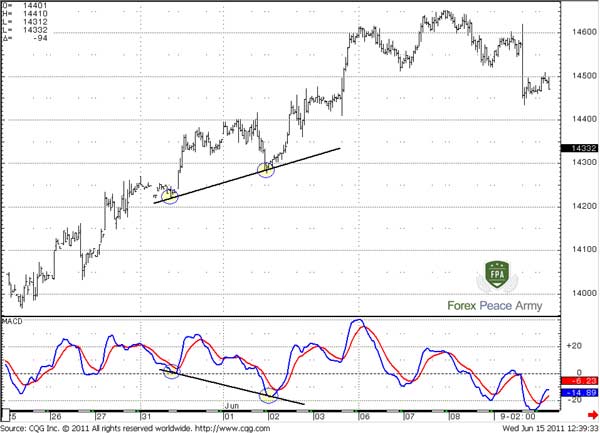
Chart #2 shows us hidden bullish divergence – while MACD shows strong momentum down and creates new low – market does not confirm that and sellers could not push price lower. This is a bullish sign.On chart #3 is just one of the possible approaches to trading this situation:
Chart #3 | 60-min EUR/USD trading hidden bullish divergence
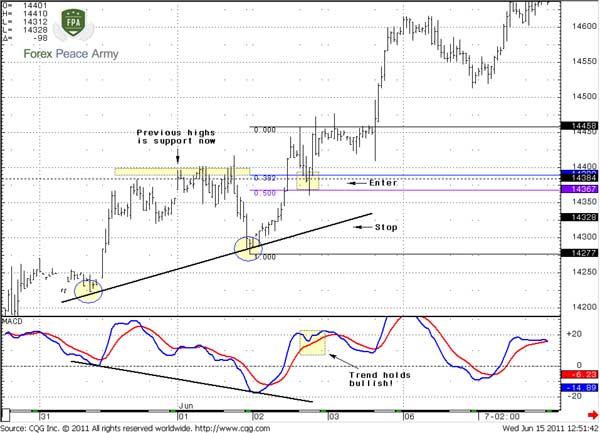
Here we have to note that daily trend is bullish. As we can see from chart #2 market is in upward parallel channel. Hence we have to search way to enter long.When we see divergence – we can’t enter, since we have no signal yet. A bit later we see that the hourly trend has turned bullish – MACD confirms divergence by lines’ crossing and simultaneously confirms the channel’s support. But after that, the upward move was fast and usually you can’t jump on it in time. Hence, we need some pullback to enter. When the market has taken out previous highs – it has turned to retracement. Our choice here is 0.382-0.50 support, because this is also a previous high. If the market will move below 1.4350 it will mean that this breakout was probably a fake one. Second – our preferable scenario is when the bullish trend holds. Hence, if we will wait for deeper retracement we will get an unattractive scenario – the trend will turn bearish and the market will move below previous highs. In that case our bullish context will be negated by price action.
As a result we have only one way to enter - at 0.382-0.50 support. Stop placement could be different. It depends on your target and position value. But most safe stop is below support of the parallel channel line.
As you can see, here we apply all the knowledge that we already have – buying deeps and not just jump in, wait for confirmation of the trend and daily trend and use classical support/resistance lines as well as channel trading. Place of divergence here is only as a confirmation but not a reason for trading. That is the proper way to use it.
Pipruit: Well, I suppose I understand what you’re talking about in this approach to divergences. But, let me ask you a cunning question:
Look at the same chart but a bit to right from our entry:
Chart #4 | 60-min EUR/USD What is it?

Look at the same chart but a bit to right from our entry:
Chart #4 | 60-min EUR/USD What is it?
According to your previous analysis, we should exit here, because trend has shifted bearish, right?
Commander in Pips: No, because this stuff calls Market or Dynamic Pressure
Advanced talks on divergences – Dynamic Pressure
Although you can identify Dynamic Pressure (we will call it as “DP”) using simple MACD indicator, there is a better choice that exists. This is Joe DiNapoli’s MACD Predictor indicator. It looks like a simple red line on the chart. MACDP is a derivative indicator from MACD. While simple MACD uses two lines for trend identification, MACDP uses single line and price instead of second one. So, when price is above the red line, the trend is bullish, and when it is below it – bearish. Also take note that price crosses the red line right at the same time when simple MACD shows its line crossing. So they give absolutely the same signals. But MACDP also shows the precise price level when the trend will change and does it 1 period ahead of time. If you what learn more about MACDP – visit DiNapoli’s official web site:
Coast Investment Software Inc.
Chart #5 | 60-min EUR/USD with MACD and MACDP
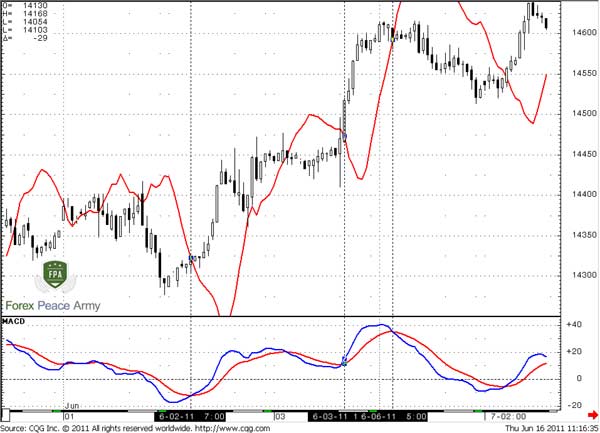
I’ve marked for you some crosses, so you might see their harmony. Again, using MACDP is more comfortable, but this indicator is not very cheap and is not available in a lot of trading software. So, we could use simple MACD as well for that purpose.Let’s return to discussion of chart #4. We see some kind of divergence – MACD shows a bear trend, but price action does not support that. It could be in two different ways – price action stays flat or even rises. This is a bullish Dynamic pressure. It tells, that although trend looks bearish, sellers could not move price lower, hence the bulls are hidden but they are strong and control the market currently. Here we need to search possibility to enter long.
Chart #4 | 60-min EUR/USD What is it?
The other situation is very similar. Bearish DP forms, when trend turns bullish, but price action does not support it and remains flat, or even moves downward. This could lead to further acceleration of the down move, hence we should search for a possibility to go short.Pipruit: And what the target of DP?
Pipruit: And what is a foundation of this indicator, why does it work like that?
Pipruit: Wow! Cool!
Commander in Pips: Here is another example of DP but now on weekly Aussie dollar:
Commander in Pips: The trading technique of DP could be as follows:
1. Identify DP. Market has to show confirmed by close price downtrend, based on MACD, while price itself should stand in sideways move.
2. It’s preferable if price forms higher lows/lower highs at bear/bull trend, and bar closes are near top/bottom;
3. The enter signal is the first bar that confirms the trend shifting up/down. Stop could be placed below/above this bar.
Commander in Pips: Here is another example of DP but now on weekly Aussie dollar:
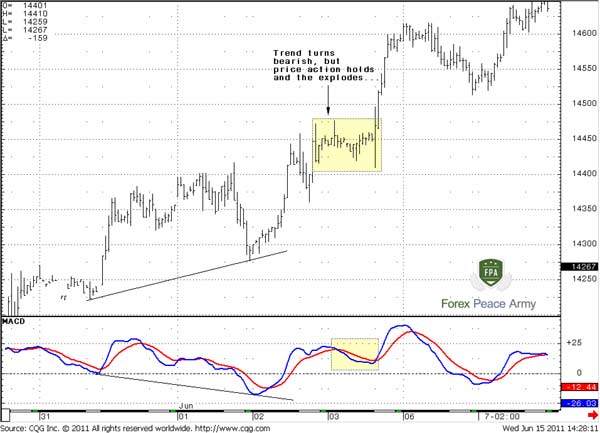
Chart #6 | weekly AUD/USD and Dynamic Pressure
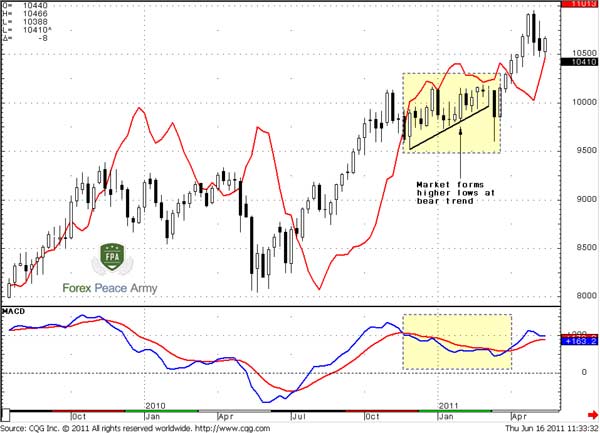
This chart we’ve analyzed in our weekly research trend, by the way. See – although trend has turn bearish, price action does not support it and creates higher lows. In general price stands flat with some inkling on upward tendency. This tells that bulls are strong, and the minimum what we have to expect in such environment is taking out of previous highs. Although they are seemed close, this is weekly chart, so that’s a not small move. As we can see, market continue move up even further.Pipruit: Ok, looks like, I’ve got an idea, and probably I could manage even without MACDP, although it really shows this pattern much clearer than simple MACD. But, Sir, how we should act, when we see it?
Commander in Pips: The trading technique of DP could be as follows:
1. Identify DP. Market has to show confirmed by close price downtrend, based on MACD, while price itself should stand in sideways move.
2. It’s preferable if price forms higher lows/lower highs at bear/bull trend, and bar closes are near top/bottom;
3. The enter signal is the first bar that confirms the trend shifting up/down. Stop could be placed below/above this bar.
Pipruit: Sounds a bit cloudy. Could you show it on real example, say, the same AUD chart?
Commander in Pips: Sure. Let’s just draw this fragment a bit larger on chart #7:
Let’s go right on our steps:
1. Identify DP. We see the trend has turned bearish at close price, while price itself simultaneously stands in the sideway move.
2. Price forms higher lows with bar closes near highs. Then we see that the market is forming higher lows. These bars, that jump from so called support line show very high closes. The bright examples are bars 6 and 7. So, we can say that this is DP. Although the market has shown some kind of W&R and cleared out stops that had been placed below the trend line, it then turns to a strong move up, that even more confirms our assumption;
3. Entry point. Strictly with rule – first bar, that has confirmed trend shifting to bullish. We can enter in the beginning of the next period, or even wait for some deeper retracement. Both of these ways are acceptable. Stop has been placed below the low of confirmation bar.
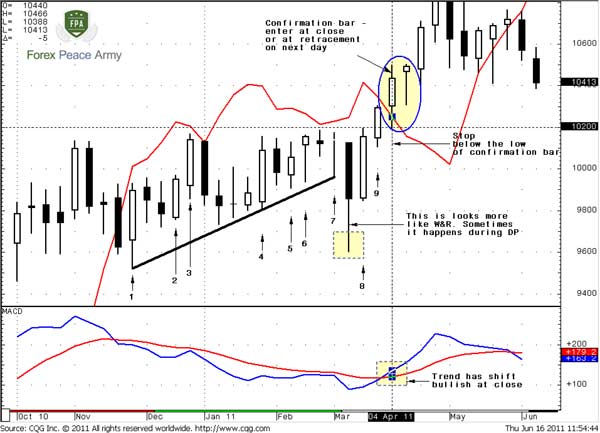
Chart #7 | weekly AUD/USD - trading Dynamic Pressure
Commander in Pips: You’re right, but this work still could all be done only with simple MACD. Also do not forget that this is a weekly chart and you have a lot of time (all next week) to enter.
Commander in Pips: So, I think that’s enough for today. The next part will be light – we just appoint some moments that could help to avoid failure divergences, if you use, say, Stochastic and some other simple rules.
Commander in Pips: Sure. Let’s just draw this fragment a bit larger on chart #7:
Let’s go right on our steps:
1. Identify DP. We see the trend has turned bearish at close price, while price itself simultaneously stands in the sideway move.
2. Price forms higher lows with bar closes near highs. Then we see that the market is forming higher lows. These bars, that jump from so called support line show very high closes. The bright examples are bars 6 and 7. So, we can say that this is DP. Although the market has shown some kind of W&R and cleared out stops that had been placed below the trend line, it then turns to a strong move up, that even more confirms our assumption;
3. Entry point. Strictly with rule – first bar, that has confirmed trend shifting to bullish. We can enter in the beginning of the next period, or even wait for some deeper retracement. Both of these ways are acceptable. Stop has been placed below the low of confirmation bar.
Chart #7 | weekly AUD/USD - trading Dynamic Pressure
Pipruit: All right. Now I understand this stuff clearly. Still, MACDP looks like a very useful tool. Because using it, we clearly see that trend has changed, because it shows price at which trend will shift. While using simple MACD makes this work a bit harder.
Commander in Pips: You’re right, but this work still could all be done only with simple MACD. Also do not forget that this is a weekly chart and you have a lot of time (all next week) to enter.
Pipruit: Right.
Commander in Pips: So, I think that’s enough for today. The next part will be light – we just appoint some moments that could help to avoid failure divergences, if you use, say, Stochastic and some other simple rules.
Comments

rposrinawa
8 years ago,
Registered user
hi I have some question for the dynamic pressure
What should we do when we found the DP? wait and see right?
What should we do when we found the DP? wait and see right?

Hamza Samiullah
6 years ago,
Registered user
Amazing lesson u wrote..
O
One-fm
5 years ago,
Registered user
Good explanation.
O
One-fm
5 years ago,
Registered user
Good explanation.
Table of Contents
- Introduction
- FOREX - What is it ?
- Why FOREX?
- The structure of the FOREX market
- Trading sessions
- Where does the money come from in FOREX?
- Different types of market analysis
- Chart types
- Support and Resistance
- Candlesticks – what are they?
- Mysterious Fibonacci
- Introduction to Moving Averages
- Bollinger Bands
- Leading and Lagging Indicators
- Basic chart patterns
- Pivot points – description and calculation
- Elliot Wave Theory
- Intro to Harmonic Patterns
- Divergence Intro
- Harmonic Approach to Recognizing a Trend Day
- Intro to Breakouts and Fakeouts
- Again about Fundamental Analysis
- Cross Pair – What the Beast is That?
- Multiple Time Frame Intro
- Market Sentiment and COT report
- Dealing with the News
- Let's Start with Carry
- Let’s Meet with Dollar Index
- Intermarket Analysis - Commodities
- Trading Plan Framework – Common Thoughts
- A Bit More About Personality
- Mechanical Trading System Intro
- Tracking Your Performance
- Risk Management Framework
- A Bit More About Leverage
- Why Do We Need Stop-Loss Orders?
- Scaling of Position
- Intramarket Correlations
- Some Talk About Brokers
- Forex Scam - Money Managers
- Graduation!