Part III. Ranging Market by Indicators

Commander in Pips: Absolutely. This part will be very light in term of education. So, I suppose you can tell me about ranging market and indicators by yourself.
Commander in Pips: And why not? We will talk only about what we already know.
Commander in Pips: Fine, so is your plan – tell first about ranging market – what is it, then describe how ADX, Bollinger Bands and different oscillators behave in a ranging market.
Commander in Pips: Very good. Let’s pass to ADX.
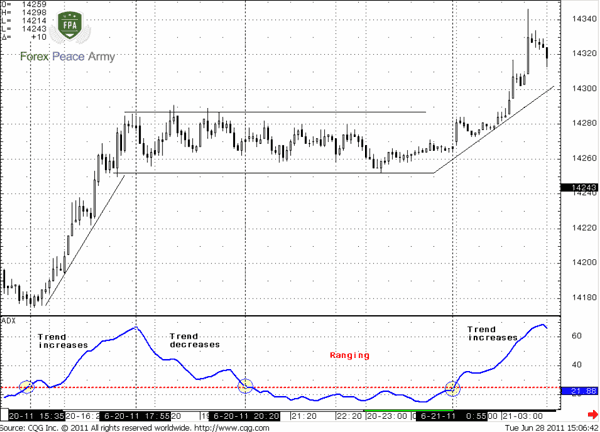
ADX in a ranging market
Chart #1 | 5-min EUR/USD and ADX (10)
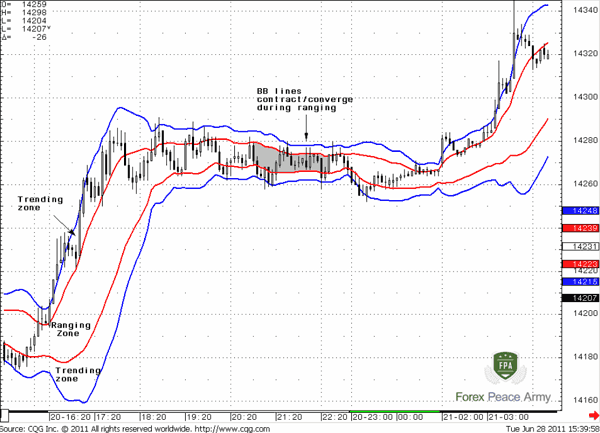
Bollinger Bands
Commander in Pips: And what will you answer if I say that both MAs have the same period…
Second, the red lines show interval where price should stand with a probability of 68% - just a range of 1 standard deviation. AS market stands there it tells that volatility decreases significantly and the market in contraction mode. In other words – it’s ranging and it tells us that there hardly will be strong move in any direction. However, if bands start to expand telling us that volatility increases, it cautions us about a probable trend starting.
Commander in Pips: Yep. And what is a major idea in a ranging market?
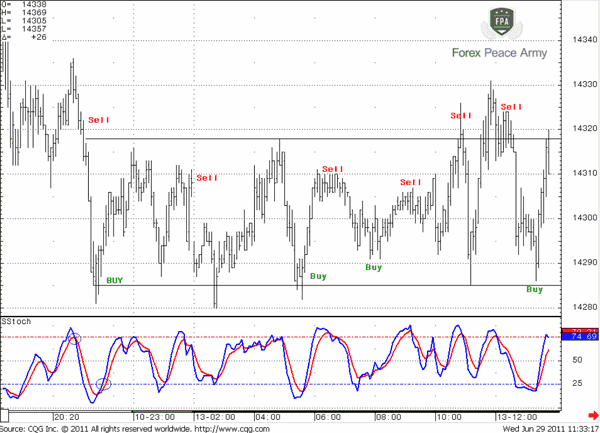
Applying oscillators in a ranging market
Commander in Pips: Well that’s right. Also, it makes sense to note here that it’s better to apply range trading strategies with crosses. For the long term very suitable for that purpose were EUR/CHF and EUR/GBP pairs. But due to some turmoil on financial markets, demand for safe-haven CHF increased significantly, so EUR/CHF has turned to solid downward trend. Still, in a calm environment, when the crisis will end, these pairs will again become attractive for range trading.
So, we’ve met with trending and ranging markets. Still, as I’ve said in the beginning, applying indicators for identification what market currently stands is a not simple task to do. The big problem with that is a problem as a chained circle. From the one point of view you apply, say, oscillators on a ranging market. From the other point – they have to tell you that this is a ranging market. That’s why I suppose that a harmonic approach is better. Still, this is a classical theory and we have to know it as well.
Ranging Markets Q&A
What are ranging markets?
The ranging market appears when price remains inside existing, previously formed, high and low price levels for some time. As a rule, but not always, price forms the same tops and bottoms a few times. A ranging market is the opposite to the trending market and sometimes also called “sideways,” “flat,” or “contraction” market.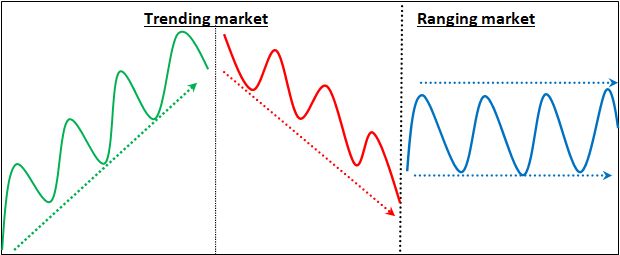
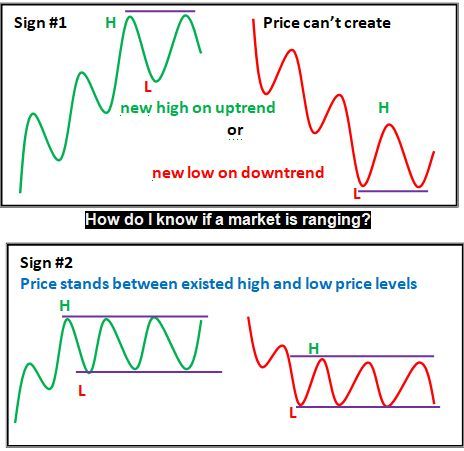
How do I know if a market is ranging?
There are three consecutive steps of the markets turning to the range:
- The price can't create new high during an upward trend or new low during downside trend. These levels create the first border of the possible range.
- On the first backward swing the most recent price low remains intact (on upside trend) and the most recent price high (on downside trend) remains intact. These levels create the second border of the possible range.
- If the above observation of the ranging market is correct, the price starts fluctuating in the range between these levels, forming neither new high nor new low. In a perfect ranging mode, price forms the same highs and lows several times.
How do I trade a ranging market?
Common rules of trading the ranging market suggest to sell near upper border of the range and to buy near the lower border of the range. Upper border is treated as resistance while lower border is treated as support. Stop loss orders usually are placed slightly above the resistance on the “Sell” trade and below support on the “Buy” trade. Few technical tools exist for estimation of the particular moment of position taking. The most popular are – candlestick patterns, Oscillators (RSI, Stochastic) and other technical indicators, such as Bollinger Bands. Traders usually apply the combination of the mentioned ones.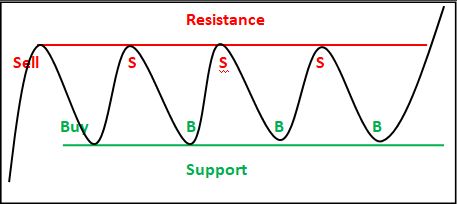
How can we avoid market ranging?
To avoid ranging market you have to pay attention to the first sign of ranging. Once you see that market can’t create new higher high during upward tendency or new lower low during downward tendency – this could be early sign that market is turning to range. If you want to avoid trading the ranging market you will need to wait until the price breaks the range borders either to the upside or to the downside.
To be sure that range is broken you need to estimate range’s borders first. Range borders are determined visually. Upper border, which is also called as “resistance”, is formed by a few consecutive highs of the same price level, while lower border, named “support”, is formed by a few consecutive lows. In a case of upside breakout, price re-establishes tendency of new higher highs (and new higher lows) as new high will be formed after breakout. Alternatively, in a case of downside breakout, price will form new lower low and reestablish the tendency of lower-highs and lower-lows. Thus, you’ve avoided trading on ranging market. 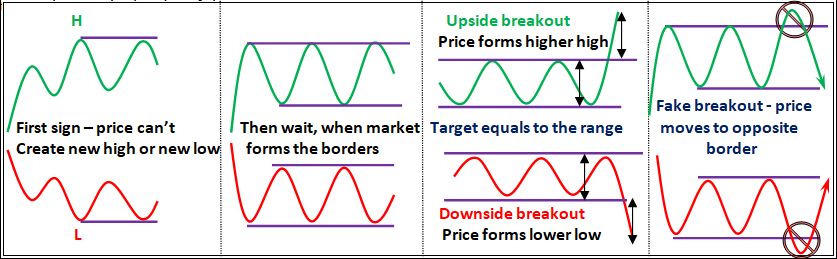
Classical price target after breakout equals to the height of the range, counted up from the upper border (in a case of upside breakout) or down from the lower border (in a case of downside breakout). Fake breakouts happen when the price, after forming new higher high (in a case of upside breakout) or new lower low (in a case of downside breakout) returns back in the broken range. In the case of fake breakouts, as a rule, price tends to reach the opposite border of the range.
What is range-bound market?
Range-bound market appears when price forms approximately equal swings in the same direction, i.e. both upward swings equal to each other and the downside swings equal to each other as well. Very often range-bound market is called "the channel". The special case of range-bound market, when upside swings also equal to downside one is called "the range", "flat", or "sideways", market; in this case range has no slope. 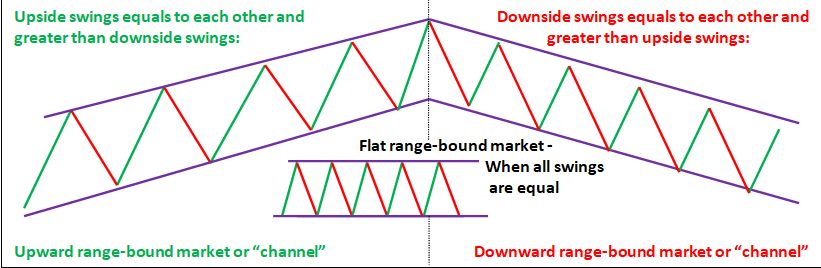
In most cases, upside swings are not equal to the downside ones and range-bound market has the slope or angle. When upside swings are greater than downside ones - range-bound market gets upside slope and it is called "upward channel" and conversely, when downside swings are greater than upside ones - "the downward channel". Usually traders use "channel" or "range-bound" terms when the slope is not too steep, less than ±45 degrees. (Commonly, it is ±30 degrees or less.) Channels with the slope greater than ±45 degrees, as a rule, are already treated as a "trend".
What is trending and ranging market?
Market is called as “trending” when price is forming the sequence of new higher highs and new higher lows, which is called an "upside trend", or new lower highs and new lower lows which is called a "downside trend". The situation, when price can’t keep this tendency and instead is repeatedly forming same highs and lows is called a "ranging market". To describe ranging market traders also often use synonym terms "sideways market", "flat", or "whipsaw".
What does market range mean?
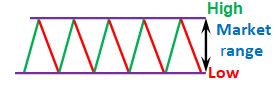
The distance between the tops and the bottoms is called a "market range", or "price range". Term "range" get used differently, depending on the context. As a rule, "market range" term is used when the price stands in the "ranging" mode, forming "sideways" or "flat" channel. Sequence of the same highs and lows gets formed and the distance between these highs and lows is called the "market range.
However, the term "market range" could be used in some other situations as well. For example, It might be a "daily range" – distance between the high and the low of the day; range between highest and lowest price levels for some other than the day period, or in general - distance between any price levels of the trader’s choice.
Thus, whatever market range you want to calculate - it is always the difference between high price and low price. For example, on our GBP/USD daily chart "High" price is 1.62554, and "Low" is 1.58973. 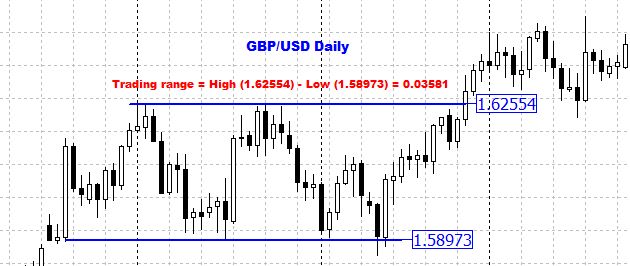
Then "Market range" = High (1.62554) – Low (1.58973) and equals 0.03581.
Which currency pair ranges the most?
Currency trading range is a relative thing that is subject to change in time. Speaking of major currency pairs and their crosses, statistically, the largest range have pairs that are based on high volatility currency and US Dollar or other low volatility currency as a base. GBP is known for its high volatility, while CHF, JPY, AUD, and NZD volatility is relatively low. It means that the widest range among the majors belongs to GBP/USD and GBP/JPY, GBP/NZD, GBP/CAD, GBP/CHF, GBP/AUD among the crosses.
Following the same logic, currency pairs with the lowest range are those that include currencies of approximately the same value in relation to US Dollar, like EUR/GBP, EUR/CHF, CHF/JPY, CAD/CHF, AUD/CHF.
Exotic currency pairs range exceeds the range of the major cross pairs by 3-5 times. For example, USD/SEK or USD/TRY have 3-4 times greater range than GBP/JPY.
That said, if you use trend following strategies in trading, it would be better to follow pairs that are based on GBP, while for trading in the range using of less volatile currencies is more suitable.
When estimating the Range, it's important to not get confused between the absolute range and the volatility.
- The absolute range is the difference between the maximum and minimum prices for some time period.
- The volatility, on the other hand, measures the intensity of fluctuations of the price around its average value for the time period, regardless of how wide or narrow the fluctuations are. The volatility could be high even if the currency price goes nowhere, but just shows a lot of opposite fluctuations during this time interval.
Comments


Table of Contents
- Introduction
- FOREX - What is it ?
- Why FOREX?
- The structure of the FOREX market
- Trading sessions
- Where does the money come from in FOREX?
- Different types of market analysis
- Chart types
- Support and Resistance
- Candlesticks – what are they?
- Mysterious Fibonacci
- Introduction to Moving Averages
- Bollinger Bands
- Leading and Lagging Indicators
- Basic chart patterns
- Pivot points – description and calculation
- Elliot Wave Theory
- Intro to Harmonic Patterns
- Divergence Intro
- Harmonic Approach to Recognizing a Trend Day
- Intro to Breakouts and Fakeouts
- Again about Fundamental Analysis
- Cross Pair – What the Beast is That?
- Multiple Time Frame Intro
- Market Sentiment and COT report
- Dealing with the News
- Let's Start with Carry
- Let’s Meet with Dollar Index
- Intermarket Analysis - Commodities
- Trading Plan Framework – Common Thoughts
- A Bit More About Personality
- Mechanical Trading System Intro
- Tracking Your Performance
- Risk Management Framework
- A Bit More About Leverage
- Why Do We Need Stop-Loss Orders?
- Scaling of Position
- Intramarket Correlations
- Some Talk About Brokers
- Forex Scam - Money Managers
- Graduation!