Part III. Stop-Loss Orders Based on Volatility

Volatility stop-loss placement
Volatility stop-loss placement will be highly acceptable for day traders or reversal traders. It’s preferable if the market is trading near the high or low level of volatility. First of all I want to direct you to my volatility explanation – if you’ve forgotten it – “Chapter 20, Part 1 – Intro to breakouts and fakeouts”.
Pipruit: Oh, I see. So, we can place our stop beyond the upper or lower border of this range – depending on whether we enter short or long.
Remember how to use this indicator for estimation of oversold and overbought levels, so you may estimate oversold and overbought price levels that will be broken just occasionally. Here is an example how you can use it. If you sell right from a Fib resistance that coincides with the overbought condition by Detrended oscillator – you will be able to make profit or, at least, stay at breakeven:
Chart #1 | EUR/USD Daily
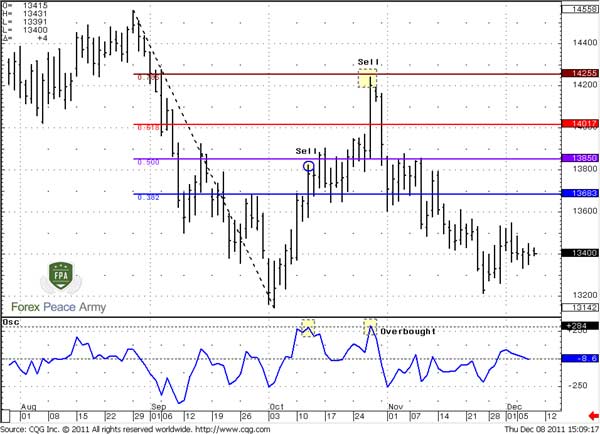
But how to place our stop? Should we use just any value of the oscillator greater than overbought? No. This oscillator is based on daily close prices. Let’s assume that when it hit overbought at some Fib resistance – this is your sell context. To place the stop - all that we need is to build the same oscillator, based on high prices instead of close prices. In this case you will get overbought level for highs. Placing the stop above it will give you high assurance that your stop will only be touched just rarely. This could happen only due something really outstanding. Besides, your stop will not be static – it will be dynamic rather, because the level of overbought will change day by day. The same is true for oversold at support.Commander in Pips: The second indicator that we will talk about is Bollinger bands. This indicator directly links with volatility itself, that’s why we can say that it estimates upward and downward limits more strictly in statistical terms. We also have discussed already how it works and why it works.
To correctly apply stop placement by Bollinger Bands you have to estimate two parameters – term of your position and the probability that you want to apply. Why is term is so important? The point is that Bollinger bands calculate volatility for the period that you’ve specified in its parameters. If you appoint 20 on a daily chart it means that indicator will calculate daily volatility based on the most recent 20 days. Second is probability. Depending on second parameter (1, 2 or 3 standard deviations) you can choose what probability to apply of your stop to stay untouched – ~66%, 95% or 99%. The greater probability you choose – the farther stop you will have to place and smaller lot you will be able to trade. Here is the same chart but with BB indicator (99% bands):
Chart #2 | EUR/USD Daily
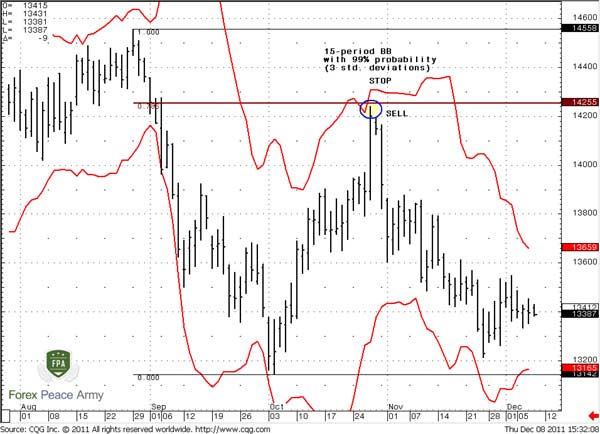
In fact this indicator shows the range, where your stop-order should be placed. Suppose, that you intend to sell from 0.786 resistance at 1.4255, then, if you want that your stop should not been triggered with 99% probability you have to place it above 1.43 and then you can adjust it lower.Still, this indicator has an important problem. The point is that volatility is subject to change. In some periods it could decrease and BB will show tighter bands, while in some periods it could increase.
Pipruit: But sir, we estimate volatility for 20-periods. So 99% range should hold at least for the next 20 periods.
If you want to deal with volatility directly - then you may use Historical volatility indicator. Here you will need 2 different terms to specify. The first term is the same as in BB – for what period to calculate daily volatility. Second term is for what period you want to estimate 99% probability range.
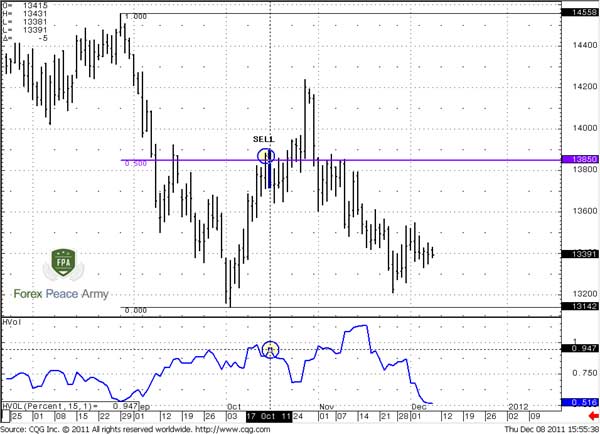
Here is an example. Let’s suppose that you know nothing about BB and overbought and have sold not from the 0.786 level but from 50% resistance level at 1.3850. At this moment daily volatility was 0.947%. You know that you will hold position for 2 weeks or 10 days. Then 10 daily volatility will be 0.947x10^0.5 = 2.994%. Then your 99 % range that price should not exceed in 10 days will be:
From (1.3850 - 1.3850*2.994%*3) till (1.3850*2.994%*3+1.3850) = (1.2605:1.5094). Applying just 95% interval will give you: (1.3020:1.4679). So you can see these levels have not been triggered within this period:
Chart #3 | EUR/USD Daily and daily Historical volatility
This is good approach, but it demands combination with other money management tools, especially risk-reward ratio and maximum acceptable risk.Commander in Pips: There is one last indicator that could be used, but it has a lot of limitations - ATR – Average True Range. Its limitation links with the fact that it estimates average daily range for recent N periods. So, this range could be applicable only for 1 single trading day following after the current day. Here is an example:
Chart #4 | EUR/USD Daily and ATR (21)
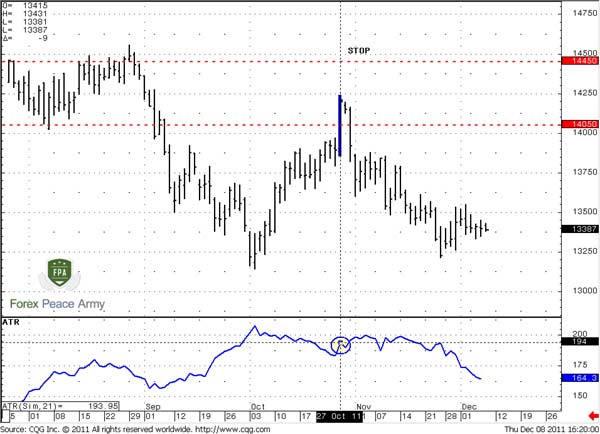
You can see that at the moment of entry ATR tells us that the average daily range for past 21 periods is about 200 pips. So, it is unlikely that on the next day market will move more than 200 pips as to the upside as to the downside from previous close price – that has happened. But on the next day the lower border easily was broken. The reason is that this range should be counted from the most recent close bar, but not extended in the future as with Historical Volatility. ATR is very useful with different application that we’ve discussed in Charter 20. But it is not very suitable for placing stop order.Maybe those who trade intraday will find them useful, since they will get daily range by ATR value. If the market will approach upper border – they could try to sell, lower border – to buy.
Pipruit: Well, personally I like Detrended oscillator and Historical volatility most of all.
Comments
S
samuelken
11 years ago,
Registered user
thank you Sive for your great lessons.
pls where can i get Detrended Oscillator
pls where can i get Detrended Oscillator

Sive Morten
11 years ago,
Registered user
> thank you Sive for your great lessons.
pls where can i get Detrended Oscillator
Hi Samuelken,
In corresponding chapter of our school - one of the comments contains file to download for MT4.
pls where can i get Detrended Oscillator
Hi Samuelken,
In corresponding chapter of our school - one of the comments contains file to download for MT4.
Table of Contents
- Introduction
- FOREX - What is it ?
- Why FOREX?
- The structure of the FOREX market
- Trading sessions
- Where does the money come from in FOREX?
- Different types of market analysis
- Chart types
- Support and Resistance
- Candlesticks – what are they?
- Mysterious Fibonacci
- Introduction to Moving Averages
- Bollinger Bands
- Leading and Lagging Indicators
- Basic chart patterns
- Pivot points – description and calculation
- Elliot Wave Theory
- Intro to Harmonic Patterns
- Divergence Intro
- Harmonic Approach to Recognizing a Trend Day
- Intro to Breakouts and Fakeouts
- Again about Fundamental Analysis
- Cross Pair – What the Beast is That?
- Multiple Time Frame Intro
- Market Sentiment and COT report
- Dealing with the News
- Let's Start with Carry
- Let’s Meet with Dollar Index
- Intermarket Analysis - Commodities
- Trading Plan Framework – Common Thoughts
- A Bit More About Personality
- Mechanical Trading System Intro
- Tracking Your Performance
- Risk Management Framework
- A Bit More About Leverage
- Why Do We Need Stop-Loss Orders?
- Scaling of Position
- Intramarket Correlations
- Some Talk About Brokers
- Forex Scam - Money Managers
- Graduation!