Part VI. Triple candlestick patterns

Pipruit: know – Morning star is a Morgenstern …
Commander in Pips: Yes, definitely for the bears…
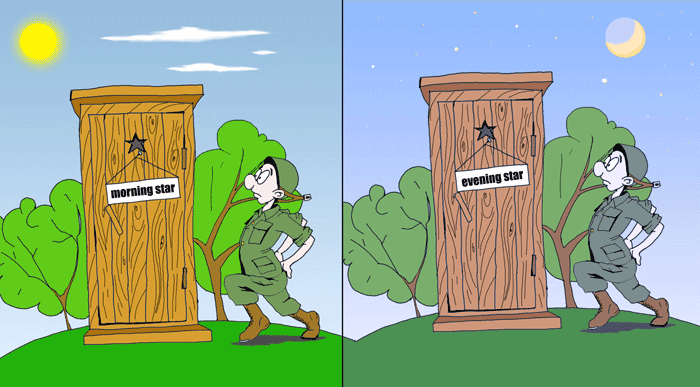
Morning Star/Evening Star
These patterns are reversal ones. Morning star forms on the bottoms, near some support level usually after some move down on the market. Evening star has the same properties but from opposite point of view – it forms on tops, near resistances, usually after some up move.
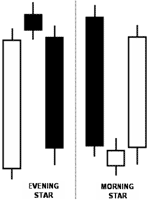
So, an Evening Star is a bearish reversal pattern, very often it appears at the end of a bullish trend. It assumes that after solid white candle follows a small candle, that could be white or black. The body of the second candle (small) should not cross the body of the first strong white candle. Also the small candle could be a small Doji. In this case this model is called “Evening Doji Star”. The third candle should be a solid black one. Its body also should not cross with the body of small second candle, but has to deeply penetrate the body of the first white candle (at least somewhere between 2/3 or 3/4 lower end of white candle).
The consolidated candle of Evening star equals to Shooting star with small white body (try to build it by yourself – take the open of the first candle, high/low of a overall model and the close of the third candle – and you’ll see it).
The market mechanics of this pattern is very clear. During the first white candle,the perspective of Buyers is clear and cloudless – no worries are visible. The second small candle shows that the market has fallen into indecision, because the bulls were not able to push the market higher, as usual. It shows that the number of buyers gradually became exhausted, or the number of sellers has become greater. When during the third candle price totally erases all bulls’ work during the previous two trading periods – in fact it turns into buyer capitulation. So, the same is true for Morning Star, but from the opposite point of view.
Evening Star is treated as triggered pattern, when market closes below the low of the pattern. It treated as failed, if market will close above the high of the Evening Star.
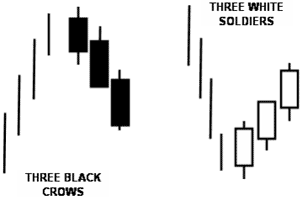
Three white soldiers/Three black crows
This is also a reversal pattern. As you can understand from the names, it consists of three white candles (Soldiers) or three black candles (crows). So, soldiers is bullish reversal signal, while crows is bearish. These patterns are more significant if appear after a long tendency or in an area of high/low prices. For instance, if the market was in a long-term bear trend, or price level near some long-term lows, the appearance of White Soldiers can give us an early notification about a tendency towards reversal. So, the same is true for Crows, but in terms of changing a long-term bullish tendency.
Major properties of “Three white soldiers” pattern:
- The close prices of all three candles should be at high level or very near to it. So, candles should have very small upper shadows – if upper shadows are completely absent – much better.
- Opening prices of each candle should be inside the body of a previous candle.
- The model will be more reliable, if the body of the first candle in the pattern will be above the low of previous black candle.
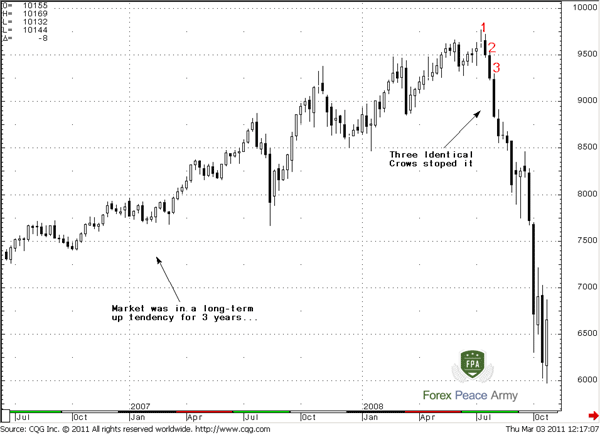
- If open price of second and third candles coincide with the close price of a previous candle (first and second correspondingly), then this pattern treated as stronger one, and calls “Identical three soldiers” or “Identical three crows”
- Pattern treated as stronger one, if it appears not just after long-term downward tendency, but after a sideway consolidation that separates the downtrend and the pattern.
- Preferably, the second candle will be bigger than the first one and the third will be at least the same size as the second.
- Preferably, if all three candles have no upper shadows, or if they do – these shadows should be very small.
The same is true for Three black Crows, but from the opposite point of view. I hope that you will not have any problem to make change some words to opposite – “white” to “black”, “low” to “high”, “upper shadow” to “lower shadow” and etc…
Three inside Up/Down
Commander in Pips: The last pattern is “Three inside Up/Down”.
This pattern also has a reversal nature. “Up” pattern appears on bottoms, at supports and some down tendency should preceded it. “Down” pattern is vice versa, appears on tops, below the resistances and after some upward move. This pattern does not necessary indicate that a reversal will happen with 100%. It can lead just some pause or retracement in previous move.
Properties of Three inside Up/Down pattern
- This pattern consists of three candles. The first candle should be in a row with previous tendency, so as with Morning/Evening star. Nothing should forebode the worries.
- Second candle should be in opposite direction and have the close price at least at the middle of the previous candle. Usually this candle is inside candle, compares to the first one. “Inside” means that total trading range of the second candle (i.e. from low till high) stands in the range of the first candle.
- Third candle should have a close price above the high price of the first candle (for Up pattern) or below the lows (for Down pattern).
Here is what they look like:
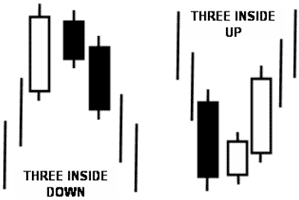
The market mechanics of this pattern are almost the same as with Evening or Morning star. But it looks even stronger, because during second candle, say, “Down” pattern, bulls were not able even to establish new highs and already lost about 50% of the first candle. On the third trading period – bears are fully dominating the market and pushing buyers even below the lows of the first candle and not just below its middle as is the case of Evening Star.
Commander in Pips: So, Congratulations, son, we’ve studied Candlestick patterns!
Pipruit: So, they are so few? Are you sure that we’ve study all patterns? I’ve thought that they should be many more.
Commander in Pips: Of course not. There are are some that we didn’t talk about – for example, high wave, Bullish/bearish counterattack, belt-hold lines and some others. But… Some of them are just variations of those that we’ve learned – for instance, “Counterattack” is a weaker variation of “Cloud/Piercing” pattern. And we’ve studied the major, most reliable and well-spread patterns. This will be enough for solid application skills of these patterns in real trading. Still, if you want to learn more – read Steve Nison’s books that I’ve pointed out in the beginning of this chapter.
Pipruit: Well, I think that I’ll try to practice in recognition of those, that we’ve already studied first. Then, if I’ll find them useful and suitable to my trading way – I definitely will try to learn more.
Commander in Pips: Wise decision, son.
Comments

Hamza Samiullah
6 years ago,
Registered user
nice chapter ...
Table of Contents
- Introduction
- FOREX - What is it ?
- Why FOREX?
- The structure of the FOREX market
- Trading sessions
- Where does the money come from in FOREX?
- Different types of market analysis
- Chart types
- Support and Resistance
- Candlesticks – what are they?
- Mysterious Fibonacci
- Introduction to Moving Averages
- Bollinger Bands
- Leading and Lagging Indicators
- Basic chart patterns
- Pivot points – description and calculation
- Elliot Wave Theory
- Intro to Harmonic Patterns
- Divergence Intro
- Harmonic Approach to Recognizing a Trend Day
- Intro to Breakouts and Fakeouts
- Again about Fundamental Analysis
- Cross Pair – What the Beast is That?
- Multiple Time Frame Intro
- Market Sentiment and COT report
- Dealing with the News
- Let's Start with Carry
- Let’s Meet with Dollar Index
- Intermarket Analysis - Commodities
- Trading Plan Framework – Common Thoughts
- A Bit More About Personality
- Mechanical Trading System Intro
- Tracking Your Performance
- Risk Management Framework
- A Bit More About Leverage
- Why Do We Need Stop-Loss Orders?
- Scaling of Position
- Intramarket Correlations
- Some Talk About Brokers
- Forex Scam - Money Managers
- Graduation!