Part VIII. Indicators: Tightening All Together

Commander in Pips: Since we’ve studied some different indicators. Let’s take a look how they could be applied in combination with each other. The point is that, as we’ve previously said, every tool could fail sometime. So, to get some insurance with any signal – it’s better if the same signal comes from different indicators and we do nothing till some indicators will confirm each other. This is the major principle of combinations of different indicators.
Pipruit: Yes, this is always interesting, but Commander, may be we should use all of them. In this case we will get very confident signal…

Commander in Pips: …Or no signal at all. First, the “best” is an enemy of the “good”. Second, we want to make trades and not just watch how one indicator cancels out another. We do not want to analyze spaghetti charts with 20+ indicators so that we even will not able to see the price itself. Catch up some simple rules:
1. Always keep charts as clearer as possible. So, that you clear see the swings, thrusts and the reality of price action;
2. Use different tools separately. For instance, if you want to take a look at Fib support/resistance levels – do this, estimate the crucial levels, mark them and erase the others that you will not need during the nearest trading session. D not combine them with Bollinger Bands, Moving averages and other tools simultaneously, so that your chart will become extra heavy. To think clearly you should have clear vision of price action;
3. Do not use more than three indicators simultaneously. For example – check the trend with MACD or MA. You may keep it on chart. If you want to look at Overbought/Oversold - plot DOSC or Momentum or Bollinger Bands, take a look and delete them from the chart. Keep it clear.
4. When you’ve taken a look at the overall picture – keep only significant details on the chart – in other words only crucial results of your analysis with text markings.
5. In general you will need just two indicators - one is for trend identification and another one for overbought/oversold estimation. May be you will use additionally the ADX indicator for trend power tool. Personally, I like MACD as a trend indicator and DOSC as overbought/oversold indicator. But during your trading journey you will estimate which indicators are preferable personally for you.
6. So, more is less here.
Pipruit: I’ll try to do it in that way, sir.
Chart #1 | 4-hour GBP/USD, Stochastic (14;3;3) and Bollinger Bands (20;2)
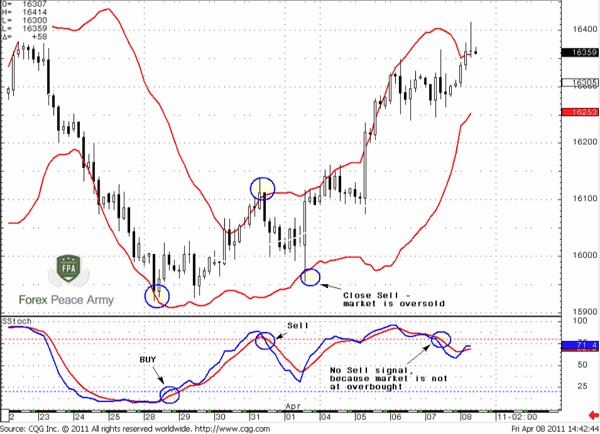
Let’s assume that you intend to use Stochastic for trend and signal identification, and filter it with Bollinger Bands. You intend to enter short, when both indicators give you this signal – Stochastic shows cross, according to our rules and the market hits the upper band of the BB indicator. The same is for entering Long.First signal from Stochastic comes at a perfect bottom, and it was confirmed by Bollinger Bands – the market has pierced it lower band. Second signal gives use nice possibility to catch a retracement low. You’ve sold due stochastic indicator that also was approved by Bollinger Bands. You’ve exited from this short position when market has reached level of oversold due to BB, although Stochastic has not yet given any signal.
And the last one – although stochastic gives sell signal – you’ve not taken it, because it has not been confirmed by BB.
AS you can see, you do fewer trades, when you combine two indicators, but the signals become more reliable.
Combination of RSI and MACD
Chart#2 | GBP/USD Weekly, MACD and RSI (9
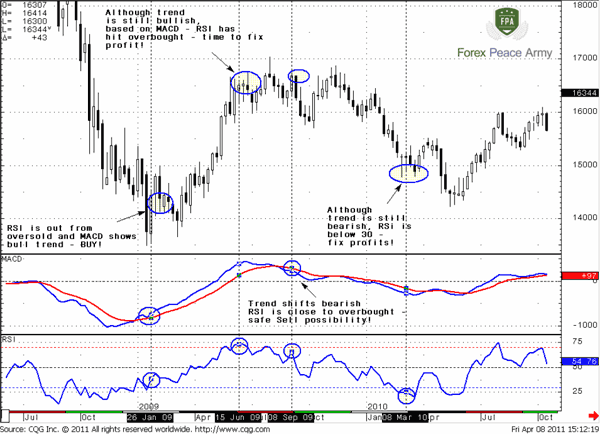
Here is very similar situation. The first signal appears, when RSI is coming out from oversold, a bit later MACD gives buy signal, showing the trend shifting to bullish, then RSI moves above 50% and confirms the trend. 15 Jun 2009 you see that trend is still bullish, but RSI is above 70% and shows overbought – it’s time to take profit.A bit later, RSI comes out from overbought and MACD shifts trend to bearish. At this time RSI stands relatively high and close to 70%. This suggest that entering short here will be safe enough. You close the position 08 Mar 2010 at the same reason – the trend is still bearish but RSI hits oversold. It’s time to exit. And so on.
Pay attention, that RSI and MACD signals a bit separate in time. RSI comes a bit earlier, but MACD a bit later. This is normal. Anyway, you will have to do a great work to estimate necessary parameters for any indicator that you intend to use
Pipruit: Commander, and may be exists some super-duper combination of indicators, that is better than all the others?
Commander in Pips: Many traders search for it, but I have to say, that there is no such thing as magic. You will have to study each indicator, spend some time on this task. Then you will start feel it, understand how it responds in different market environments. So you’ll come to some combination that you understand and that is suitable for your trading style.
Ok, now I’ll give you a small summary:
Indicators for Trend estimation:
1. Different Moving Averages;
2. MACD;
3. Parabolic SAR;
4. Sometimes use Stochastic also, but for intraday charts as a rule.
5. RSI could be used as a confirmation, if it moves through 50%.
Indicators for estimation of Overbought/oversold conditions:
1. Stochastic;
2. RSI;
3. DOSC;
4. Momentum;
5. Bollinger Bands.
Absolutely separately stands the ADX indicator that estimates the power of a trend.
My preferred pair of indicators is MACD and DOSC.
Comments

AsstModerator
12 years ago,
Registered user
Need an MT4 version of the Detrended Oscillator (DOSC) that Sive uses? Sive shares his version here...
https://www.forexpeacearmy.com/community/attachments/dosc-ex4.3797/
It's free. Follow the instructions in that post to get it to work in your copy of MT4.
https://www.forexpeacearmy.com/community/attachments/dosc-ex4.3797/
It's free. Follow the instructions in that post to get it to work in your copy of MT4.

rashidin5178
12 years ago,
Registered user
I have heard about Woodies CCI from one of my friends. The core of the trading signal is from CCI pattern itself. But when I refer to the list of indicators as per your post, I didn't found it.
My questions are:
a) What the secret behind this indicator (CCI)
b) How to use it correctly if it is applicable or worth to apply it.
c) How to filter it
Very appreciate on your answers if it is worth to answer.
Thanks and Best Regards.
My questions are:
a) What the secret behind this indicator (CCI)
b) How to use it correctly if it is applicable or worth to apply it.
c) How to filter it
Very appreciate on your answers if it is worth to answer.
Thanks and Best Regards.

Sive Morten
12 years ago,
Registered user
> I have heard about Woodies CCI from one of my friends. The core of the trading signal is from CCI pattern itself. But when I refer to the list of indicators as per your post, I didn't found it.
My ..
Hi Rashidin,
Sorry, but unfortunately I can't say anything definite, since I'm not a big fan of CCI. There are a lot of indicators in the world, may be 100 or even more. I Just phisically can't know about everyone.
Probably it's better to search some information in the net.
DiNapoli thinks that CCI is not better than DOSC in determination of overbought/oversold. If I do not make mistake he has mentioned about it in his book.
rashidin5178
12 years ago,
Registered user
> Hi Rashidin,
Sorry, but unfortunately I can't say anything definite, since I'm not a big fan of CCI. There are a lot of indicators in the world, may be 100 or even more. I Just phisically can't know..
Thanks, Sir.
Sorry, but unfortunately I can't say anything definite, since I'm not a big fan of CCI. There are a lot of indicators in the world, may be 100 or even more. I Just phisically can't know..
Thanks, Sir.

Hamza Samiullah
6 years ago,
Registered user
Thanks for such beautiful explanation... Sive can i ask whether still now you like the pair of MACD and DOSC???
Table of Contents
- Introduction
- FOREX - What is it ?
- Why FOREX?
- The structure of the FOREX market
- Trading sessions
- Where does the money come from in FOREX?
- Different types of market analysis
- Chart types
- Support and Resistance
- Candlesticks – what are they?
- Mysterious Fibonacci
- Introduction to Moving Averages
- Bollinger Bands
- Leading and Lagging Indicators
- Basic chart patterns
- Pivot points – description and calculation
- Elliot Wave Theory
- Intro to Harmonic Patterns
- Divergence Intro
- Harmonic Approach to Recognizing a Trend Day
- Intro to Breakouts and Fakeouts
- Again about Fundamental Analysis
- Cross Pair – What the Beast is That?
- Multiple Time Frame Intro
- Market Sentiment and COT report
- Dealing with the News
- Let's Start with Carry
- Let’s Meet with Dollar Index
- Intermarket Analysis - Commodities
- Trading Plan Framework – Common Thoughts
- A Bit More About Personality
- Mechanical Trading System Intro
- Tracking Your Performance
- Risk Management Framework
- A Bit More About Leverage
- Why Do We Need Stop-Loss Orders?
- Scaling of Position
- Intramarket Correlations
- Some Talk About Brokers
- Forex Scam - Money Managers
- Graduation!