Part I. Introduction to Moving Averages

Commander in Pips: Today we start a new chapter in our Forex Military School and it will be dedicated to the Moving Average indicator and its different types. From time to time we will use abbreviation as “MA”. I think that you understand what “Average” means?
Commander in Pips: An MA indicator shows the average price of some currency pair during a number of trading periods. The number of periods you will specify by yourself, and also the price type. Most commonly, closing price is used. But also you can use highs, lows or even (High + Low + Close)/3. Unless special notes are made, the for this chapter we will talk about MA indicators that are based on close prices.
Pipruit: Ok, but why “moving”?
Commander in Pips: Because the indicator calculates average price of the most recent number of periods. This number of periods remains constant. It means, that when new trading period just has been completed – the calculation process moves to the right – it then excludes from the calculation the most far trading period and add to the calculation the most recent one. So, it works out that the calculating process “moves” in time. Here what it looks like:
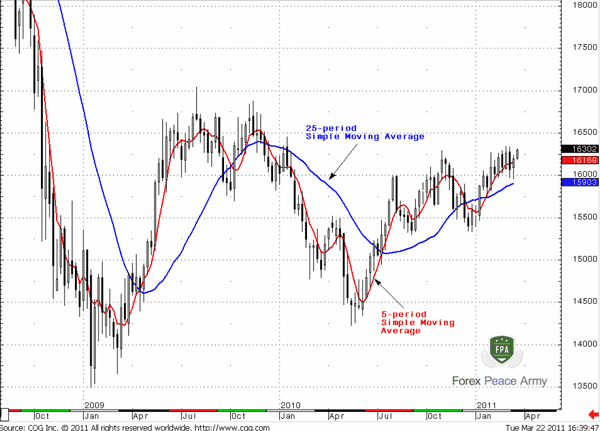
Chart #1 GBP/USD Weekly 5 period and 25-period Simple Moving Average
Pipruit: Looks nice, but how we could use it?
Commander in Pips: Well, as with others tools, MA is needed to project future price movement. At least it could tell us the average sentiment on the market during the most recent period by the slope of the MA. For example, on right side of the chart, we can see that the MA is facing upward, so we can make a conclusion that during the recent time the average market bias was bullish.
Pipruit: I see that in general MA looks smoother than a price chart…
Commander in Pips: Yes, that’s an advantage of MAs – they shows you market direction in general, by smoothing any splashing and choppiness. That’s why it is much simpler to understand and interpret.
Pipruit: Hm, it pushes me to some idea, but I’m not sure… Commander, and can we use an MA indicator to estimate trend direction? Once you’ve said that an MA shows us “market direction in general”
Commander in Pips: Absolutely. This is one indicator (although among others) that is very often is used for estimation of the trend direction. We will talk about it in later parts of this chapter.
Pipruit: And let’s ask more, Sir - what is the big deal about the number of periods?
Commander in Pips: Because, the higher number of periods in calculation of MA indicator – the smoother it is and the less sensitive to recent price action. It is easy to understand. If we calculate 3-period MA, then each period in the calculation has a 33% impact on the overall value. Hence, when a new period has appeared we can say that the value of the MA renews for 33%. And now let’s consider a 50-period MA. Here, each period in the calculation has only a 2% impact on overall value of the Moving Average. And if the market does not show real Doom & Gloom price action – even when the new period has been completed, the value of 50-period MA will not change significantly, because 49 numbers in the calculation remain the same and only a single number has changed. So, the more periods in am MA calculation, the slower it reacts on price movement.
Then, the opposite is true also – the shorter the term of the MA calculation – the more choppy it is and more sensitive it is to price action. It reacts much faster to recent price action.
Pipruit: So, does it mean, that if I want to make my MA looks smoother on my chart, I should add more periods to the calculation?
Commander in Pips: That’s right. But be aware also, that your MA will become “lazier” in this case. Take a look at our chart – see, during small retracements the 5-period MA changes direction, but the longer term 25-period MA did not even feel it…
Pipruit: I see. And here is the main question, Sir – how we can use it?
Commander in Pips: That IS the question and we will answer on it, but gradually and not in the introduction part of this chapter. First, as usual, you will have to know the basics. We will talk about the different types of MAs:
- Simple Moving Average (SMA);
- Exponential and Modified Moving Averages (EMA and MAV);
- Displaced Moving Averages (DMA).
- Exponential and Modified Moving Averages (EMA and MAV);
- Displaced Moving Averages (DMA).
Only after that we will investigate how we can include MAs in our trading strategy, and surely will discuss the major ways of application of MA Indicator.
Comments

Hamza Samiullah
6 years ago,
Registered user
Nice explanation..
Table of Contents
- Introduction
- FOREX - What is it ?
- Why FOREX?
- The structure of the FOREX market
- Trading sessions
- Where does the money come from in FOREX?
- Different types of market analysis
- Chart types
- Support and Resistance
- Candlesticks – what are they?
- Mysterious Fibonacci
- Introduction to Moving Averages
- Bollinger Bands
- Leading and Lagging Indicators
- Basic chart patterns
- Pivot points – description and calculation
- Elliot Wave Theory
- Intro to Harmonic Patterns
- Divergence Intro
- Harmonic Approach to Recognizing a Trend Day
- Intro to Breakouts and Fakeouts
- Again about Fundamental Analysis
- Cross Pair – What the Beast is That?
- Multiple Time Frame Intro
- Market Sentiment and COT report
- Dealing with the News
- Let's Start with Carry
- Let’s Meet with Dollar Index
- Intermarket Analysis - Commodities
- Trading Plan Framework – Common Thoughts
- A Bit More About Personality
- Mechanical Trading System Intro
- Tracking Your Performance
- Risk Management Framework
- A Bit More About Leverage
- Why Do We Need Stop-Loss Orders?
- Scaling of Position
- Intramarket Correlations
- Some Talk About Brokers
- Forex Scam - Money Managers
- Graduation!