Part I. Scaling of Position

Commander in Pips: Since we’ve discussed the basic rules of money management and leverage application - you can start to trade with them and I have sufficient confidence that you will not blow out your trading account. We know how to estimate the value of your position, its link with risk management – now let’s add some flexibility to this. Probably, if you just have started to trade, you may stand without any scaling of your positions, but a bit later you may try to apply it.

Pipruit: And what is scaling of a position?
Initially it is better to foresee scaling and write it down in your trading plan at some price level. This will let you to do this reasonably and calculate risks ahead of scaling, so you will not need to think about risk in the process of trading. This is just safer.

Pipruit: And why do we need it? I feel quite comfortable with my initial position…
Pipruit: Ok, ok – what is so fascinating about scaling?
Commander in Pips: Well, scaling has some advantages. First, if you add to your profitable position and the market continues to move in your favor – I suppose you like it, don’t you?
Pipruit: You bet!
And finally, is third big advantage – scaling will help you to get in. Has it ever happened to you, that your analysis was perfect except entry point – the market has not reached it for some pips and then starts move according to your analysis?
Pipruit: Can a duck swim?
Pipruit: I tell you what? Go ahead – I probably would like to hear more about scaling…
Pipruit: Hm, are there any of them?
Pipruit: Ok, let’s see what scaling the beast is.
Scaling out
Commander in Pips: Ok, the first way is a pleasant one – scaling out. I call it “pleasant” since it includes profit taking. About the “scaling in” procedure we will talk a bit later. Actually we’ve spoken about this way in details in harmonic patterns trading section. Also this approach clearly described in L. Jouflas and L. Pesavento book – “Trade what you see”. So, if you will need more clarification – be my guest. Although they apply such a way of scaling to harmonic pattern – it could be applied to any approach. Harmonic pattern is just on that trigger your in. If you apply another way to enter – this is no problem, you may apply the same “scaling out” procedure. So, let’s see how it works.
The statistical foundation for scaling out is to increase the probability of getting profit and stay with the profit/no loss situation with as much probability as possible. Initially at the stage of your trading plan creation you have to assume partial scaling out of your position. There are two goals that assume scaling out:
1. Move your trade to breakeven reasonably as soon as possible;
2. As first goal been achieved – get profit.
So, in a way of example that we will show, you gradually move the odds into your favor. Our task in any trade is to not get as much profit as we can anyway (although it looks attractive), but to get as much probability to get profit or stay at breakeven as we can. On first view it might be seen as curious, but trading is a huge number of trades. If you follow the maximum profit in any trade and do not move probability in your favor – you probably will catch some of those big trades, but will lose in many others.
When your probability to success becomes much greater in every trade but profit itself becomes a bit smaller – then you will get a better overall result. I will not even talk about the psychological component. The simple example could be as follows: What is better to get $1500 profit and then take a loss $250 in 5 trades in a row later or to get $150$ profit in 4 trades in a row and 1 loss at $100? Is the result the same? I think the choice is obvious. Ok, that’s enough blah-blah-blah – let’s pass directly to an example. That is our butterfly “sell” that we’ve used already but for a bit different purposes.
Now let’s discuss a scaling out example.
Chart #1 | EUR/USD 60-min Butterfly “Sell” trading
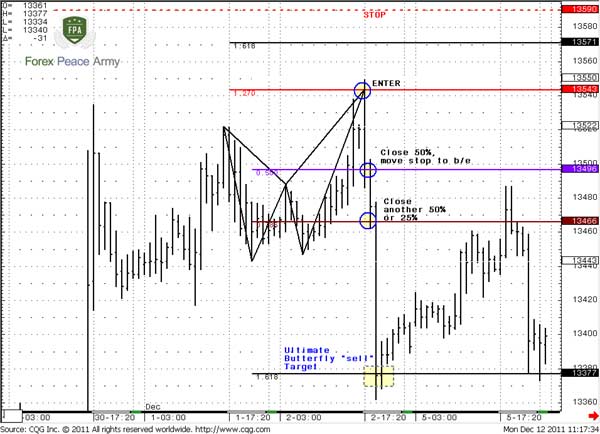
Let’s suppose your trading plan assumes of trading this pattern. You do not know initially will it be 1.27 Butterfly or 1.618, so you’ve decided to enter from 1.27 area. According to trading rules, your stop should be at “invalidation point” that is 1.618 level + hourly harmonic number 20 pips, that couldn’t be passed just occasionally. Let’s suppose that your account assets are 10,000 USD and your money management rule is 1.0% in any trade. What lot should you enter from 1.3543 level and stop at 1.3590?
Pipruit: Well, 1.5%*10,000 = $150. Then $150/(1.3590-1.3543) ~30,000USD or 0.3 standard lot.
Now we see, how price drops to 1.3496 - 50% support of whole butterfly move – from 1.3443 to 1.3550 high. You do not know what will happen next. You see that move down was nice and there are a lot of chances that it will continue, but you do not know for sure. At the same time, the market has passed 50 pips in your favor and shows some hint on retracement at 50% support.
- You close 50% of your position. Profit 15,000*(1.3543-1.3496) = $70.5
- You move the stop at second leg at breakeven – 1.3543.
It always makes sense to take some chips off the table in such manner. Just look what we’ve just done – you will get some profit and your position now is riskless. You can just lie back and watch the movie…
Trading is continuing…
Later you see that market has hit 0.786 support. All later action will depend on trader’s experience. Newbie trader probably will close rest of position and get:
- 15,000*(1.3543-1.3466) = $115.5 profit. Total profit is 115.5+70.5 = $186.
Another way, if your broker allows you to do this – you may close 25 % or, say 0.08 lot and hold the other until the ultimate target at 1.3377.
In fact this will not change the overall picture. Probably an experienced trader will get a bit more profit, while a newbie a bit less, but profit is profit. Pay attention to how probability was skewed by our action in our favor right after reaching of the nearest target at 1.3496. Here you shift your trade to 100% profitable one, since you already have earned 70 bucks. Second, you have turned the rest of it into a riskless position. That is scaling out application.
Pipruit: Could I apply different stop management? For instance, could I not to take any profit at 50%, but just move to breakeven, since the market has passed harmonic number (40 pips) in my favor that should not been happened just occasionally?
I see that you do not feel confident enough with that issue – taking a part of profit. Here is another example for you on the weekly time frame:
Chart #2 | EUR/USD Weekly
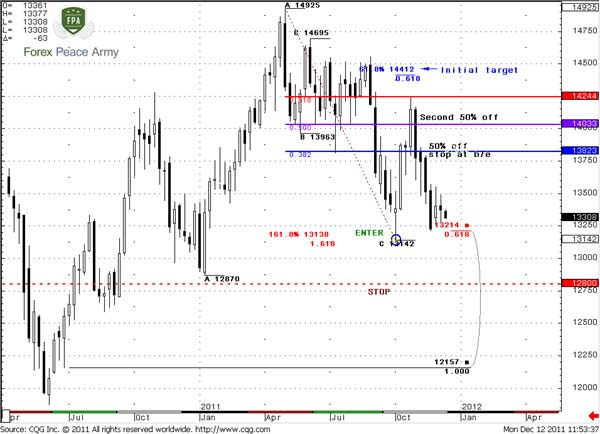
Pipruit: Pitiful perspective? This is an absolute nightmare!
Pipruit: Ok, ok. I see the difference with smaller numbers too… What’s about scaling in?
Comments
R
rajesh bhujbal
11 years ago,
Registered user
Hi COMMANDER ,
I know that you dont have your legs...!!!!!
you must have lost them in some battle .....!!!
i just looked at your photograph....
(LOOK AT SECOND ANIMATED IMAGE ON THIS PAGE, COMMANDER DOESNT HAVE ANY LEGS...)
;);););););););););););););););););););););););););););););););););););););););););););););););););););););););););););)
Table of Contents
- Introduction
- FOREX - What is it ?
- Why FOREX?
- The structure of the FOREX market
- Trading sessions
- Where does the money come from in FOREX?
- Different types of market analysis
- Chart types
- Support and Resistance
- Candlesticks – what are they?
- Mysterious Fibonacci
- Introduction to Moving Averages
- Bollinger Bands
- Leading and Lagging Indicators
- Basic chart patterns
- Pivot points – description and calculation
- Elliot Wave Theory
- Intro to Harmonic Patterns
- Divergence Intro
- Harmonic Approach to Recognizing a Trend Day
- Intro to Breakouts and Fakeouts
- Again about Fundamental Analysis
- Cross Pair – What the Beast is That?
- Multiple Time Frame Intro
- Market Sentiment and COT report
- Dealing with the News
- Let's Start with Carry
- Let’s Meet with Dollar Index
- Intermarket Analysis - Commodities
- Trading Plan Framework – Common Thoughts
- A Bit More About Personality
- Mechanical Trading System Intro
- Tracking Your Performance
- Risk Management Framework
- A Bit More About Leverage
- Why Do We Need Stop-Loss Orders?
- Scaling of Position
- Intramarket Correlations
- Some Talk About Brokers
- Forex Scam - Money Managers
- Graduation!