Part III. Exponential Moving Average

Commander in Pips: To estimate the value of an Exponential Moving Average (EMA) you need to the same three things:
1. Specify number of trading periods that must be included in calculation;
2. Specify the price type of period – close, high, low or even (High+ Low+ Close)/3. As a rule Close price is used for calculation. Possibilities for using of other prices types will depend on software, because not all software allows you to calculate SMA, say, for (High+ Low+ Close)/3. So, here we will talk about SMA on Close price;
3. Calculate average value of these numbers using exponential way of averaging.

Pipruit: And how is that?
Pipruit: I remember, in previous part you’ve said that in SMA calculation each number has the same weight, so equal impact on overall value of SMA. But EMA points different weights, depending on recentness of each number – more weight have most recent numbers and less weight have most early numbers.
Commander in Pips: That’s correct. Let’s return to our calculation of 7-period SMA in previous chapter:
| Period N | Close price |
|---|---|
| 1 | 1.4185 |
| 2 | 1.4207 |
| 3 | 1.4137 |
| 4 | 1.3988 |
| 5 | 1.3882 |
| 6 | 1.3978 |
| 7 | 1.3973 |
SMA = (1.4185+1.4207+1.4137+1.3988+1.3882+1.3978+1.3973)/7 = 1.4050
Now let’s assume, that on 6th day was macro data release near the close of the day and it was terrible, so that market has closed not at 1.3978, but at 1.3350, what will the number of SMA then?
Pipruit: Let’s see:
Hm, it could drastically change a trader’s attitude to overall market situation. Because, although recent price action looks bullish – just single day can turn the SMA to the downside! And we estimate the possible short term trend as bearish.
SMA = (1.4185+1.4207+1.4137+1.3988+1.3882+1.3350+1.3973)/7 = 1.3960
Hm, it could drastically change a trader’s attitude to overall market situation. Because, although recent price action looks bullish – just single day can turn the SMA to the downside! And we estimate the possible short term trend as bearish.
Commander in Pips: That’s right. Here you can see, how equal weight for each number impact on the overall value of SMA. And it could change direction only due some extraordinary price action in a single day. But there is another way of averaging that exists. Using it could smooth out this bug. This is the Exponential Moving Average. It has a formula that points higher weight to most recent numbers and smaller weight to most old days:
EMA(t)=EMA(t-1)+SF*(P(t) -EMA(t-1)) ;
P(t) – is a price in period (t), that you intend to use in calculation. Usually, this is the close price;
EMA(t) – is a most recent value of EMA;
EMA(t-1) – is a previous recent value of EMA;
SF – is a smoothing factor. As a rule it equals 2/(n+1), where n – is a number of periods of EMA
Pipruit: Commander, it’s way too complicated…
Commander in Pips: Well, in fact, this is not crucial for you to know the formula, because software will do this automatically. But still, I suppose this will be useful, try to calculate it, at least once. Ok, I do it by myself. Let’s calculate the same 7-period MA, but using exponential way of averaging:
Here we use the same close prices and candles as in previous part, when we’ve calculated SMA. Take a note, that EMA(t-1) value for the 7th period (most distant in time) is a close price of 8th bar, that stands before our seven consecutive close prices, that directly used in calculation. Now look at the chart:
If you take a look at previous retracement, when 4 consecutive black candles have appeared – we can see the same – EMA moved below SMA and has shown sharper reaction to sentiment changing.
From this perspective it appears, that an EMA better shows what traders are doing now, than SMA.
Modified Moving Average (MAV)
We will not speak much about this type of MA, because it does not have some exceptional qualities. But it does exist and we just specify formula for its calculation:
Maybe, sometime you will need it.
Commander in Pips: Well, in fact, this is not crucial for you to know the formula, because software will do this automatically. But still, I suppose this will be useful, try to calculate it, at least once. Ok, I do it by myself. Let’s calculate the same 7-period MA, but using exponential way of averaging:
| Period N | Total number of periods (n) | SF=2/(n+1) | Close price P(t) | EMA(t-1) | EMA(t) |
|---|---|---|---|---|---|
| 1 | 7 | 0.25 | 1.4185 | 1.4037 | 1.4074 |
| 2 | 7 | 0.25 | 1.4207 | 1.3980 | 1.4037 |
| 3 | 7 | 0.25 | 1.4137 | 1.3927 | 1.3980 |
| 4 | 7 | 0.25 | 1.3988 | 1.3907 | 1.3927 |
| 5 | 7 | 0.25 | 1.3882 | 1.3916 | 1.3907 |
| 6 | 7 | 0.25 | 1.3978 | 1.3895 | 1.3916 |
| 7 | 7 | 0.25 | 1.3973 | 1.3869 | 1.3895 |
Here we use the same close prices and candles as in previous part, when we’ve calculated SMA. Take a note, that EMA(t-1) value for the 7th period (most distant in time) is a close price of 8th bar, that stands before our seven consecutive close prices, that directly used in calculation. Now look at the chart:
Chart #1 EUR/USD Daily
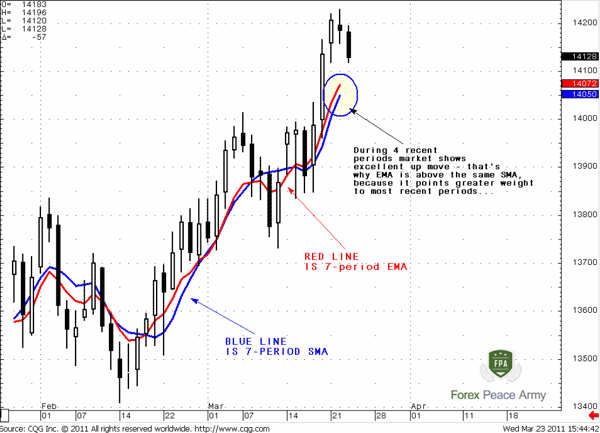
Our estimation of 7-period EMA is different from software’s calculation for 2 pips due rounding. But don’t be afraid – you will not have to do this manually. Let’s better to see, how the qualities of EMA manifest compares to SMA. In the circle we see that the EMA is above the SMA. This is because during the recent 4 periods, the market shows nice thrust move up. And, as we know, the EMA puts more weight onto the most recent periods. That’s why it shows most recent sentiment more clear.If you take a look at previous retracement, when 4 consecutive black candles have appeared – we can see the same – EMA moved below SMA and has shown sharper reaction to sentiment changing.
From this perspective it appears, that an EMA better shows what traders are doing now, than SMA.
Modified Moving Average (MAV)
We will not speak much about this type of MA, because it does not have some exceptional qualities. But it does exist and we just specify formula for its calculation:
MAV(t)=MAV(t-1)+(P(t) -MAV(t-1))/n
Maybe, sometime you will need it.
Comments

Hamza Samiullah
6 years ago,
Registered user
Excellent and interesting lesson..
O
One-fm
5 years ago,
Registered user
Very concise and insightful.
Table of Contents
- Introduction
- FOREX - What is it ?
- Why FOREX?
- The structure of the FOREX market
- Trading sessions
- Where does the money come from in FOREX?
- Different types of market analysis
- Chart types
- Support and Resistance
- Candlesticks – what are they?
- Mysterious Fibonacci
- Introduction to Moving Averages
- Bollinger Bands
- Leading and Lagging Indicators
- Basic chart patterns
- Pivot points – description and calculation
- Elliot Wave Theory
- Intro to Harmonic Patterns
- Divergence Intro
- Harmonic Approach to Recognizing a Trend Day
- Intro to Breakouts and Fakeouts
- Again about Fundamental Analysis
- Cross Pair – What the Beast is That?
- Multiple Time Frame Intro
- Market Sentiment and COT report
- Dealing with the News
- Let's Start with Carry
- Let’s Meet with Dollar Index
- Intermarket Analysis - Commodities
- Trading Plan Framework – Common Thoughts
- A Bit More About Personality
- Mechanical Trading System Intro
- Tracking Your Performance
- Risk Management Framework
- A Bit More About Leverage
- Why Do We Need Stop-Loss Orders?
- Scaling of Position
- Intramarket Correlations
- Some Talk About Brokers
- Forex Scam - Money Managers
- Graduation!