Part IV. Stochastic

Commander in Pips: Today we will talk about another widely used indicator – Stochastic. This is an indicator that unfortunately is very often used by traders in a wrong way. Some traders use them for trend identification, others – for estimating of overbought and oversold conditions on the market. Here we will discuss why Stochastic could not always be applied for those purposes. But before that, as usual, we start from simple description.
Pipruit: This will be interesting.
Commander in Pips: Stochastic consists of two lines and it’s similar to MACD in this sense. One of the lines is a fast one, second is a slow. But in distinction from MACD, Stochastic is a normalized indicator and scaled in the range between 0 and 100.
Pipruit: And what does it mean – “scaled”?
1. Estimation trend;
2. Estimation conditions of oversold and overbought.
Also Stochastic has so called extreme zones – extreme low zone is 0-25 and extreme high zone is 75-100. These zones are adjustable, so you can appoint not 25/75 but 35/65 for instance or 10/90.
Here is how it looks like – don’t pay much attention to rectangles – we will discuss them a bit later:
Chart #1 | Weekly EUR/USD and (8;3;3) Stochastic
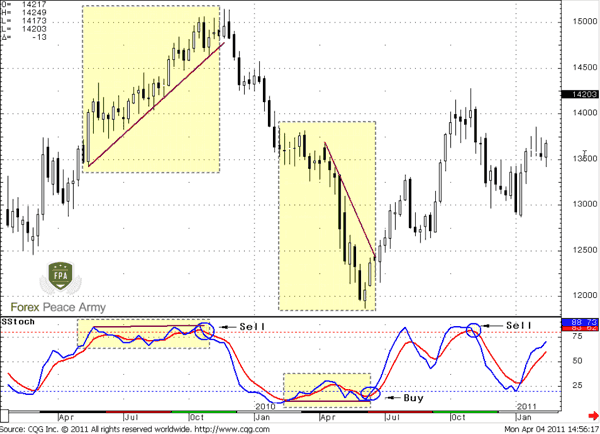
The fast line of stochastic (blue) is called %K, and the slow line (red) is called %D. Also you can see 25/75 extreme zones with horizontal dashed lines. For trading what usually applies to the so-called “Slow Stochastic” that uses two levels of averaging, while “Fast Stochastic” uses just single averaging.So, here is how it calculates:
Fast Stochastic:
%K = 100 [(C-Ln)/(Hn-Ln)],
C-recent close price;
Ln – lowest price for last n periods;
Hn – highest price for last n periods;
%D = Some MA from %K
This Stochastic is too choppy, so it’s rarely used in trading. The most common is Slow Stochastic:
Slow Stochastic:
It uses as fast line (%K) the %D line of fast stochastic (above):
%D of fast stochastic = %K of slow stochastic,
And %D = some MA from %K.
And %D = some MA from %K.
Hence, Slow Stochastic average initial %K line of fast stochastic twice.
We will talk only about Slow Stochastic.
So, any Stochastic has three input values:
1. Number of periods that used in %K calculation – usually 14 periods as default used;
2. The period of MA that used for first averaging. Usually 3 periods as default used;
3. The period of MA that used for second averaging. Usually 3 periods as default used;
Also, as you can see, I’ve pointed “Some MA”, because there could applied different types of MA for averaging – simple, exponential, smoothed, modified etc. This is depends on trading style and preferences of each trader. Personally, I use Slow Stochastic with (8; 3; 3) parameters and modified way of averaging. You should not think that this is not important – to use simple MA in Stochastic, Exponential, or, say, Smoothed. It IS very important. Because stochastic with same input parameters but with different averaging method will give you different signals. Do you hear me? You will have to spend a lot of time before the computer for estimation which one Stochastic and its parameters are better personally for you. Also, keep in mind that different software has the same indicator name, but could use an absolutely different averaging method. As you understand – you have to investigate first to learn what kind of stochastic in this software is, and only after that apply it.
And now tell me – why Stochastic couldn’t move beyond 0 and 100?
Pipruit: Commander, math is not my strong side, you know…
Commander in Pips: Don’t worry – just think a bit. I gave you the clue – the answer is in %K calculation…
Pipruit: Ok, let’s see. The difference between High and Low for n recent periods (Hn-Ln) estimates the trading range of recent n periods. That’s obvious. And the latest close price has to stand in this range – this is also obvious. (C-Ln) – this difference estimates how our close price far from lowest price of last n periods. But this difference couldn’t be more than (Hn-Ln). If Close price C is higher than Hn – then Hn will be automatically equal to C and %K = 100%. Ok, looks like I’ve got it! %K shows in percents how much (C-Ln) range from (Hn-Ln) range. Since Hn and Ln are absolute high and low of recent N periods including our close price, then %K could not be more than 100% or less than zero, because our close price could not be higher than Hn and lower than Ln.
Commander in Pips: See – you can do this. But this extremely important conclusion leads to some unwelcome properties of Stochastic. So, let’s pass to discussion of it’s application.
STOCHASTIC APPLICATION
Estimation trend
The general rule of trend estimation is the same as with MACD. When the fast line crosses the slow line from below and passes above it – the trend turns bullish. When the fast line crosses the slow one from above and passes below it – the trend is bearish, but these crosses should happen in extreme zones. This is the difference of Stochastic!
1. When fast line crosses slow line in low extreme zone (0-25), passes above it and both lines move above 25 level of Stochastic – the trend turns bullish (Buy Signal);
2. When fast line crosses the slow one in up extreme zone (75-100) from above, passes below it and both lines move below 75 level of Stochastic – the trend is bearish.
The major error with using stochastic for that purpose is to think that the trend shifts when lines cross in extreme zone. No. Not only cross in extreme zone, but lines should move out from zone to create a signal of trend shifting. This is important.
It leads us to important conclusion in applying Stochastic. Stochastic could show as many crosses as it wants in the extreme areas, but we will not treat it as trend shifting until the lines will move outside of this extreme zone.
Now the time has come to take a look at rectangles on chart #1. Describe them for me, by applying rules that we’ve just pointed…
Pipruit: Well, I see that Stochastic shows some crossing inside extreme zones, but the market continues its move in the same direction, and this move was significant. Trend has really shifted when Stochastic has shown final cross inside the zones and then lines passed out from there.
Commander in Pips: Yes, that’s it. Also I want to add, that Stochastic is better to use for intraday trend estimation, rather than on daily and higher time frames.
Estimation Oversold/Overbought conditions
Many traders use Stochastic for that purpose also, but very often use it wrong. It is recognized that the market is overbought when Stochastic exceeds the 75 level and oversold, when it falls below the 25 level. But this is not how G. Lane, Stochastic creator, teaches us. If you still are not sure that this is it – take a look at the rectangles again, on Chart #1. See – stochastic stands above 75 and below 25 for a long time, but the market is going and going further. Hence – this is a wrong approach to estimation overbought and oversold condition of the market.
Pipruit: But why is it happening in that way?
Commander in Pips: This is because of how Stochastic is scaled. We already know, that stochastic couldn’t move higher than 100 and lower than 0. Hence, if market shows some nice thrust and Stochastic reaches, say 85, then in this case the Stochastic has only 0.15 of free space to move up for all possible market upmove continuation. This has forced stochastic to stay around the 80 area, despite o how far the market will move. Particularly this you can see in the rectangles. It means that application of Stochastic for overbought and oversold estimation is limited – you will be “killed”, if have entered the market due to these signals.
Personally I do not use Stochastic for overbought/oversold estimation, generally due to its normalization. I think that an indicator should be not normalized for this purpose.
Pipruit: Thanks, I see.
Commander in Pips: Another negative moment of using Stochastic is that you rarely will able to enter the market on a retracement due to its signal. For instance, the market shows an excellent move up, Stochastic stands above 75 for some time. Now the market is turning to retracement and shows a gradual move down. For instance, you intend to use this pullback to enter Long. But for that purpose, you need a Stochastic “Buy” signals according to our rule – crossing lines below 25 and moving outside. And I tell you, that you hardly could get such a signal during a solid up trend. The same for a downtrend. So, here are my thoughts:
1. Applying strict rules of signal creating could lead to acceptable results. But if the move will be significant, you have the risk not to get signal from Stochastic during pullback, that you intend to use for entering the market;
2. Better is to use Stochastic on intraday charts for trend estimation;
3. Stochastic is hardly suitable for Oversold/Overbought estimation, because:
- Many significant moves happen, when stochastic already stands above 75 or below 25 – just take a look at Chart #1 again;
- Stochastic is scaled (normalized) in 0-100 range, hence it does not have enough room to clearly show oversold and overbought condition.
You can try Stochastic for both purposes, may be you will be able to tune Stochastic, so that it will become your favorite trading tool. And our discussion today will help you to avoid possible confusing moments.
Later we will take a look at MACD/Stochastic combination for trend estimation.
Comments
I
ITtrader
12 years ago,
Registered user
So what are the numbers I plug in for the stochastic?

Sive Morten
12 years ago,
Registered user
Well, I use 8;3;3, default settings usually are 14;3;3
O
oficiuljuridic
12 years ago,
Registered user
Hello Sive,
Can you please tell me aditionally what kind of MA method do you use for Slow Stochastic: exponential MA or smoothed MA?
Also in MT4 platform at "Price field" are two options:Low/High and Close/Close. Which one do you use it? I want to set parameters exactly how you use them.
And finally what levels do you use for signals of Slow Stochastic: 20/80 (default in MT4) or 25/75 and for what timeframes (H1 or H4)?
Thank you in advance.
Sive Morten
12 years ago,
Registered user
> Hello Sive,
Can you please tell me aditionally what kind of MA method do you use for Slow Stochastic: exponential MA or smoothed MA?
Also in MT4 platform at "Price field" are two options:Low/Hi..
Hi Oficiuljuridic,
Well, in general I do not use Stochastic very often.
I use smoothed method of averaging for Stochastic, applied to close.
I do not use levels for Stochastic, since I do not use it for oversold/overbought analysis. Due to the approach that I apply - for me only crossover makes sense.
I use DiNapoli technique of MACD and Stochastic combination for trend identifcation.
O
oficiuljuridic
12 years ago,
Registered user
Hello again Sive,
So, please tell me if I understood corectly.
If I apply your aproach in using Slow stochastic for 15 min, 30 min or H1 timeframe, the signal for entering in the trade is when the fast line crosses slow line, no metter if this happens in or outside the extremes zones.
I set slow stochastic with 8,3,3 on close prices and on historic data I noticed that statisticaly it gives very good signals (on 15 min and 30 min and on h1 timeframe) almost at every crossing independently of the zone in which the crosing occurs.
Please tell me if I understood wrong.
Thank you again for your help.
Sive Morten
12 years ago,
Registered user
> Hello again Sive,
So, please tell me if I understood corectly.
If I apply your aproach in using Slow stochastic for 15 min, 30 min or H1 timeframe, the signal for entering in the trade is when..
Hi oficiuljuridic,
not quite. I said "I use DiNapoli technique of MACD and Stochastic combination for trend identifcation"
It means that I do not use just Stochastic alone - only in link with MACD.
Second, it depends on purpose of using. I use for trend identification, particular checking Fib levels/strength.
If you use stochastic for oversold/overbought analysis - this is quite another story.

Hamza Samiullah
6 years ago,
Registered user
Nice indicator....
O
One-fm
5 years ago,
Registered user
Stoch is good for intraday trade. Thanks.
Table of Contents
- Introduction
- FOREX - What is it ?
- Why FOREX?
- The structure of the FOREX market
- Trading sessions
- Where does the money come from in FOREX?
- Different types of market analysis
- Chart types
- Support and Resistance
- Candlesticks – what are they?
- Mysterious Fibonacci
- Introduction to Moving Averages
- Bollinger Bands
- Leading and Lagging Indicators
- Basic chart patterns
- Pivot points – description and calculation
- Elliot Wave Theory
- Intro to Harmonic Patterns
- Divergence Intro
- Harmonic Approach to Recognizing a Trend Day
- Intro to Breakouts and Fakeouts
- Again about Fundamental Analysis
- Cross Pair – What the Beast is That?
- Multiple Time Frame Intro
- Market Sentiment and COT report
- Dealing with the News
- Let's Start with Carry
- Let’s Meet with Dollar Index
- Intermarket Analysis - Commodities
- Trading Plan Framework – Common Thoughts
- A Bit More About Personality
- Mechanical Trading System Intro
- Tracking Your Performance
- Risk Management Framework
- A Bit More About Leverage
- Why Do We Need Stop-Loss Orders?
- Scaling of Position
- Intramarket Correlations
- Some Talk About Brokers
- Forex Scam - Money Managers
- Graduation!