Part IV. More About Fractals

Pipruit: Tell me about it!
Commander in Pips: So, I offer you today take a look at fractals in application to EW and take a look what does “fractal” mean to Wave theory.
Pipruit: This will be great, because you’ve kept talking about “fractals, fractals” all the time. Although I foggily understand what it means, further clarification will be very welcome.
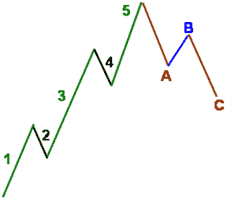
Commander in Pips: So, here we can see 5-wave impulse pattern and 3-wave countertrend correction that we’ve discussed on the second and third parts of current chapter:
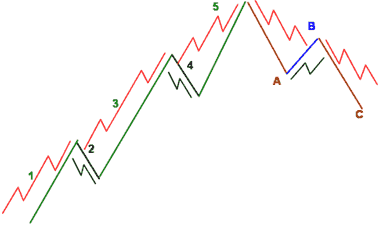
You will be able to see it, if, for instance, you will find 5-3-wave pattern on weekly chart and then drop your time frame to daily or even 4-hour. Here it will be easy to see. Moving in that direction will lead you to deep detailed picture as in part 1, here you can see one grade more decompose:
Pipruit: Wait a minute, looks like I’ve got it now. It reminds me nesting cups. First we see big waves – 5-wave impulse move and 3-wave corrective move. Then each of them could be shown in 5-wave pattern, even corrective move. And then again, but during the last decompose – only impulse waves could be shown as 5-wave but corrective waves only as 3-wave.
Pipruit: So, for instance, if you find out that market has accomplished initial 5-wave move up, then shown 3-wave corrective and accelerated above 5-th wave high, so what, we can say that all this 5-3 move was just 1st and second waves of larger pattern? Or, say third and 4th?
Commander in Pips: Aha.
Pipruit: Wow! And how we can trade it at all, how we will estimate what wave currently stands?
Commander in Pips: That is a major problem when you dealing with EW. But do not worry too much. Because, let’s suppose that you trade on hourly chart and you see that 4 waves up were completed. You can calmly expect 5th wave and enter the market with some target. And here it’s not so important – do all that 5 waves is a first wave of weekly pattern or third, or fifth. Because you just want to take profit at the end of 5th wave on hourly chart. That makes trading with EW a bit simpler.
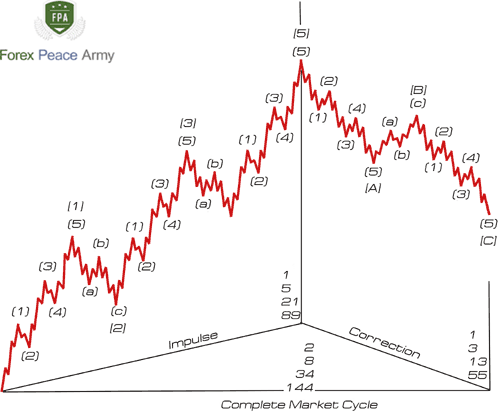
Commander in Pips: Since we’re speaking about different levels of cycles, they could be very different:
1. Grand Supercycle;
2. Supercycle;
3. Cycle;
4. Primary;
5. Intermediate;
6. Minor;
7. Minute;
8. Minuette;
9. Sub-Minuette.
Commander in Pips: I can’t believe it. You figured it out.
Commander in Pips: As fast as we will need it.
Commander in Pips: Soon. Ok, since you’re in such a hurry, I’ll give you one chart at the end of the current lesson, but before that let’s fast repeat major rules of EW theory, concerning waves:
1. Wave 3 could never be the shortest impulse wave;
2. Wave 2 could never be beyond the start of 1st wave – either on bear or bull market;
3. Wave 4 could never overlap with 1st wave – other words price on wave 4 could not move in the range of first wave.
Now, as you truly specified our major task is correctly identify waves itself. When you will get some skills and become a skilled hand in EW, you will be able to recognize what wave currently develops and what kind of position you should take. But these three rules have to be unbroken.
Here some additional specification that very often take place, but followed statements are not so untouchable as those 3-rules:
1. Remember about Truncation of 5th wave. Sometimes its high/low could be lower/higher of the third wave on bull/bear market. It happens due to overbought/oversold condition that is very often happens during 5th wave;
2. Usually wave 3 is most extended, strong and sharp. Although, as we’ve said waves 1 and 5 also could be extended;
3. Waves 2 and 4 typically retrace to Fibonacci retracement levels of waves 1 and 3 correspondingly;
4. If we draw parallel channel, based on starting points of waves 3 and 5 – then the extreme of the 5 wave very often exceed upper/lower border of this channel on bull/bear market.
Ok, here is your chart – Weekly EUR/USD. I’ve chosen a simple piece of it, so you can clearly see the waves:
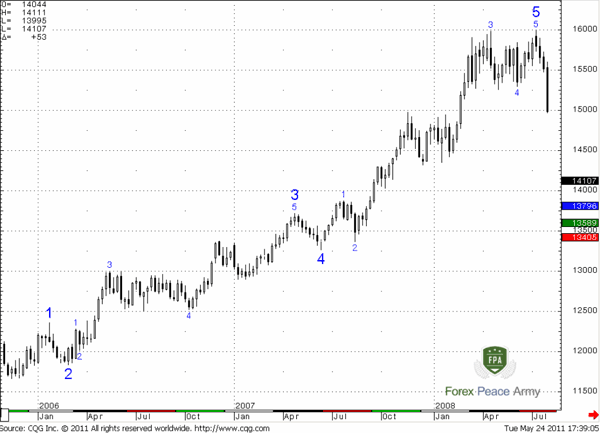
See – larger numbers are waves of larger degree. You can see how 3d large wave consists of 5-wave pattern, so as 5th large one. Both of them are rather extended by the way. Also you can see the Truncation of smaller 5th wave right at the top around all time high of EUR/USD – 1.60.
See – larger numbers are waves of larger degree. You can see how 3d large wave consists of 5-wave pattern, so as 5th large one. Both of them are rather extended by the way. Also you can see the Truncation of smaller 5th wave right at the top around all time high of EUR/USD – 1.60.
Commander in Pips: Yes, looks nice, but also not as perfect as on schematic pictures. As we said – sometimes it’s very difficult to mark the waves correctly. But since you will dive in it – your skills will be better and better. So, let’s talk about how to trade them…
Commander in Pips: That is a major problem when you dealing with EW. But do not worry too much. Because, let’s suppose that you trade on hourly chart and you see that 4 waves up were completed. You can calmly expect 5th wave and enter the market with some target. And here it’s not so important – do all that 5 waves is a first wave of weekly pattern or third, or fifth. Because you just want to take profit at the end of 5th wave on hourly chart. That makes trading with EW a bit simpler.
Pipruit: Well, probably you’re right. Thanks.
1. Grand Supercycle;
2. Supercycle;
3. Cycle;
4. Primary;
5. Intermediate;
6. Minor;
7. Minute;
8. Minuette;
9. Sub-Minuette.
Pipruit: Ok, ok, let me guess. Grand Supercycles consist of Supecycles, Supercycles consist of Cycles, Cycles consist of Primary cycles and…
Pipruit: Thank you. And when we will see them on real charts?
Pipruit: I see. And when we will need it?
1. Wave 3 could never be the shortest impulse wave;
2. Wave 2 could never be beyond the start of 1st wave – either on bear or bull market;
3. Wave 4 could never overlap with 1st wave – other words price on wave 4 could not move in the range of first wave.
Now, as you truly specified our major task is correctly identify waves itself. When you will get some skills and become a skilled hand in EW, you will be able to recognize what wave currently develops and what kind of position you should take. But these three rules have to be unbroken.
Here some additional specification that very often take place, but followed statements are not so untouchable as those 3-rules:
1. Remember about Truncation of 5th wave. Sometimes its high/low could be lower/higher of the third wave on bull/bear market. It happens due to overbought/oversold condition that is very often happens during 5th wave;
2. Usually wave 3 is most extended, strong and sharp. Although, as we’ve said waves 1 and 5 also could be extended;
3. Waves 2 and 4 typically retrace to Fibonacci retracement levels of waves 1 and 3 correspondingly;
4. If we draw parallel channel, based on starting points of waves 3 and 5 – then the extreme of the 5 wave very often exceed upper/lower border of this channel on bull/bear market.
Ok, here is your chart – Weekly EUR/USD. I’ve chosen a simple piece of it, so you can clearly see the waves:
Pipruit: Cool!
Commander in Pips: Yes, looks nice, but also not as perfect as on schematic pictures. As we said – sometimes it’s very difficult to mark the waves correctly. But since you will dive in it – your skills will be better and better. So, let’s talk about how to trade them…
Comments

Hamza Samiullah
6 years ago,
Registered user
Nice lesson
O
One-fm
5 years ago,
Registered user
Good.
Table of Contents
- Introduction
- FOREX - What is it ?
- Why FOREX?
- The structure of the FOREX market
- Trading sessions
- Where does the money come from in FOREX?
- Different types of market analysis
- Chart types
- Support and Resistance
- Candlesticks – what are they?
- Mysterious Fibonacci
- Introduction to Moving Averages
- Bollinger Bands
- Leading and Lagging Indicators
- Basic chart patterns
- Pivot points – description and calculation
- Elliot Wave Theory
- Intro to Harmonic Patterns
- Divergence Intro
- Harmonic Approach to Recognizing a Trend Day
- Intro to Breakouts and Fakeouts
- Again about Fundamental Analysis
- Cross Pair – What the Beast is That?
- Multiple Time Frame Intro
- Market Sentiment and COT report
- Dealing with the News
- Let's Start with Carry
- Let’s Meet with Dollar Index
- Intermarket Analysis - Commodities
- Trading Plan Framework – Common Thoughts
- A Bit More About Personality
- Mechanical Trading System Intro
- Tracking Your Performance
- Risk Management Framework
- A Bit More About Leverage
- Why Do We Need Stop-Loss Orders?
- Scaling of Position
- Intramarket Correlations
- Some Talk About Brokers
- Forex Scam - Money Managers
- Graduation!