Part VI. Flags and Pennants

Pipruit: Yeah, this is quite pro-army topic, Sir.
Commander in Pips: Heh, right.
Commander in Pips: So, Flags and Pennants are continuation patterns. It looks like triangles, wedges and rectangles, but much smaller and their shape is not so accurate like we saw with former patterns. Usually they appear as pauses in a trend:
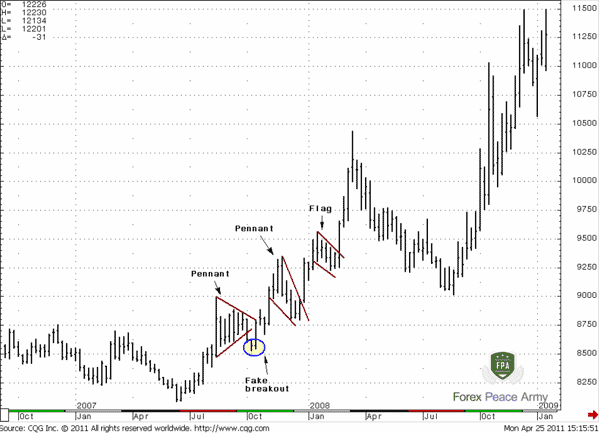
Chart #1 JPY/USD Weekly – Flags and Pennants
Commander in Pips: As a rule the slope of these patterns is opposite to the direction of the trend, but this is not absolutely necessary. If the slope coincides with trend direction then it tells us that the current trend is even stronger. Also these patterns could be horizontal instead of sloped:
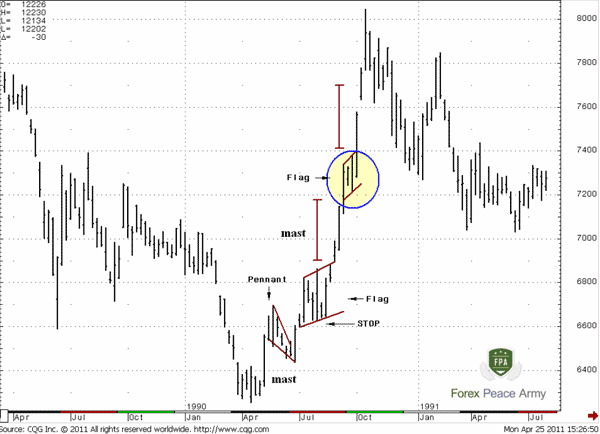
Chart #2 JPY/USD Weekly – Flags and Pennants with different slopes
Trading Flags and Pennants
These patterns could be early bystanders of the appearance of a reversal in trend, and warn us that this new trend has many chances for continuation. Look at chart #2 the first pennant was very tight and indicates very shallow retracement. The pennant appears after a strong up candle that was an initial thrust candle after a bear trend. This combination gives us a first clue that possibly the shift in market momentum has really happened.
Since flags and pennants are rather tight, short-term and small consolidation, the major approach to their trading is to open positions in direction of the trend inside the flag/pennant and place stop loss order at opposite border of the pattern. You can see it on chart #2. Say, we couldn’t enter on he first pennant, because weren’t sure that this is really reversal, but now we want to enter using the flag. We should buy somewhere inside the flag and place our stop below the lower border. Some traders enter the market when it gives confirmation of breakout of the pattern. But since flags and pennants are companions of strong trends, using such kind of entry could lead to you will miss a good trade, because when the breakout will be confirmed, the market could show a significant move up. Also your risk will be greater, since your stop loss order will be farther.
Another problem with flags and pennants is that sometimes they are very short-term, and finish even before you will be able to recognize them.
Usual the target of a potential move after the pattern equals the move before the pattern. Look at chart #2 on the flag in the circle – see, market shows the same move up after it has been formed, as the move before it has been formed and the previous flag. Usually, this previous move before the flag or pennant is called the “mast” or flagpole. Although this is a classical approach, you may use other target, for instance, based on Fib extensions on this swing. And simultaneously use flags or pennants for entering.
As with other patterns, flags and pennants could become an object of faked breakouts – look at chart #1 in the circle. If you’ve entered and your stop has been triggered, but then market returns back in the body of flag or pennant – you will have to enter again. Still, this is not as painful as trading wider patterns, because the range of pennants and flags is very small. Hence, your stop loss will be placed tight, and even if you will have to enter again, this will not be so harmful to you. In the case of a fake breakout, you have to place your stop beyond it during the second entry. On chart #1 you should buy at the bar that returns back into pennant with a stop loss below the low in the circle.
Here is how it looks like during bear trend:
Chart #3 CHF/USD 60-min. Flag.
Comments

Hamza Samiullah
6 years ago,
Registered user
Nice work...
O
One-fm
5 years ago,
Registered user
flags and pennants.
Table of Contents
- Introduction
- FOREX - What is it ?
- Why FOREX?
- The structure of the FOREX market
- Trading sessions
- Where does the money come from in FOREX?
- Different types of market analysis
- Chart types
- Support and Resistance
- Candlesticks – what are they?
- Mysterious Fibonacci
- Introduction to Moving Averages
- Bollinger Bands
- Leading and Lagging Indicators
- Basic chart patterns
- Pivot points – description and calculation
- Elliot Wave Theory
- Intro to Harmonic Patterns
- Divergence Intro
- Harmonic Approach to Recognizing a Trend Day
- Intro to Breakouts and Fakeouts
- Again about Fundamental Analysis
- Cross Pair – What the Beast is That?
- Multiple Time Frame Intro
- Market Sentiment and COT report
- Dealing with the News
- Let's Start with Carry
- Let’s Meet with Dollar Index
- Intermarket Analysis - Commodities
- Trading Plan Framework – Common Thoughts
- A Bit More About Personality
- Mechanical Trading System Intro
- Tracking Your Performance
- Risk Management Framework
- A Bit More About Leverage
- Why Do We Need Stop-Loss Orders?
- Scaling of Position
- Intramarket Correlations
- Some Talk About Brokers
- Forex Scam - Money Managers
- Graduation!