Part I. Risk Management Framework


Pipruit: That’s great. Actually this is one of the main parts in my trading system that demands more clarification.
The same is with trading. Since we intend to start a business and we want to make money on it – we also have to know how safely avoid unnecessary loss and eliminate possible scenarios where such losses could appear. That is risk management. This topic is crucially important, since saving earned profit is as hard to keep as it was to earn, or even harder.
Commander in Pips: That’s why if some trader just approximately counts up in his head acceptable loss and in hasty rush runs to use his trading software, then we might say that his plans are in a bad way. This is more a gambling plan rather that a serious and long-term business start-up plan.
We even could say more clearly – trading without money/risk management is gambling…
Pipruit: Well, but I have a chance to get a jackpot in Vegas…
Pipruit: Well, I suppose because they earn more than they lose…
Pipruit: Hm, I don’t think so. Gambling is a big business, so with casinos, it has to be planned carefully.
Commander in Pips: That is risk and money management. A simple gambler could win an occasionally jackpot, but if he will try it again – he will spend all of this prize and have to add more to do it. Other gamblers also win from time to time but they always will stand in some loss, because statistics are not on their side.
You probably know that there were some persons who have won in casinos, but what did they do? They apply statistics and count every step. This can let a few of them find ways to win.
So, if you want to stay profitable in the long run, then you have to get statistics on your side and you have to apply such things that will turn the equilibrium in your favor at any possibility and any trade.
Pipruit: Nice explanation sir. I think I’m starting to understand…
Commander in Pips: That’s good. So, if we have come to the conclusion that money management is must, from what should we start? I offer to move from general to specific. General is overall capitalization and planning of trading as a business. Here I have to send you to the chapter, where we’ve discussed this in details in Chapter 29. Part II. >>
When you’ve estimated how much money you will need for starting this business and support it in long-term, then can talk about the specific issue – how much money should be in your trading account…
Pipruit: I know this already!
Pipruit: 25 bucks minimum.
Pipruit: Well, I ran through some brokers’ conditions and many of them allow you to open an account with just 25 bucks.
Pipruit: Why?
Let’s suppose that current EUR/USD rate is 1.3480. Then we might say that with 99% probability rate will hold in the range (1.3480 - 1.3480*0.7%*3) – (1.3480+1.3480*0.7*3%) or 1.3763 – 1.3197, so your drawdown on position will not exceed 280 pips (since we need only a negative one). Ok, with 95% probability it will not exceed even 190 pips per day. Is it too much or too few?
Pipruit: Hm, 180 pips risk a day at minimum seems rather solid to me.
Pipruit: 1000*0.0188 = 18.8 bucks with 95% probability and 28 bucks with 99% probability…
Pipruit: Wait a minute, and how I can trade with just 25 bucks?
Pipruit: So, what I have to do?
Commander in Pips: You need a bit more money to start. Let’s calculate the absolute minimum as a start-up sum on forex to trade. We will give the simplest approach to calculation. Later, you may find and apply some more sophisticated approach – there are a lot of books dedicated to risk management.
So, our rule is to not risk more, than 1 % from initial total assets in every trade. Hence we will be able to make 100 losing trades in a row. Our maximum loss, according to minimum daily volatility is 280 pips. If the minimum lot that we can trade is 0.01. Hence our minimum assets are: (100,000*0.01*280pips)/1% = 2800 USD. But this is a minimum volatility. Maximum volatility, at least during recent couple of years is 4 times higher. Hence our assets should be at average (2800+11,200)/2 ~ 7000 USD. That is a normal start-up sum. If you intend to trade with, say, 0.1 lot, you will need $70K. Intraday charts have smaller volatility, so if you want to trade intraday you may need smaller assets to start with. So, this is some material to think about.
Commander in Pips: Probably you do. But now imagine how much you will earn, if the market will show a 100 pip move in your favor – 100,000*0.001*0.0100 = 1$. Probably this is a true prize for your hard work on the market. Maybe it’s better to make bet for some 90% Manchester United win over a weak team with the smallest ratio, say, 1.1 – you’ll get about 2.5$ profit. Think about it. You have to feel the results of your hard work, otherwise, you will lose any interest in the trading process.
Prepare to drawdown
Commander in Pips: Every trader should be prepared to deal with possible drawdown of his/her account. This is just a continuation of the previous part. Here is the chart of assets value on an account. The X-axis shows the number of trades, while the Y-axis assets value. Initially deposited assets were $5000. We see a pretty nice profit picture, but during recent time assets start to fall. The distance between most recent high to most recent low is a drawdown. Here it is $8200 – $7400~ $800. Previous drawdown was very small in 4th trade – just around 50$.
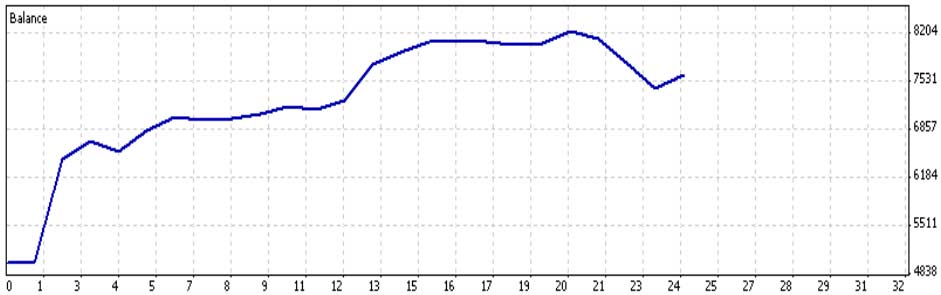
Statistics of this account tells us that the trader has 66.67% of profitable trades and 33.33% of losing trades. If trader will continue work in such manner, he or she should lose no more than 33 trades out of 100. This is a nice ratio. But, can you tell me, to what consequence these trades will come?
Statistics of this account tells us that the trader has 66.67% of profitable trades and 33.33% of losing trades. If trader will continue work in such manner, he or she should lose no more than 33 trades out of 100. This is a nice ratio. But, can you tell me, to what consequence these trades will come?
Commander in Pips: Most probable that you’re right, but we have to look at a worst case scenario, if they will all come initially. In other words, if the trader will lose 33 trades in a row and only after that do 66 profitable trades come. Statistics of this account also tells us that the average loss trade is $133. Hence, 33*133 = $4,389 will be the approximate drawdown if trader will resume the same performance and trading style. From that standpoint we see that the trader applied acceptable money management, since it assumes that it could make twice more losing trades and some assets will remain in the account still.
Commander in Pips: This is also some insurance for some case if something will change in the trading system or style, so that the trader could not support the same performance and it will become worse. Particularly due to that reason we advise you to risk not more than just 1.5 % of assets in each trade. This will allow you to make 66 losing trades in a row before you will devastate your account. That is a sufficient balance, since we hope that you will get the point that something is wrong if you will make 10-20 losing trades in a row. A wise trader understand that he/she will not win every trade, so he/she has to plan risk so that there will be some reserves for really bad times.
Commander in Pips: Well, although we have shown simplest way, actually you’re right. You have to risk a smaller part of your assets, if you have lost something already. In fact, your percent risk will remain the same, while your dollar risk will become lower.
Commander in Pips: You need a bit more money to start. Let’s calculate the absolute minimum as a start-up sum on forex to trade. We will give the simplest approach to calculation. Later, you may find and apply some more sophisticated approach – there are a lot of books dedicated to risk management.
So, our rule is to not risk more, than 1 % from initial total assets in every trade. Hence we will be able to make 100 losing trades in a row. Our maximum loss, according to minimum daily volatility is 280 pips. If the minimum lot that we can trade is 0.01. Hence our minimum assets are: (100,000*0.01*280pips)/1% = 2800 USD. But this is a minimum volatility. Maximum volatility, at least during recent couple of years is 4 times higher. Hence our assets should be at average (2800+11,200)/2 ~ 7000 USD. That is a normal start-up sum. If you intend to trade with, say, 0.1 lot, you will need $70K. Intraday charts have smaller volatility, so if you want to trade intraday you may need smaller assets to start with. So, this is some material to think about.
Pipruit: I see. Sounds logical, but sir, I’ve heard that there are brokers that allow you to choose any lot size. So, if I choose 0.001 lot, probably I can trade with just 25 bucks.
Prepare to drawdown
Commander in Pips: Every trader should be prepared to deal with possible drawdown of his/her account. This is just a continuation of the previous part. Here is the chart of assets value on an account. The X-axis shows the number of trades, while the Y-axis assets value. Initially deposited assets were $5000. We see a pretty nice profit picture, but during recent time assets start to fall. The distance between most recent high to most recent low is a drawdown. Here it is $8200 – $7400~ $800. Previous drawdown was very small in 4th trade – just around 50$.
Pipruit: Hardly sir, but I suppose that they will spread somehow among profitable trades…
Commander in Pips: Most probable that you’re right, but we have to look at a worst case scenario, if they will all come initially. In other words, if the trader will lose 33 trades in a row and only after that do 66 profitable trades come. Statistics of this account also tells us that the average loss trade is $133. Hence, 33*133 = $4,389 will be the approximate drawdown if trader will resume the same performance and trading style. From that standpoint we see that the trader applied acceptable money management, since it assumes that it could make twice more losing trades and some assets will remain in the account still.
Commander in Pips: This is also some insurance for some case if something will change in the trading system or style, so that the trader could not support the same performance and it will become worse. Particularly due to that reason we advise you to risk not more than just 1.5 % of assets in each trade. This will allow you to make 66 losing trades in a row before you will devastate your account. That is a sufficient balance, since we hope that you will get the point that something is wrong if you will make 10-20 losing trades in a row. A wise trader understand that he/she will not win every trade, so he/she has to plan risk so that there will be some reserves for really bad times.
Pipruit: Sir, some idea has come to me, I’m just wondering – since our assets becomes lower with each losing trade – should we apply the 2% rule for initial assets value or to current assets value? In other words, should we reduce trading lot size if we assume that stop-loss distance will remain constant?
Pipruit: But sir, in this case it will be much harder to return all loses back, since with smaller positions we will have to earn more pips to return previous losses.
Commander in Pips: Absolutely. That’s why it is so important not just earn pips, but to save them. This is even more important, I suppose. To illustrate it, let’s take a look at following table:
So, from table you can see, that even if you will adjust loss value proportionally to the rest of your assets, you will have to earn more of a percent to get back to breakeven than your drawdown is. For example, after 20 loss trades your drawdown will be 33% from initial assets value. But since now you have just $6,676, you have to earn almost 50% to return back to 10,000$. Ultimately if your drawdown will be 90% and you will rest with just $1000, then how much you will have to earn in percents to return back to $10,000?
Commander in Pips: Yes, this is a tough task to do – make a 9x times of your account. So, let’s take a look at this process visually with the following chart:
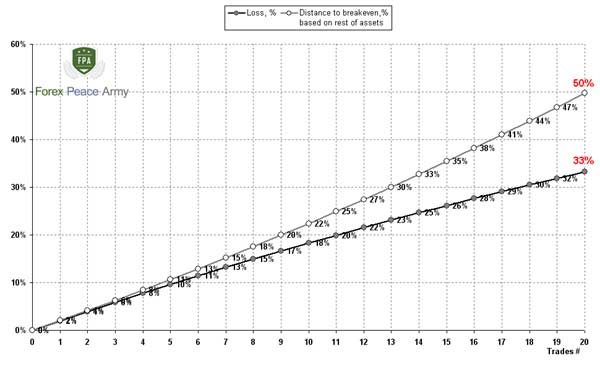
You can see, that although loss develops proportionally to initial deposit, it is not proportionally to the rest of assets – you have to return more proportionally as you lose more of your account.
Commander in Pips: Absolutely. That’s why when you’ve got a solid drawdown it will be harder and harder to return all loss back to breakeven, i.e. initial assets value.
Couple of words about Reward/Risk ratio
Commander in Pips: Here is another issue that lets you understand why a trading journal and statistical numbers are important. In fact, Reward/Risk ratio is a relationship between your potential loss and potential profit in each trade. For example, if you’ve placed stop loss to 50 pips, while your profit has placed at 100 pips, then your Reward/Risk ratio is 2:1 or simply 2. Now, let’s understand why statistics are so important here - mostly because there is a balance between your system's effective strength and your reward/risk ratio. For example, if your trading system shows 50% of profitable trades, that your reward/risk ratio should be greater than 1. Otherwise you will stand at or below breakeven and will not earn anything. On following table we will show edge reward/risk ratios depending on your system % Win trades ratio:
This is very simple to understand. For instance, if you win just in a single trade from ten possible, you have to earn so, that compensate all loss in other 9 trades and get some profit. So you have to earn, say, at least 100 pips in 1 trade and lose no more than 90 pips in the 9 rest.
Actually, although we’ve pointed out that if you have super efficient system with 90 % winning trades you can let yourself to use just 0.1 reward/risk ratio – this is not wise. Statistically yes, you will earn profit, but logically there is no sense to take Reward/risk ratio less than 1 in any trade. A ratio of less than 1 skewed chances of success against you with many repetitions of such trades. A trader’s major task is to increase probability of success in any trade. That’s why he/she should not apply Reward/risk ratio less than 1 in any trade. Usually it is recommended to apply a 2:1 or even 3:1 ratio, but we have to point out that this is not a hard-rock ratio that could not be changed. If you will base your trades on a constant ratio this will lead to some problems – your targets could be too far, relative to what analysis tells you, you will trade too big of lots, or place too tight of stop-loss orders. Reward/risk ratio is a consequence but not the reason.
We recommend dealing with it as follows. Make your analysis of the market and estimate crucial levels for your scenario. Let’s suppose you intend to enter Long on EUR/USD from 1.3520 level on hourly chart and you have estimated that if market will break down 1.3470 area – this will significantly increase the probability of downward acceleration and your bullish scenario will have vanished. So, your crucial level is 1.3470 + some room. Hence, you will place stop somewhere around 1.3450 probably. Your risk is 80 pips.
Now estimate your target. Let’s suppose that nearest 0.618 target of some AB-CD extension stands at 1.3590 and initially you intend to take it. Here is your reward risk ratio is 7:8<1, and probably you have to reject this trade as ineffective.
If market will show some deeper retracement and your context for a long trade will still hold, say to 1.3490, then you can try it, because now you will have 100:40=2.5>1 reward/risk ratio.
The major mistake that many traders do with reward/risk calculation is force it to context, or force orders’ placement to reach a ratio greater than 1. This is quite unwise. Reward/risk ratio is a statistical measure but not a tool that brings you money. You may reach a ratio>1 by artificially placing orders, take bad trades and lose money – will it be nice, will you be happy that you at least had ratio>1? I don’t think so. This ratio is a tool, but not a goal to achieve. It lets you escape unwelcome trades. So use it accordingly. Besides, acting like this you break your trading system and do not follow the trading plan – one mistake triggers others.
Commander in Pips: Absolutely. That’s why it is so important not just earn pips, but to save them. This is even more important, I suppose. To illustrate it, let’s take a look at following table:
| Trade # | Assets Value | Supposed 2% Loss | Loss, % | Distance to Breakeven,% Compared to the Rest of Assets |
|---|---|---|---|---|
| 0 | 10,000 | 200 | 0% | 0% |
| 1 | 9,800 | 196 | 2% | 2% |
| 2 | 9,604 | 192 | 4% | 4% |
| 3 | 9,412 | 188 | 6% | 6% |
| 4 | 9,224 | 184 | 8% | 8% |
| 5 | 9,039 | 181 | 10% | 11% |
| 6 | 8,858 | 177 | 11% | 13% |
| 7 | 8,681 | 174 | 13% | 15% |
| 8 | 8,508 | 170 | 15% | 18% |
| 9 | 8,337 | 167 | 17% | 20% |
| 10 | 8,171 | 163 | 18% | 22% |
| 11 | 8,007 | 160 | 20% | 25% |
| 12 | 7,847 | 157 | 22% | 27% |
| 13 | 7,690 | 154 | 23% | 30% |
| 14 | 7,536 | 151 | 25% | 33% |
| 15 | 7,386 | 148 | 26% | 35% |
| 16 | 7,238 | 145 | 28% | 38% |
| 17 | 7,093 | 142 | 29% | 41% |
| 18 | 6,951 | 139 | 30% | 44% |
| 19 | 6,812 | 136 | 32% | 47% |
| 20 | 6,676 | 134 | 33% | 50% |
So, from table you can see, that even if you will adjust loss value proportionally to the rest of your assets, you will have to earn more of a percent to get back to breakeven than your drawdown is. For example, after 20 loss trades your drawdown will be 33% from initial assets value. But since now you have just $6,676, you have to earn almost 50% to return back to 10,000$. Ultimately if your drawdown will be 90% and you will rest with just $1000, then how much you will have to earn in percents to return back to $10,000?
Pipruit: 9000/1000 = 900%! That’s almost impossible, especially if we will take into consideration that you’ve lost 90% of your account.
Commander in Pips: Yes, this is a tough task to do – make a 9x times of your account. So, let’s take a look at this process visually with the following chart:
You can see, that although loss develops proportionally to initial deposit, it is not proportionally to the rest of assets – you have to return more proportionally as you lose more of your account.
Pipruit: Yes, now I understand that. The reason is that you stand with less amount of money with each loss, while loss itself remains the same. So you have to earn more in percents on the rest of your assets.
Couple of words about Reward/Risk ratio
Commander in Pips: Here is another issue that lets you understand why a trading journal and statistical numbers are important. In fact, Reward/Risk ratio is a relationship between your potential loss and potential profit in each trade. For example, if you’ve placed stop loss to 50 pips, while your profit has placed at 100 pips, then your Reward/Risk ratio is 2:1 or simply 2. Now, let’s understand why statistics are so important here - mostly because there is a balance between your system's effective strength and your reward/risk ratio. For example, if your trading system shows 50% of profitable trades, that your reward/risk ratio should be greater than 1. Otherwise you will stand at or below breakeven and will not earn anything. On following table we will show edge reward/risk ratios depending on your system % Win trades ratio:
| % Won Trades | Minimum Reward/Risk Ratio for Every Trade |
|---|---|
| 10 | must be greater than 9:1 |
| 20 | must be greater than 4:1 |
| 30 | must be greater than 2.3:1 |
| 40 | must be greater than 1.5:1 |
| 50 | must be greater than 1:1 |
| 60 | must be greater than 0.67:1 |
| 70 | must be greater than 0.43:1 |
| 80 | must be greater than 0.25:1 |
| 90 | must be greater than 0.11:1 |
This is very simple to understand. For instance, if you win just in a single trade from ten possible, you have to earn so, that compensate all loss in other 9 trades and get some profit. So you have to earn, say, at least 100 pips in 1 trade and lose no more than 90 pips in the 9 rest.
Actually, although we’ve pointed out that if you have super efficient system with 90 % winning trades you can let yourself to use just 0.1 reward/risk ratio – this is not wise. Statistically yes, you will earn profit, but logically there is no sense to take Reward/risk ratio less than 1 in any trade. A ratio of less than 1 skewed chances of success against you with many repetitions of such trades. A trader’s major task is to increase probability of success in any trade. That’s why he/she should not apply Reward/risk ratio less than 1 in any trade. Usually it is recommended to apply a 2:1 or even 3:1 ratio, but we have to point out that this is not a hard-rock ratio that could not be changed. If you will base your trades on a constant ratio this will lead to some problems – your targets could be too far, relative to what analysis tells you, you will trade too big of lots, or place too tight of stop-loss orders. Reward/risk ratio is a consequence but not the reason.
We recommend dealing with it as follows. Make your analysis of the market and estimate crucial levels for your scenario. Let’s suppose you intend to enter Long on EUR/USD from 1.3520 level on hourly chart and you have estimated that if market will break down 1.3470 area – this will significantly increase the probability of downward acceleration and your bullish scenario will have vanished. So, your crucial level is 1.3470 + some room. Hence, you will place stop somewhere around 1.3450 probably. Your risk is 80 pips.
Now estimate your target. Let’s suppose that nearest 0.618 target of some AB-CD extension stands at 1.3590 and initially you intend to take it. Here is your reward risk ratio is 7:8<1, and probably you have to reject this trade as ineffective.
If market will show some deeper retracement and your context for a long trade will still hold, say to 1.3490, then you can try it, because now you will have 100:40=2.5>1 reward/risk ratio.
The major mistake that many traders do with reward/risk calculation is force it to context, or force orders’ placement to reach a ratio greater than 1. This is quite unwise. Reward/risk ratio is a statistical measure but not a tool that brings you money. You may reach a ratio>1 by artificially placing orders, take bad trades and lose money – will it be nice, will you be happy that you at least had ratio>1? I don’t think so. This ratio is a tool, but not a goal to achieve. It lets you escape unwelcome trades. So use it accordingly. Besides, acting like this you break your trading system and do not follow the trading plan – one mistake triggers others.
Comments
Table of Contents
- Introduction
- FOREX - What is it ?
- Why FOREX?
- The structure of the FOREX market
- Trading sessions
- Where does the money come from in FOREX?
- Different types of market analysis
- Chart types
- Support and Resistance
- Candlesticks – what are they?
- Mysterious Fibonacci
- Introduction to Moving Averages
- Bollinger Bands
- Leading and Lagging Indicators
- Basic chart patterns
- Pivot points – description and calculation
- Elliot Wave Theory
- Intro to Harmonic Patterns
- Divergence Intro
- Harmonic Approach to Recognizing a Trend Day
- Intro to Breakouts and Fakeouts
- Again about Fundamental Analysis
- Cross Pair – What the Beast is That?
- Multiple Time Frame Intro
- Market Sentiment and COT report
- Dealing with the News
- Let's Start with Carry
- Let’s Meet with Dollar Index
- Intermarket Analysis - Commodities
- Trading Plan Framework – Common Thoughts
- A Bit More About Personality
- Mechanical Trading System Intro
- Tracking Your Performance
- Risk Management Framework
- A Bit More About Leverage
- Why Do We Need Stop-Loss Orders?
- Scaling of Position
- Intramarket Correlations
- Some Talk About Brokers
- Forex Scam - Money Managers
- Graduation!